June Lake, CA Map & Demographics
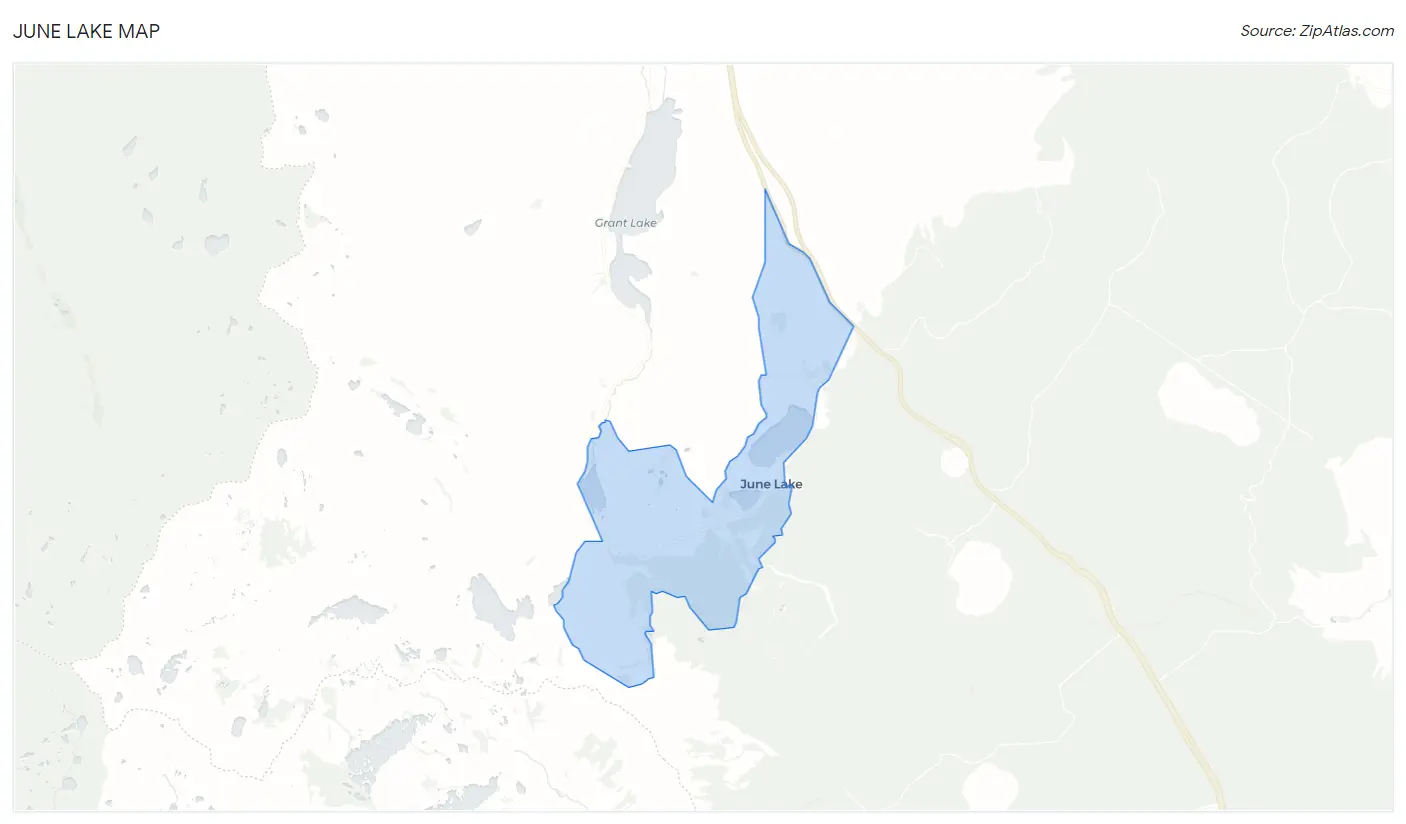
June Lake Map
June Lake Overview
$68,901
PER CAPITA INCOME
$108,977
AVG FAMILY INCOME
$108,239
AVG HOUSEHOLD INCOME
2.4%
WAGE / INCOME GAP [ % ]
97.6¢/ $1
WAGE / INCOME GAP [ $ ]
0.48
INEQUALITY / GINI INDEX
302
TOTAL POPULATION
182
MALE POPULATION
120
FEMALE POPULATION
151.67
MALES / 100 FEMALES
65.93
FEMALES / 100 MALES
64.2
MEDIAN AGE
2.0
AVG FAMILY SIZE
2.1
AVG HOUSEHOLD SIZE
199
LABOR FORCE [ PEOPLE ]
69.8%
PERCENT IN LABOR FORCE
June Lake Zip Codes
June Lake Area Codes
Income in June Lake
Income Overview in June Lake
Per Capita Income in June Lake is $68,901, while median incomes of families and households are $108,977 and $108,239 respectively.
| Characteristic | Number | Measure |
| Per Capita Income | 302 | $68,901 |
| Median Family Income | 128 | $108,977 |
| Mean Family Income | 128 | $150,977 |
| Median Household Income | 141 | $108,239 |
| Mean Household Income | 141 | $143,757 |
| Income Deficit | 128 | $0 |
| Wage / Income Gap (%) | 302 | 2.44% |
| Wage / Income Gap ($) | 302 | 97.56¢ per $1 |
| Gini / Inequality Index | 302 | 0.48 |
Earnings by Sex in June Lake
Average Earnings in June Lake are $38,942, $39,423 for men and $38,462 for women, a difference of 2.4%.

| Sex | Number | Average Earnings |
| Male | 156 (72.2%) | $39,423 |
| Female | 60 (27.8%) | $38,462 |
| Total | 216 (100.0%) | $38,942 |
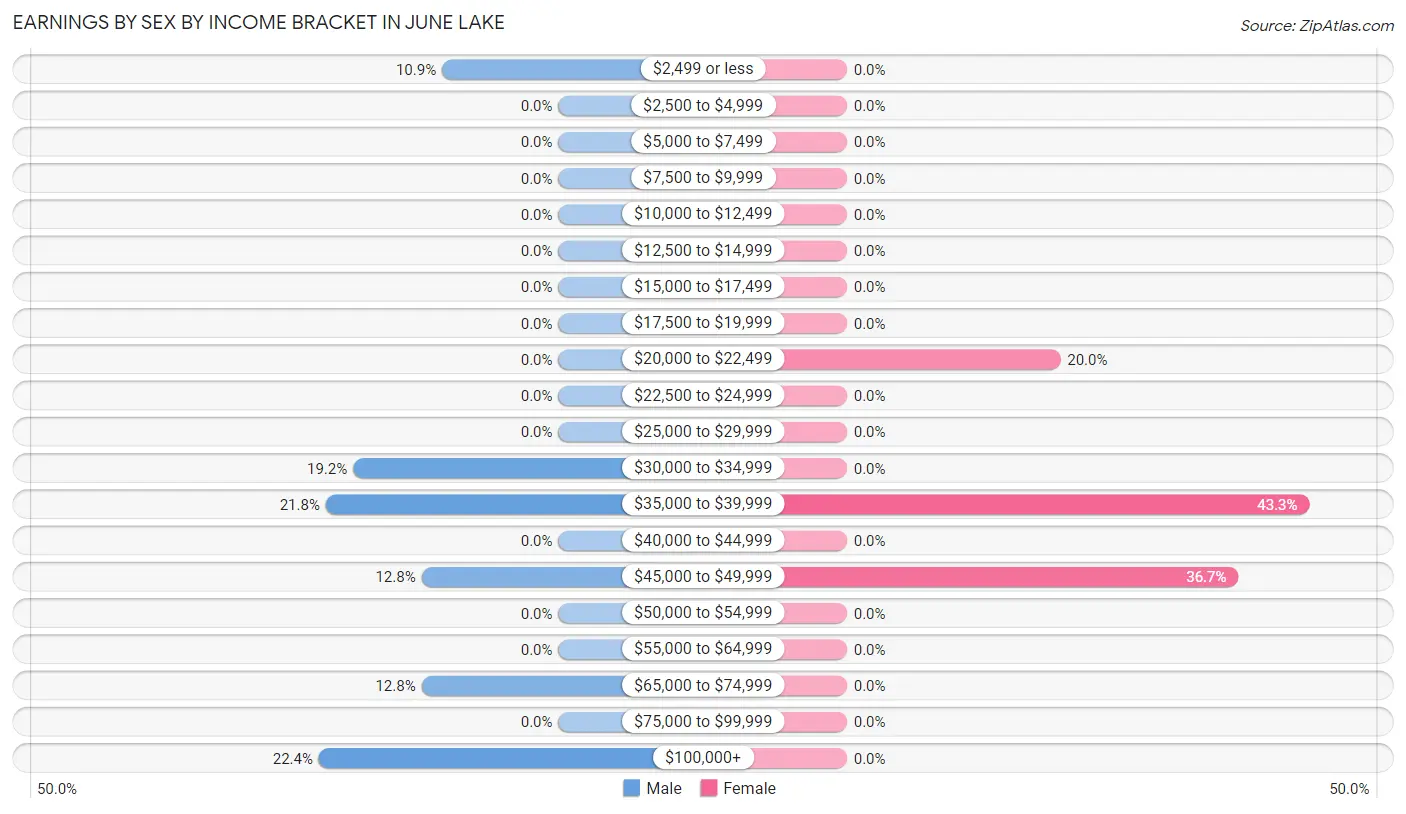
Earnings by Sex by Income Bracket in June Lake
The most common earnings brackets in June Lake are $100,000+ for men (35 | 22.4%) and $35,000 to $39,999 for women (26 | 43.3%).
| Income | Male | Female |
| $2,499 or less | 17 (10.9%) | 0 (0.0%) |
| $2,500 to $4,999 | 0 (0.0%) | 0 (0.0%) |
| $5,000 to $7,499 | 0 (0.0%) | 0 (0.0%) |
| $7,500 to $9,999 | 0 (0.0%) | 0 (0.0%) |
| $10,000 to $12,499 | 0 (0.0%) | 0 (0.0%) |
| $12,500 to $14,999 | 0 (0.0%) | 0 (0.0%) |
| $15,000 to $17,499 | 0 (0.0%) | 0 (0.0%) |
| $17,500 to $19,999 | 0 (0.0%) | 0 (0.0%) |
| $20,000 to $22,499 | 0 (0.0%) | 12 (20.0%) |
| $22,500 to $24,999 | 0 (0.0%) | 0 (0.0%) |
| $25,000 to $29,999 | 0 (0.0%) | 0 (0.0%) |
| $30,000 to $34,999 | 30 (19.2%) | 0 (0.0%) |
| $35,000 to $39,999 | 34 (21.8%) | 26 (43.3%) |
| $40,000 to $44,999 | 0 (0.0%) | 0 (0.0%) |
| $45,000 to $49,999 | 20 (12.8%) | 22 (36.7%) |
| $50,000 to $54,999 | 0 (0.0%) | 0 (0.0%) |
| $55,000 to $64,999 | 0 (0.0%) | 0 (0.0%) |
| $65,000 to $74,999 | 20 (12.8%) | 0 (0.0%) |
| $75,000 to $99,999 | 0 (0.0%) | 0 (0.0%) |
| $100,000+ | 35 (22.4%) | 0 (0.0%) |
| Total | 156 (100.0%) | 60 (100.0%) |
Earnings by Sex by Educational Attainment in June Lake
| Educational Attainment | Male Income | Female Income |
| Less than High School | - | - |
| High School Diploma | - | - |
| College or Associate's Degree | - | - |
| Bachelor's Degree | - | - |
| Graduate Degree | - | - |
| Total | $39,423 | $38,462 |
Family Income in June Lake
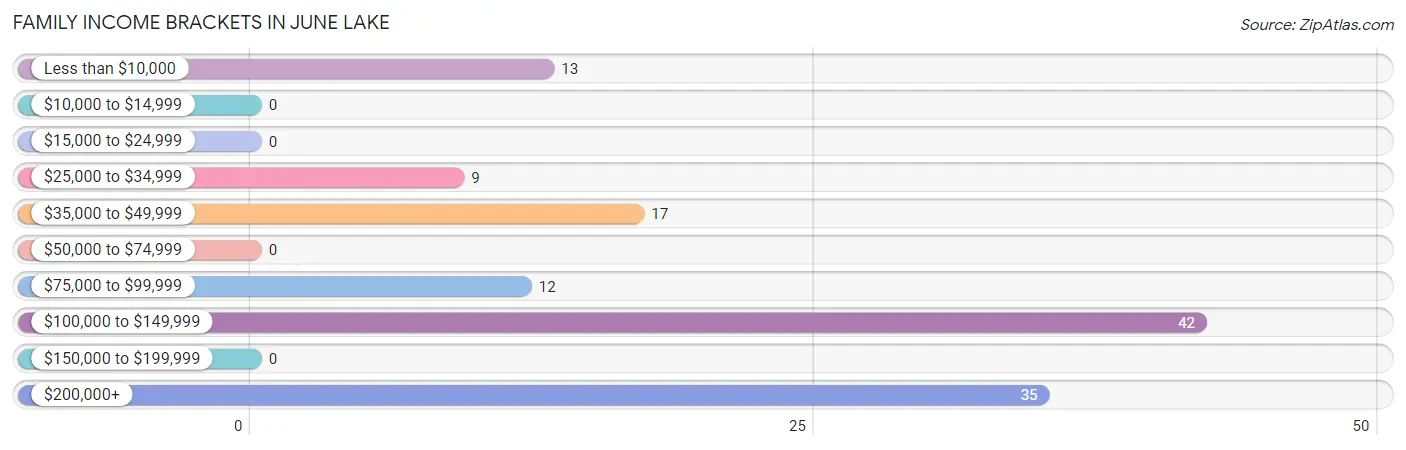
Family Income Brackets in June Lake
According to the June Lake family income data, there are 42 families falling into the $100,000 to $149,999 income range, which is the most common income bracket and makes up 32.8% of all families.
| Income Bracket | # Families | % Families |
| Less than $10,000 | 13 | 10.2% |
| $10,000 to $14,999 | 0 | 0.0% |
| $15,000 to $24,999 | 0 | 0.0% |
| $25,000 to $34,999 | 9 | 7.0% |
| $35,000 to $49,999 | 17 | 13.3% |
| $50,000 to $74,999 | 0 | 0.0% |
| $75,000 to $99,999 | 12 | 9.4% |
| $100,000 to $149,999 | 42 | 32.8% |
| $150,000 to $199,999 | 0 | 0.0% |
| $200,000+ | 35 | 27.3% |
Family Income by Famaliy Size in June Lake
2-person families (128 | 100.0%) account for the highest median family income in June Lake with $108,977 per family, while 2-person families (128 | 100.0%) have the highest median income of $54,488 per family member.
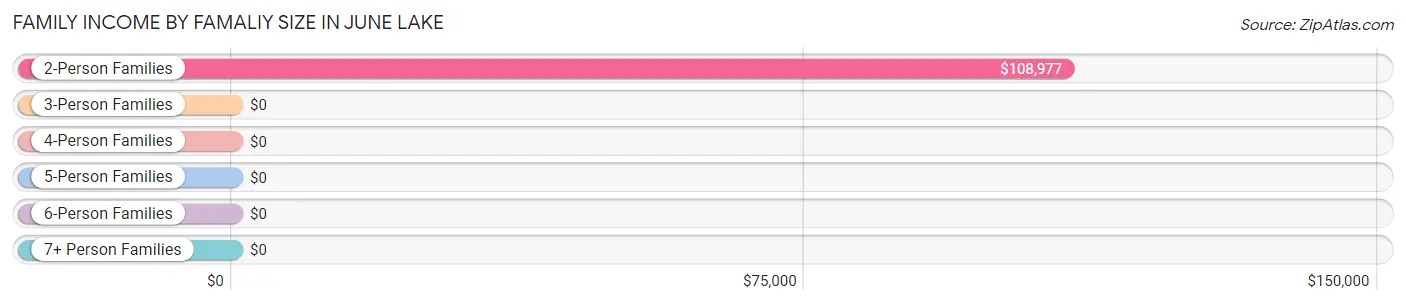
| Income Bracket | # Families | Median Income |
| 2-Person Families | 128 (100.0%) | $108,977 |
| 3-Person Families | 0 (0.0%) | $0 |
| 4-Person Families | 0 (0.0%) | $0 |
| 5-Person Families | 0 (0.0%) | $0 |
| 6-Person Families | 0 (0.0%) | $0 |
| 7+ Person Families | 0 (0.0%) | $0 |
| Total | 128 (100.0%) | $108,977 |
Family Income by Number of Earners in June Lake
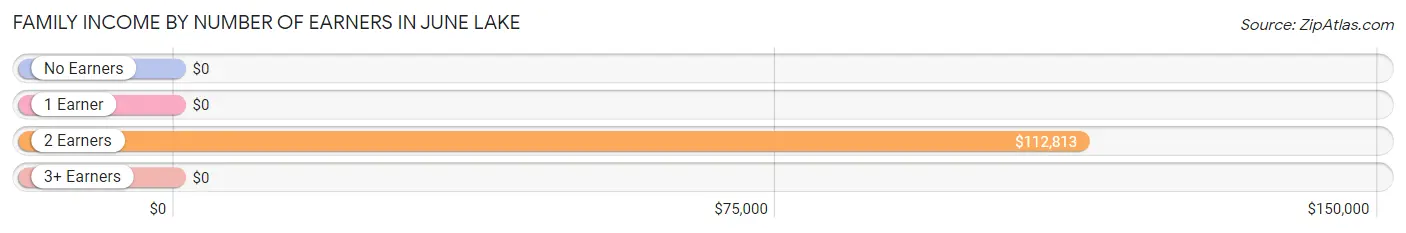
| Number of Earners | # Families | Median Income |
| No Earners | 22 (17.2%) | $0 |
| 1 Earner | 33 (25.8%) | $0 |
| 2 Earners | 73 (57.0%) | $112,813 |
| 3+ Earners | 0 (0.0%) | $0 |
| Total | 128 (100.0%) | $108,977 |
Household Income in June Lake
Household Income Brackets in June Lake
With 42 households falling in the category, the $100,000 to $149,999 income range is the most frequent in June Lake, accounting for 29.8% of all households.
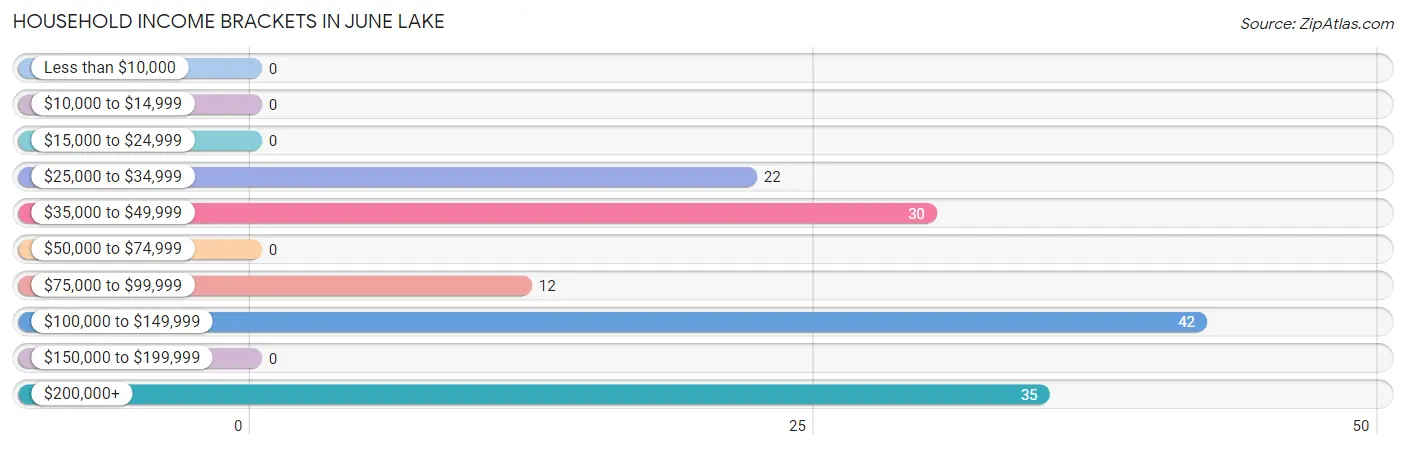
| Income Bracket | # Households | % Households |
| Less than $10,000 | 0 | 0.0% |
| $10,000 to $14,999 | 0 | 0.0% |
| $15,000 to $24,999 | 0 | 0.0% |
| $25,000 to $34,999 | 22 | 15.6% |
| $35,000 to $49,999 | 30 | 21.3% |
| $50,000 to $74,999 | 0 | 0.0% |
| $75,000 to $99,999 | 12 | 8.5% |
| $100,000 to $149,999 | 42 | 29.8% |
| $150,000 to $199,999 | 0 | 0.0% |
| $200,000+ | 35 | 24.8% |
Household Income by Householder Age in June Lake
The median household income in June Lake is $108,239, with the highest median household income of $205,469 found in the 65+ years age bracket for the primary householder. A total of 64 households (45.4%) fall into this category.
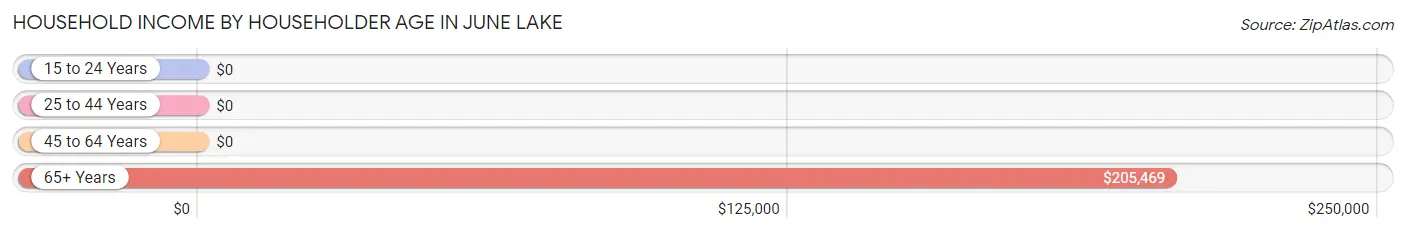
| Income Bracket | # Households | Median Income |
| 15 to 24 Years | 0 (0.0%) | $0 |
| 25 to 44 Years | 13 (9.2%) | $0 |
| 45 to 64 Years | 64 (45.4%) | $0 |
| 65+ Years | 64 (45.4%) | $205,469 |
| Total | 141 (100.0%) | $108,239 |
Poverty in June Lake
Income Below Poverty by Sex and Age in June Lake
With 9.3% poverty level for males and 10.8% for females among the residents of June Lake, under 5 year old males and 25 to 34 year old females are the most vulnerable to poverty, with 17 males (100.0%) and 13 females (100.0%) in their respective age groups living below the poverty level.
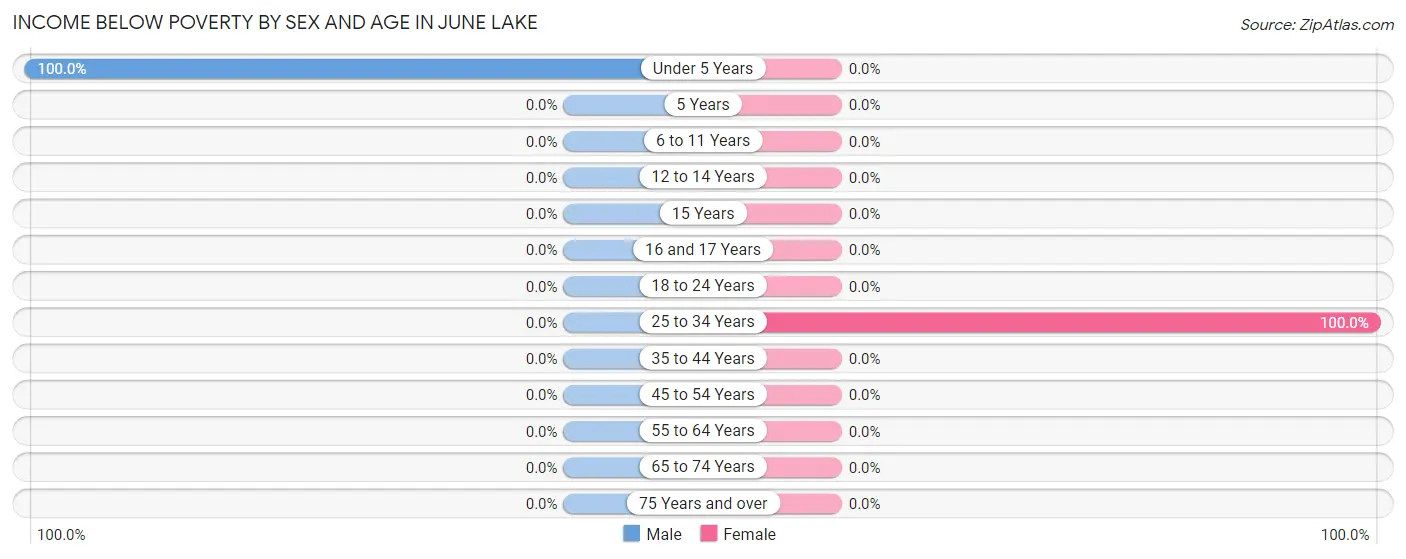
| Age Bracket | Male | Female |
| Under 5 Years | 17 (100.0%) | 0 (0.0%) |
| 5 Years | 0 (0.0%) | 0 (0.0%) |
| 6 to 11 Years | 0 (0.0%) | 0 (0.0%) |
| 12 to 14 Years | 0 (0.0%) | 0 (0.0%) |
| 15 Years | 0 (0.0%) | 0 (0.0%) |
| 16 and 17 Years | 0 (0.0%) | 0 (0.0%) |
| 18 to 24 Years | 0 (0.0%) | 0 (0.0%) |
| 25 to 34 Years | 0 (0.0%) | 13 (100.0%) |
| 35 to 44 Years | 0 (0.0%) | 0 (0.0%) |
| 45 to 54 Years | 0 (0.0%) | 0 (0.0%) |
| 55 to 64 Years | 0 (0.0%) | 0 (0.0%) |
| 65 to 74 Years | 0 (0.0%) | 0 (0.0%) |
| 75 Years and over | 0 (0.0%) | 0 (0.0%) |
| Total | 17 (9.3%) | 13 (10.8%) |
Income Above Poverty by Sex and Age in June Lake
According to the poverty statistics in June Lake, males aged 25 to 34 years and females aged 55 to 64 years are the age groups that are most secure financially, with 100.0% of males and 100.0% of females in these age groups living above the poverty line.
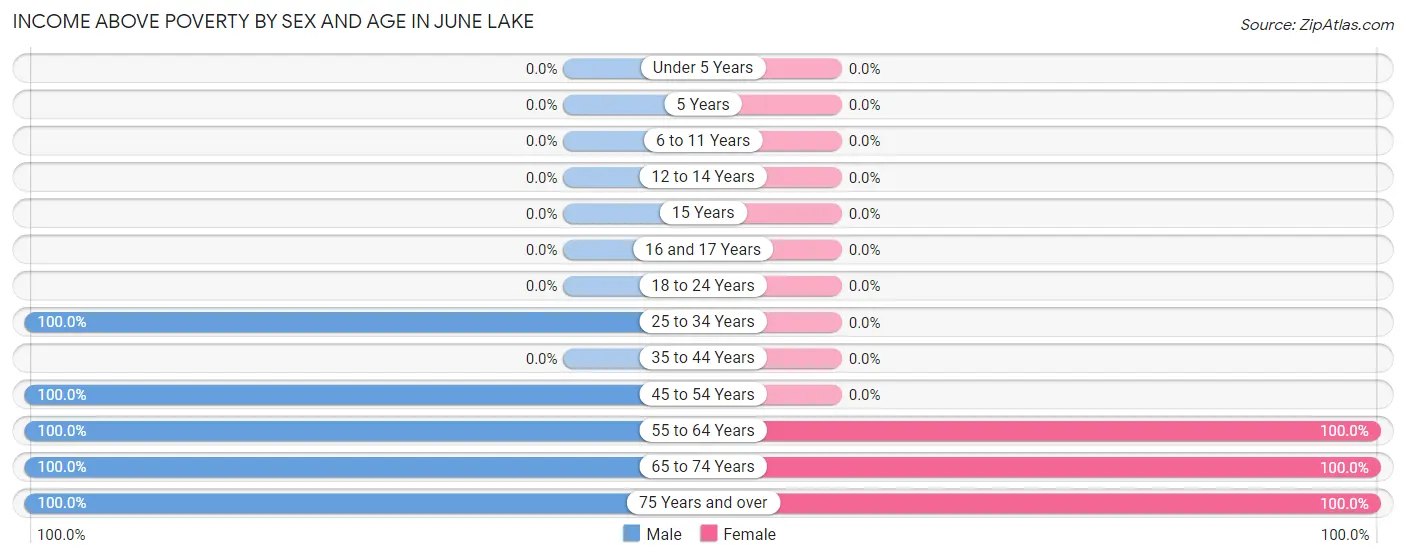
| Age Bracket | Male | Female |
| Under 5 Years | 0 (0.0%) | 0 (0.0%) |
| 5 Years | 0 (0.0%) | 0 (0.0%) |
| 6 to 11 Years | 0 (0.0%) | 0 (0.0%) |
| 12 to 14 Years | 0 (0.0%) | 0 (0.0%) |
| 15 Years | 0 (0.0%) | 0 (0.0%) |
| 16 and 17 Years | 0 (0.0%) | 0 (0.0%) |
| 18 to 24 Years | 0 (0.0%) | 0 (0.0%) |
| 25 to 34 Years | 30 (100.0%) | 0 (0.0%) |
| 35 to 44 Years | 0 (0.0%) | 0 (0.0%) |
| 45 to 54 Years | 13 (100.0%) | 0 (0.0%) |
| 55 to 64 Years | 17 (100.0%) | 74 (100.0%) |
| 65 to 74 Years | 96 (100.0%) | 13 (100.0%) |
| 75 Years and over | 9 (100.0%) | 20 (100.0%) |
| Total | 165 (90.7%) | 107 (89.2%) |
Income Below Poverty Among Married-Couple Families in June Lake
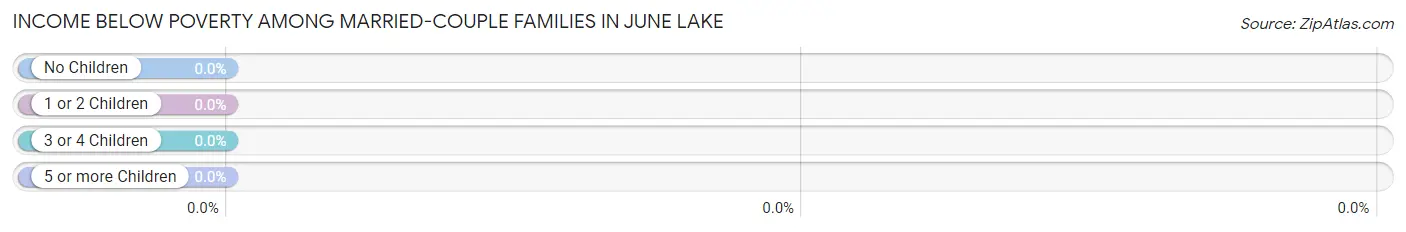
| Children | Above Poverty | Below Poverty |
| No Children | 115 (100.0%) | 0 (0.0%) |
| 1 or 2 Children | 0 (0.0%) | 0 (0.0%) |
| 3 or 4 Children | 0 (0.0%) | 0 (0.0%) |
| 5 or more Children | 0 (0.0%) | 0 (0.0%) |
| Total | 115 (100.0%) | 0 (0.0%) |
Income Below Poverty Among Single-Parent Households in June Lake
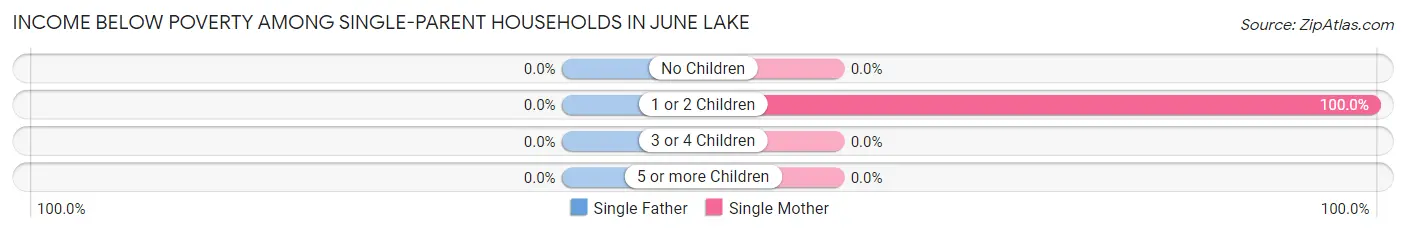
| Children | Single Father | Single Mother |
| No Children | 0 (0.0%) | 0 (0.0%) |
| 1 or 2 Children | 0 (0.0%) | 13 (100.0%) |
| 3 or 4 Children | 0 (0.0%) | 0 (0.0%) |
| 5 or more Children | 0 (0.0%) | 0 (0.0%) |
| Total | 0 (0.0%) | 13 (100.0%) |
Income Below Poverty Among Married-Couple vs Single-Parent Households in June Lake
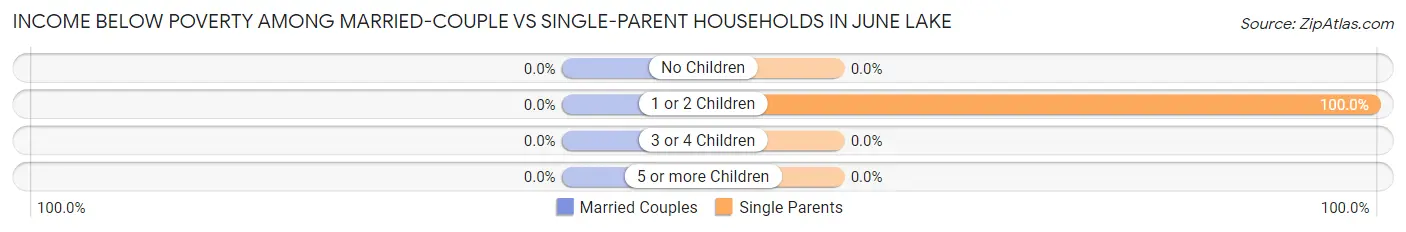
| Children | Married-Couple Families | Single-Parent Households |
| No Children | 0 (0.0%) | 0 (0.0%) |
| 1 or 2 Children | 0 (0.0%) | 13 (100.0%) |
| 3 or 4 Children | 0 (0.0%) | 0 (0.0%) |
| 5 or more Children | 0 (0.0%) | 0 (0.0%) |
| Total | 0 (0.0%) | 13 (100.0%) |
Race in June Lake
The most populous races in June Lake are White / Caucasian (280 | 92.7%), and Asian (22 | 7.3%).
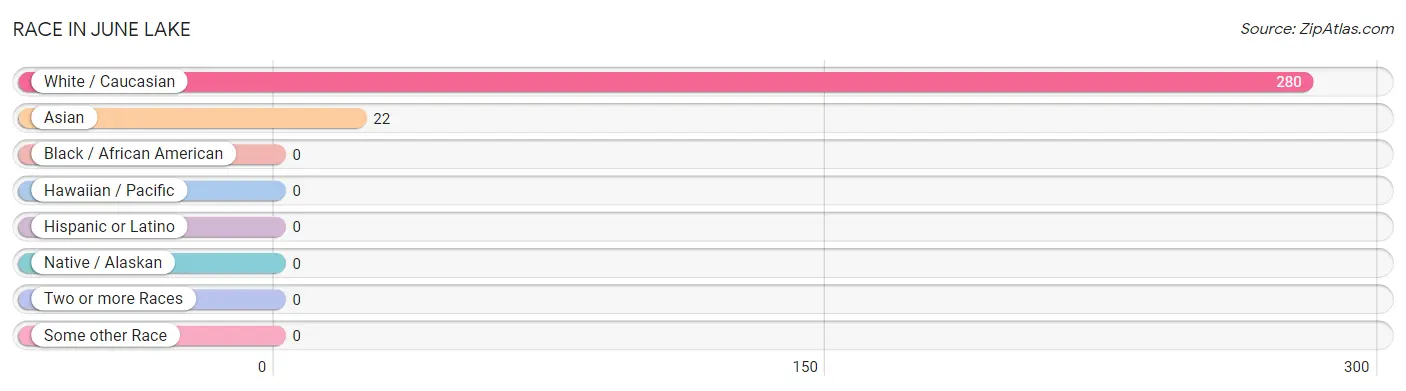
| Race | # Population | % Population |
| Asian | 22 | 7.3% |
| Black / African American | 0 | 0.0% |
| Hawaiian / Pacific | 0 | 0.0% |
| Hispanic or Latino | 0 | 0.0% |
| Native / Alaskan | 0 | 0.0% |
| White / Caucasian | 280 | 92.7% |
| Two or more Races | 0 | 0.0% |
| Some other Race | 0 | 0.0% |
| Total | 302 | 100.0% |
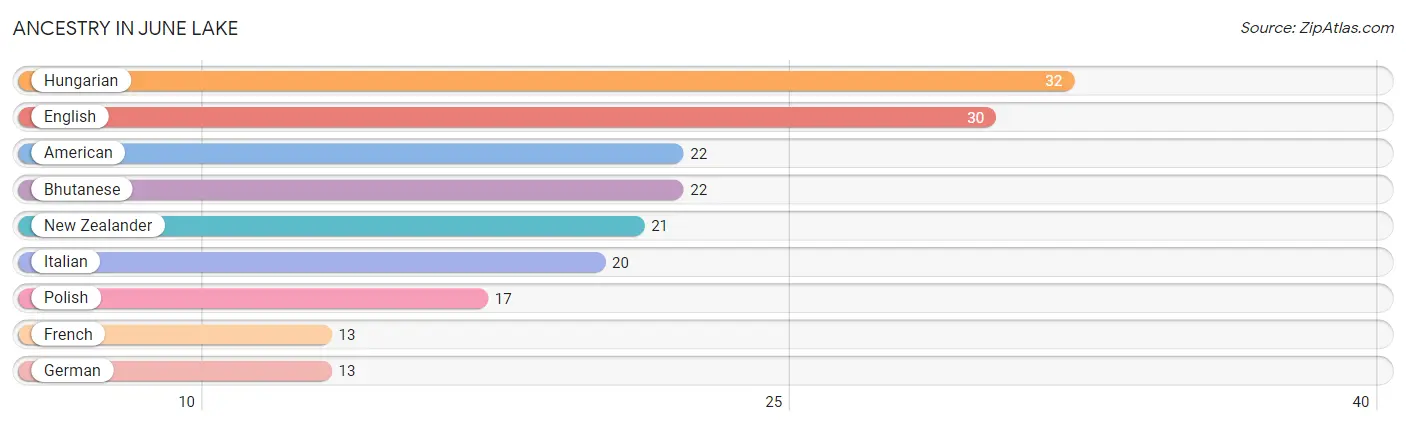
Ancestry in June Lake
The most populous ancestries reported in June Lake are Hungarian (32 | 10.6%), English (30 | 9.9%), American (22 | 7.3%), Bhutanese (22 | 7.3%), and New Zealander (21 | 7.0%), together accounting for 42.0% of all June Lake residents.
| Ancestry | # Population | % Population |
| American | 22 | 7.3% |
| Bhutanese | 22 | 7.3% |
| English | 30 | 9.9% |
| French | 13 | 4.3% |
| German | 13 | 4.3% |
| Hungarian | 32 | 10.6% |
| Italian | 20 | 6.6% |
| New Zealander | 21 | 7.0% |
| Polish | 17 | 5.6% | View All 9 Rows |
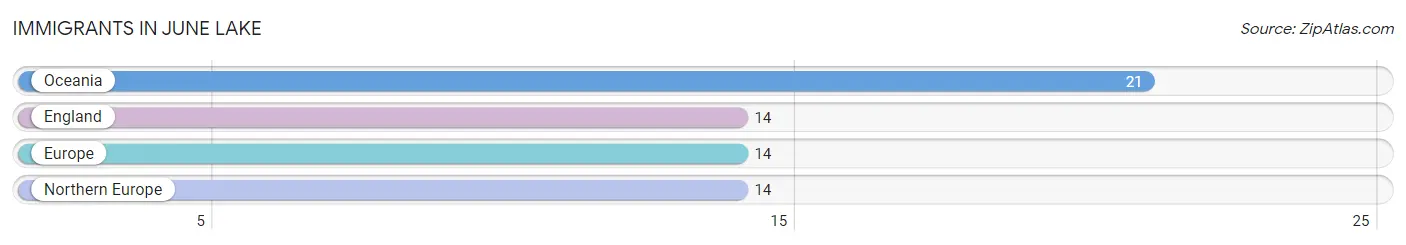
Immigrants in June Lake
The most numerous immigrant groups reported in June Lake came from Oceania (21 | 7.0%), England (14 | 4.6%), Europe (14 | 4.6%), and Northern Europe (14 | 4.6%), together accounting for 20.9% of all June Lake residents.
| Immigration Origin | # Population | % Population |
| England | 14 | 4.6% |
| Europe | 14 | 4.6% |
| Northern Europe | 14 | 4.6% |
| Oceania | 21 | 7.0% | View All 4 Rows |
Sex and Age in June Lake
Sex and Age in June Lake
The most populous age groups in June Lake are 65 to 69 Years (80 | 44.0%) for men and 60 to 64 Years (48 | 40.0%) for women.
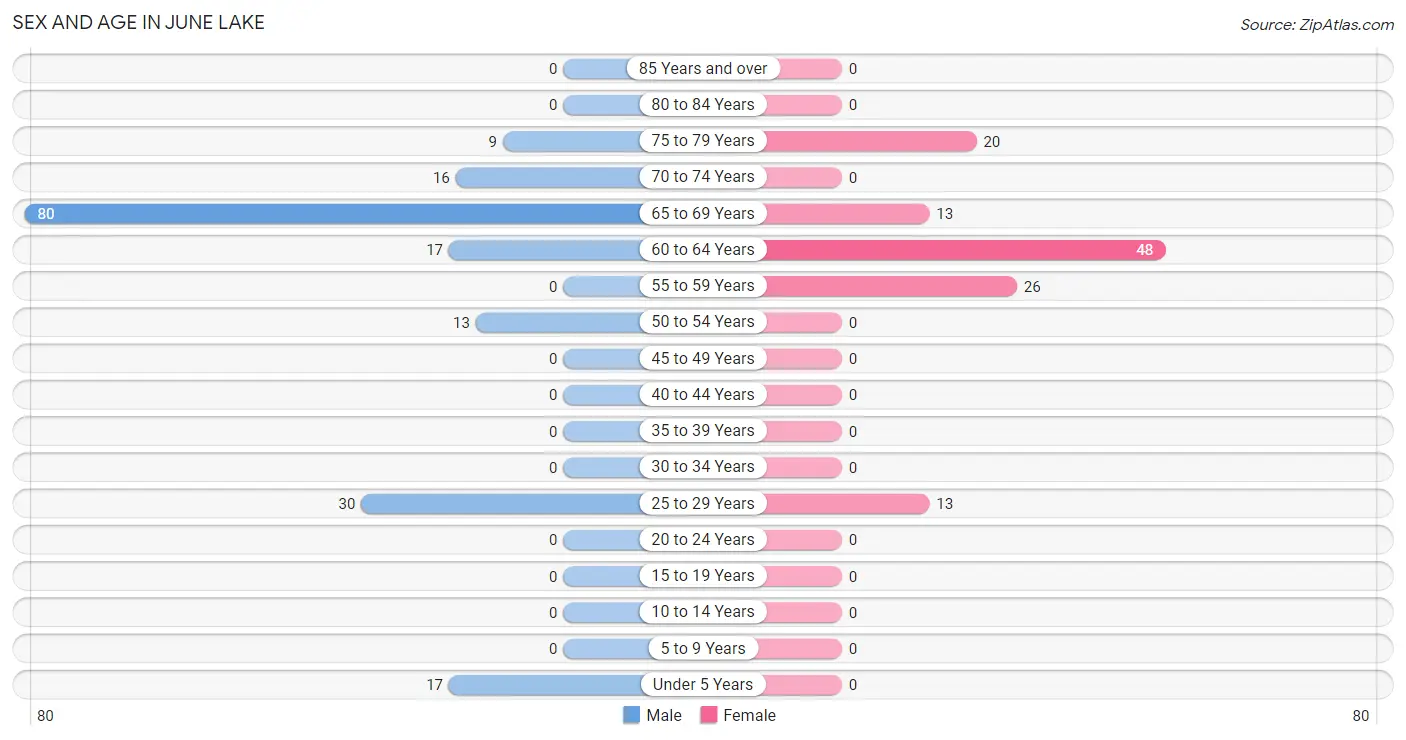
| Age Bracket | Male | Female |
| Under 5 Years | 17 (9.3%) | 0 (0.0%) |
| 5 to 9 Years | 0 (0.0%) | 0 (0.0%) |
| 10 to 14 Years | 0 (0.0%) | 0 (0.0%) |
| 15 to 19 Years | 0 (0.0%) | 0 (0.0%) |
| 20 to 24 Years | 0 (0.0%) | 0 (0.0%) |
| 25 to 29 Years | 30 (16.5%) | 13 (10.8%) |
| 30 to 34 Years | 0 (0.0%) | 0 (0.0%) |
| 35 to 39 Years | 0 (0.0%) | 0 (0.0%) |
| 40 to 44 Years | 0 (0.0%) | 0 (0.0%) |
| 45 to 49 Years | 0 (0.0%) | 0 (0.0%) |
| 50 to 54 Years | 13 (7.1%) | 0 (0.0%) |
| 55 to 59 Years | 0 (0.0%) | 26 (21.7%) |
| 60 to 64 Years | 17 (9.3%) | 48 (40.0%) |
| 65 to 69 Years | 80 (44.0%) | 13 (10.8%) |
| 70 to 74 Years | 16 (8.8%) | 0 (0.0%) |
| 75 to 79 Years | 9 (5.0%) | 20 (16.7%) |
| 80 to 84 Years | 0 (0.0%) | 0 (0.0%) |
| 85 Years and over | 0 (0.0%) | 0 (0.0%) |
| Total | 182 (100.0%) | 120 (100.0%) |
Families and Households in June Lake
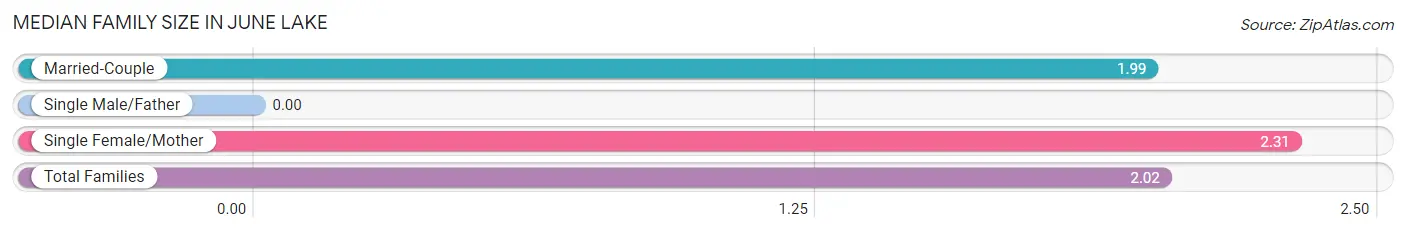
Median Family Size in June Lake
| Family Type | # Families | Family Size |
| Married-Couple | 115 (89.8%) | 1.99 |
| Single Male/Father | 0 (0.0%) | - |
| Single Female/Mother | 13 (10.2%) | 2.31 |
| Total Families | 128 (100.0%) | 2.02 |
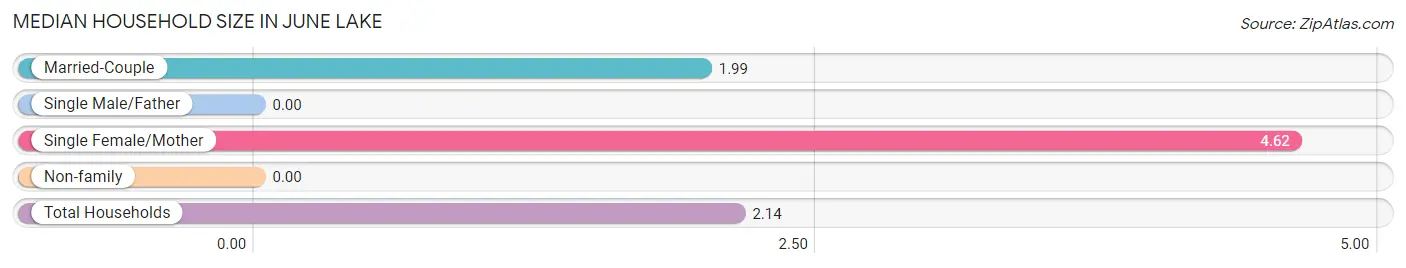
Median Household Size in June Lake
| Household Type | # Households | Household Size |
| Married-Couple | 115 (81.6%) | 1.99 |
| Single Male/Father | 0 (0.0%) | - |
| Single Female/Mother | 13 (9.2%) | 4.62 |
| Non-family | 13 (9.2%) | - |
| Total Households | 141 (100.0%) | 2.14 |
Household Size by Marriage Status in June Lake
Out of a total of 141 households in June Lake, 128 (90.8%) are family households, while 13 (9.2%) are nonfamily households. The most numerous type of family households are 2-person households, comprising 115, and the most common type of nonfamily households are 1-person households, comprising 13.
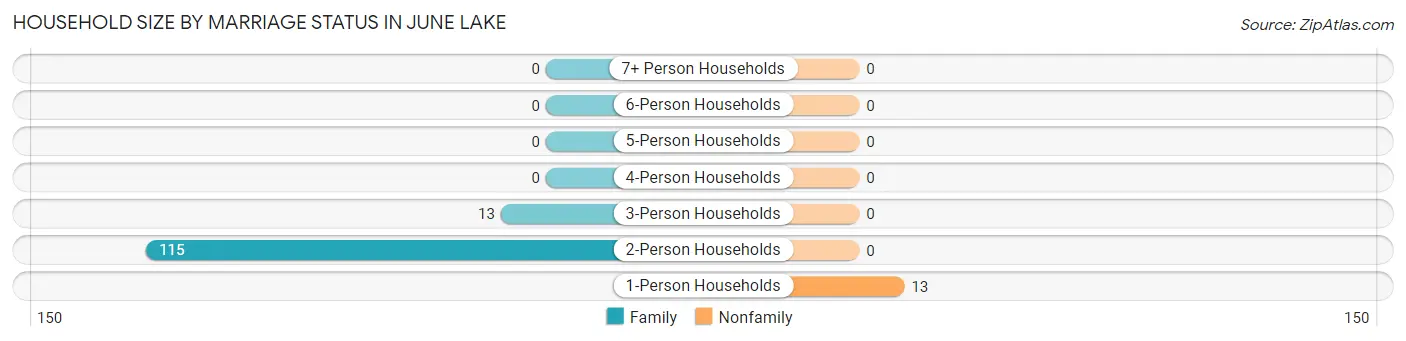
| Household Size | Family Households | Nonfamily Households |
| 1-Person Households | - | 13 (9.2%) |
| 2-Person Households | 115 (81.6%) | 0 (0.0%) |
| 3-Person Households | 13 (9.2%) | 0 (0.0%) |
| 4-Person Households | 0 (0.0%) | 0 (0.0%) |
| 5-Person Households | 0 (0.0%) | 0 (0.0%) |
| 6-Person Households | 0 (0.0%) | 0 (0.0%) |
| 7+ Person Households | 0 (0.0%) | 0 (0.0%) |
| Total | 128 (90.8%) | 13 (9.2%) |
Female Fertility in June Lake
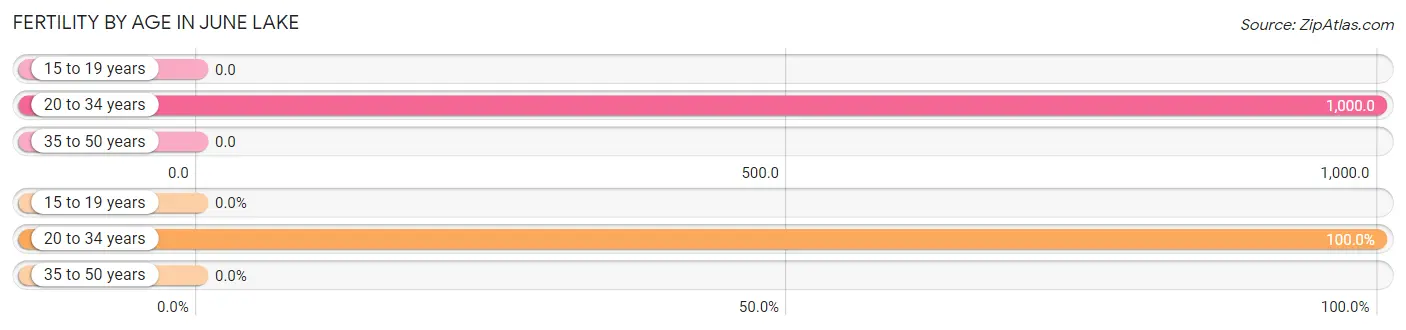
Fertility by Age in June Lake
Average fertility rate in June Lake is 1,000.0 births per 1,000 women. Women in the age bracket of 20 to 34 years have the highest fertility rate with 1,000.0 births per 1,000 women. Women in the age bracket of 20 to 34 years acount for 100.0% of all women with births.
| Age Bracket | Women with Births | Births / 1,000 Women |
| 15 to 19 years | 0 (0.0%) | 0.0 |
| 20 to 34 years | 13 (100.0%) | 1,000.0 |
| 35 to 50 years | 0 (0.0%) | 0.0 |
| Total | 13 (100.0%) | 1,000.0 |
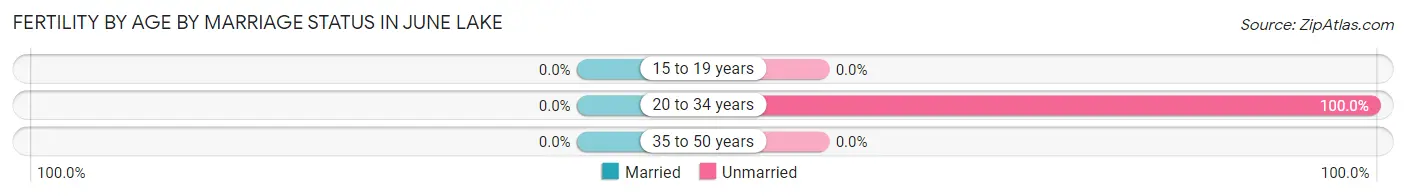
Fertility by Age by Marriage Status in June Lake
| Age Bracket | Married | Unmarried |
| 15 to 19 years | 0 (0.0%) | 0 (0.0%) |
| 20 to 34 years | 0 (0.0%) | 13 (100.0%) |
| 35 to 50 years | 0 (0.0%) | 0 (0.0%) |
| Total | 0 (0.0%) | 13 (100.0%) |
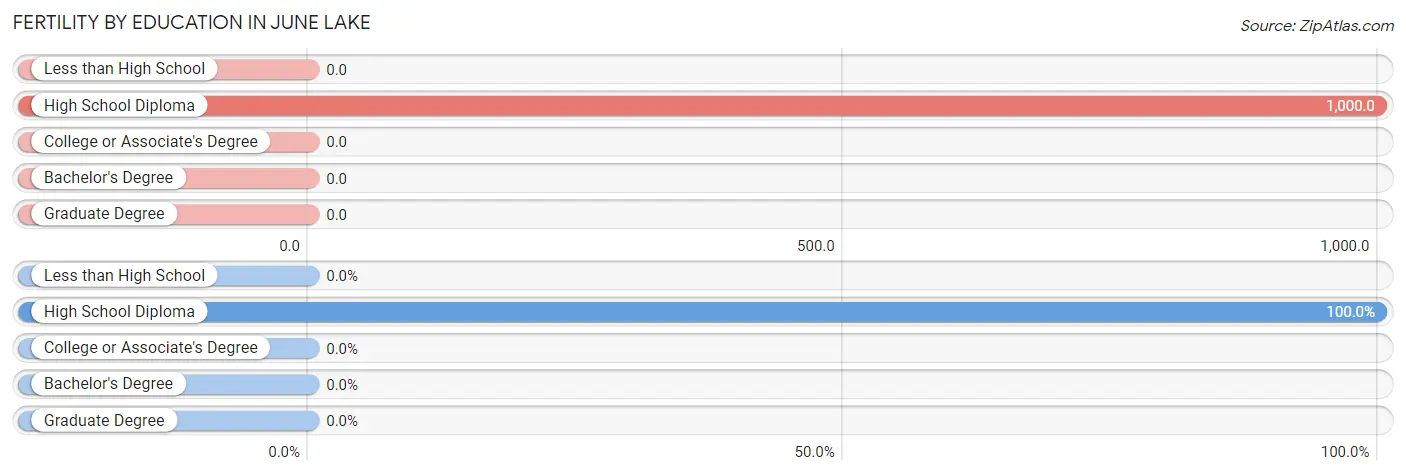
Fertility by Education in June Lake
| Educational Attainment | Women with Births | Births / 1,000 Women |
| Less than High School | 0 (0.0%) | 0.0 |
| High School Diploma | 13 (100.0%) | 1,000.0 |
| College or Associate's Degree | 0 (0.0%) | 0.0 |
| Bachelor's Degree | 0 (0.0%) | 0.0 |
| Graduate Degree | 0 (0.0%) | 0.0 |
| Total | 13 (100.0%) | 1,000.0 |
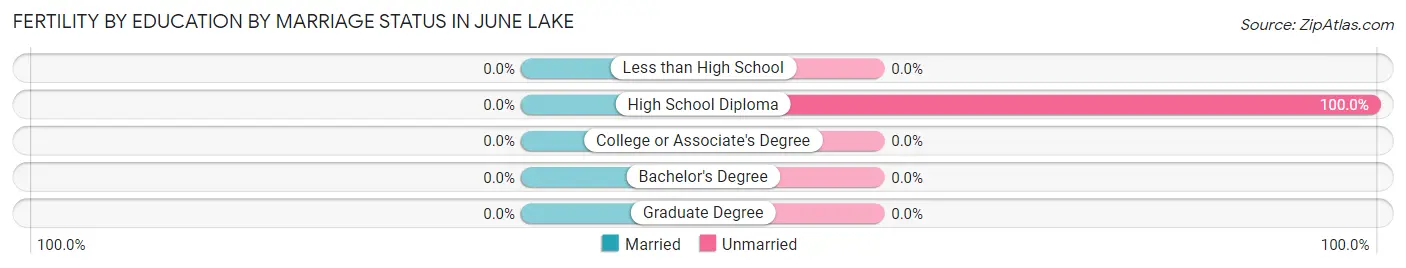
Fertility by Education by Marriage Status in June Lake
| Educational Attainment | Married | Unmarried |
| Less than High School | 0 (0.0%) | 0 (0.0%) |
| High School Diploma | 0 (0.0%) | 13 (100.0%) |
| College or Associate's Degree | 0 (0.0%) | 0 (0.0%) |
| Bachelor's Degree | 0 (0.0%) | 0 (0.0%) |
| Graduate Degree | 0 (0.0%) | 0 (0.0%) |
| Total | 0 (0.0%) | 13 (100.0%) |
Employment Characteristics in June Lake
Employment by Class of Employer in June Lake
Among the 199 employed individuals in June Lake, private company employees (95 | 47.7%), self-employed (incorporated) (91 | 45.7%), and self-employed (not incorporated) (13 | 6.5%) make up the most common classes of employment.
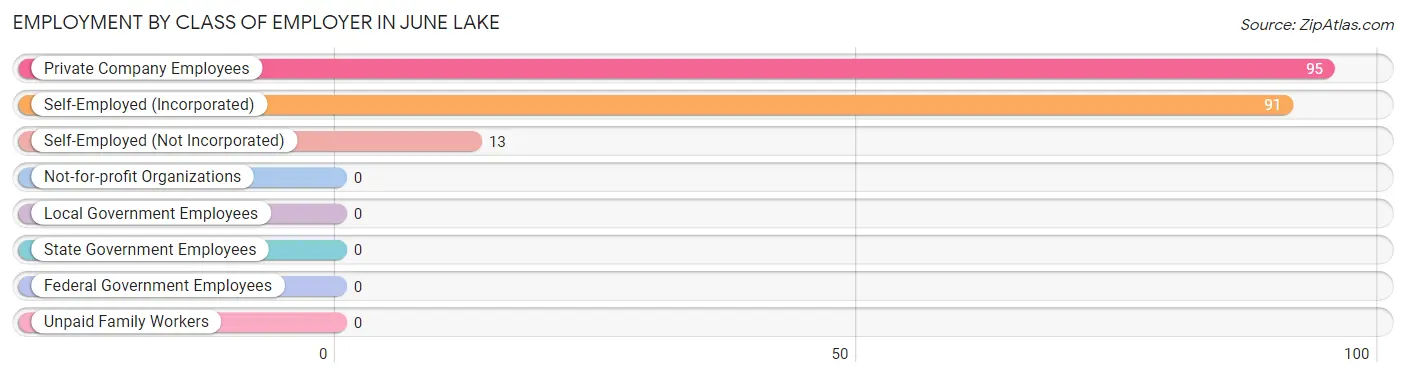
| Employer Class | # Employees | % Employees |
| Private Company Employees | 95 | 47.7% |
| Self-Employed (Incorporated) | 91 | 45.7% |
| Self-Employed (Not Incorporated) | 13 | 6.5% |
| Not-for-profit Organizations | 0 | 0.0% |
| Local Government Employees | 0 | 0.0% |
| State Government Employees | 0 | 0.0% |
| Federal Government Employees | 0 | 0.0% |
| Unpaid Family Workers | 0 | 0.0% |
| Total | 199 | 100.0% |
Employment Status by Age in June Lake
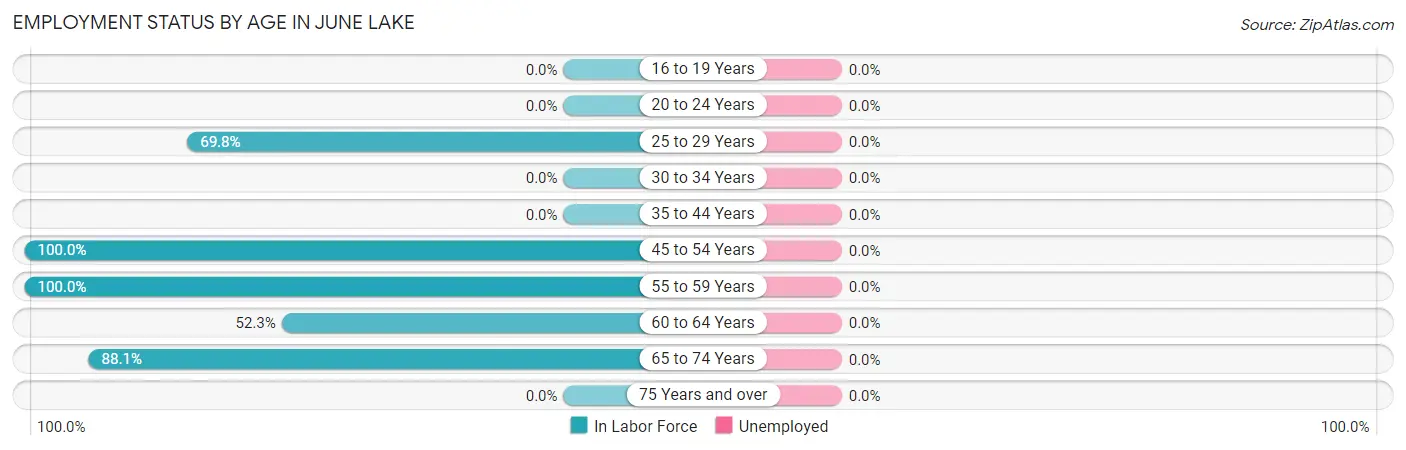
| Age Bracket | In Labor Force | Unemployed |
| 16 to 19 Years | 0 (0.0%) | 0 (0.0%) |
| 20 to 24 Years | 0 (0.0%) | 0 (0.0%) |
| 25 to 29 Years | 30 (69.8%) | 0 (0.0%) |
| 30 to 34 Years | 0 (0.0%) | 0 (0.0%) |
| 35 to 44 Years | 0 (0.0%) | 0 (0.0%) |
| 45 to 54 Years | 13 (100.0%) | 0 (0.0%) |
| 55 to 59 Years | 26 (100.0%) | 0 (0.0%) |
| 60 to 64 Years | 34 (52.3%) | 0 (0.0%) |
| 65 to 74 Years | 96 (88.1%) | 0 (0.0%) |
| 75 Years and over | 0 (0.0%) | 0 (0.0%) |
| Total | 199 (69.8%) | 0 (0.0%) |
Employment Status by Educational Attainment in June Lake
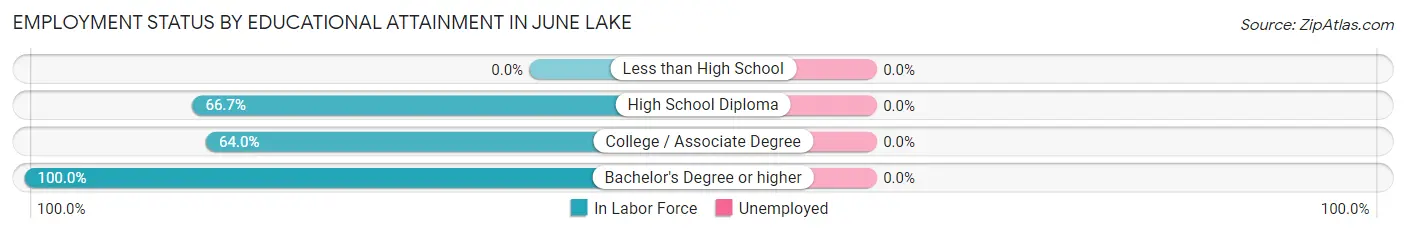
| Educational Attainment | In Labor Force | Unemployed |
| Less than High School | 0 (0.0%) | 0 (0.0%) |
| High School Diploma | 26 (66.7%) | 0 (0.0%) |
| College / Associate Degree | 55 (64.0%) | 0 (0.0%) |
| Bachelor's Degree or higher | 22 (100.0%) | 0 (0.0%) |
| Total | 103 (70.1%) | 0 (0.0%) |
Employment Occupations by Sex in June Lake
Management, Business, Science and Arts Occupations
The most common Management, Business, Science and Arts occupations in June Lake are Management (82 | 41.2%), Computers, Engineering & Science (16 | 8.0%), and Architecture & Engineering (16 | 8.0%).
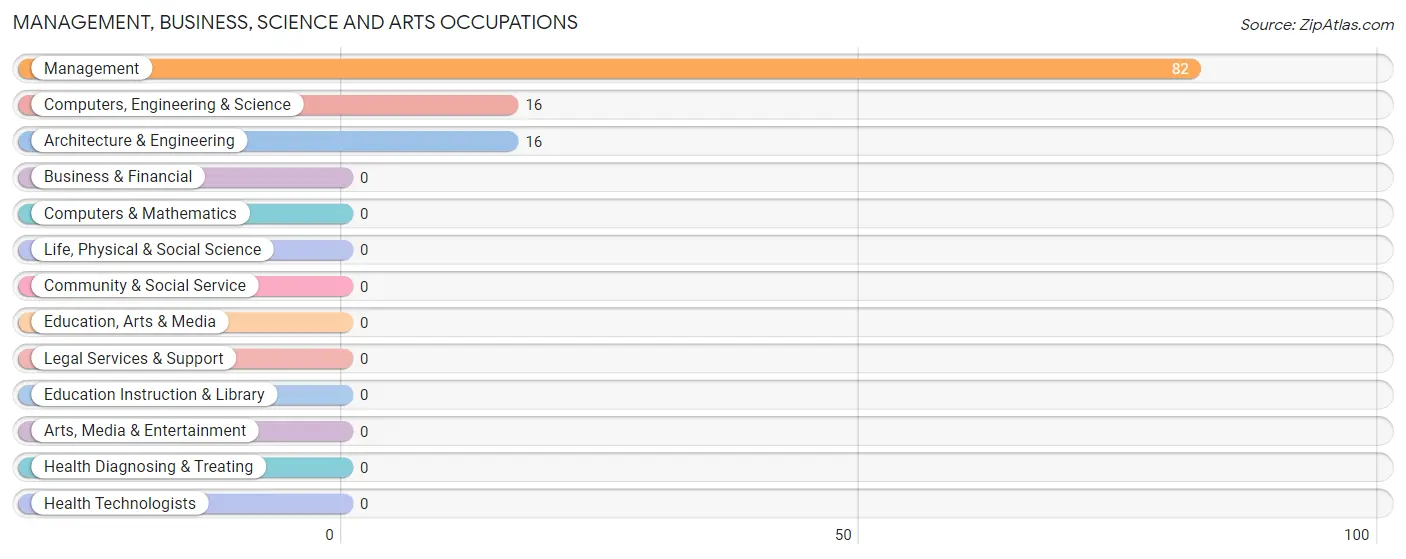
Management, Business, Science and Arts Occupations by Sex
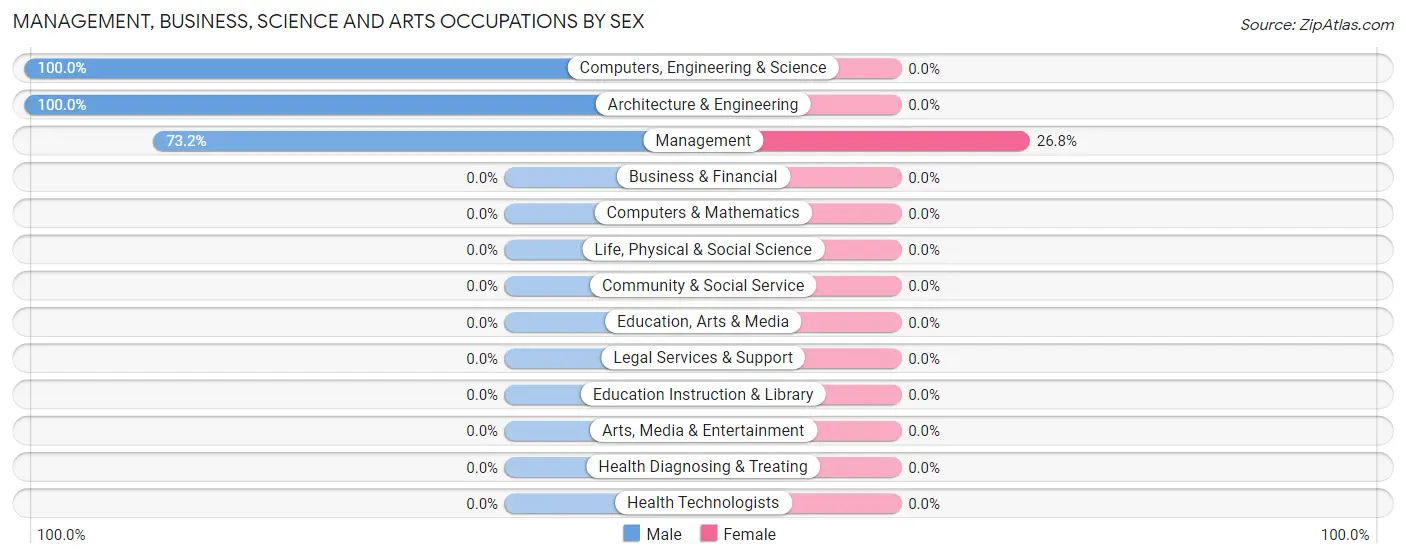
| Occupation | Male | Female |
| Management | 60 (73.2%) | 22 (26.8%) |
| Business & Financial | 0 (0.0%) | 0 (0.0%) |
| Computers, Engineering & Science | 16 (100.0%) | 0 (0.0%) |
| Computers & Mathematics | 0 (0.0%) | 0 (0.0%) |
| Architecture & Engineering | 16 (100.0%) | 0 (0.0%) |
| Life, Physical & Social Science | 0 (0.0%) | 0 (0.0%) |
| Community & Social Service | 0 (0.0%) | 0 (0.0%) |
| Education, Arts & Media | 0 (0.0%) | 0 (0.0%) |
| Legal Services & Support | 0 (0.0%) | 0 (0.0%) |
| Education Instruction & Library | 0 (0.0%) | 0 (0.0%) |
| Arts, Media & Entertainment | 0 (0.0%) | 0 (0.0%) |
| Health Diagnosing & Treating | 0 (0.0%) | 0 (0.0%) |
| Health Technologists | 0 (0.0%) | 0 (0.0%) |
| Total (Category) | 76 (77.5%) | 22 (22.5%) |
| Total (Overall) | 139 (69.9%) | 60 (30.1%) |
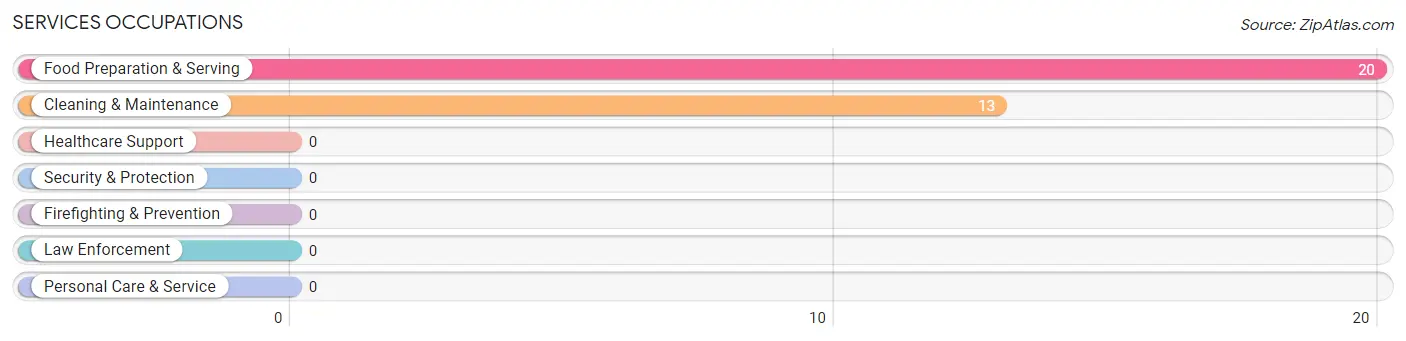
Services Occupations
The most common Services occupations in June Lake are Food Preparation & Serving (20 | 10.1%), and Cleaning & Maintenance (13 | 6.5%).
Services Occupations by Sex
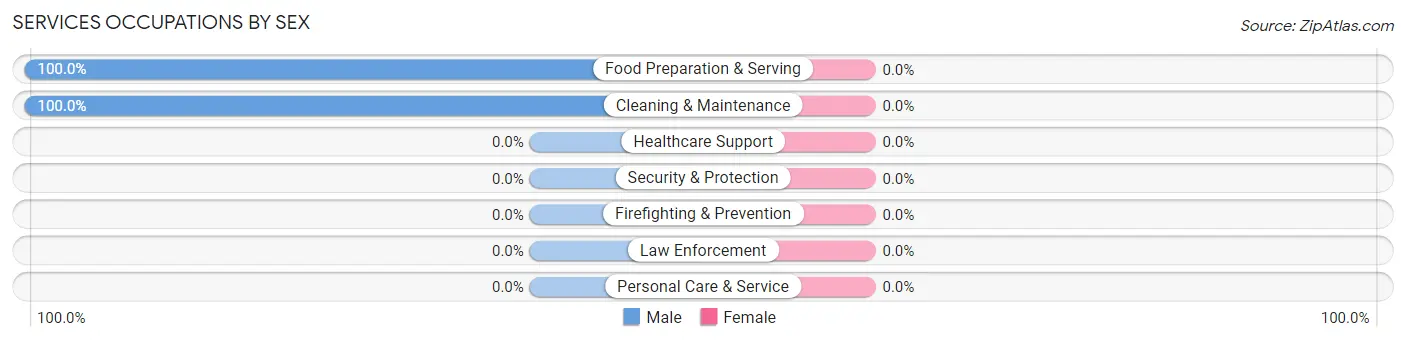
| Occupation | Male | Female |
| Healthcare Support | 0 (0.0%) | 0 (0.0%) |
| Security & Protection | 0 (0.0%) | 0 (0.0%) |
| Firefighting & Prevention | 0 (0.0%) | 0 (0.0%) |
| Law Enforcement | 0 (0.0%) | 0 (0.0%) |
| Food Preparation & Serving | 20 (100.0%) | 0 (0.0%) |
| Cleaning & Maintenance | 13 (100.0%) | 0 (0.0%) |
| Personal Care & Service | 0 (0.0%) | 0 (0.0%) |
| Total (Category) | 33 (100.0%) | 0 (0.0%) |
| Total (Overall) | 139 (69.9%) | 60 (30.1%) |
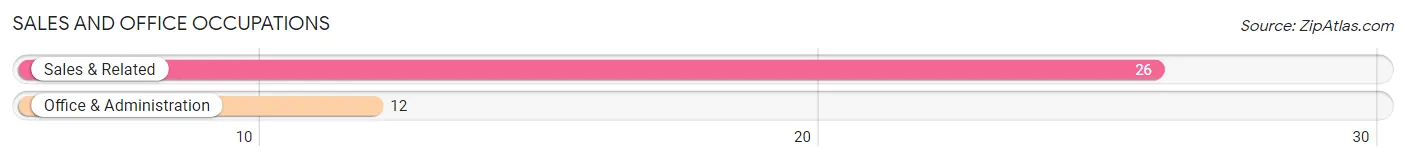
Sales and Office Occupations
The most common Sales and Office occupations in June Lake are Sales & Related (26 | 13.1%), and Office & Administration (12 | 6.0%).
Sales and Office Occupations by Sex
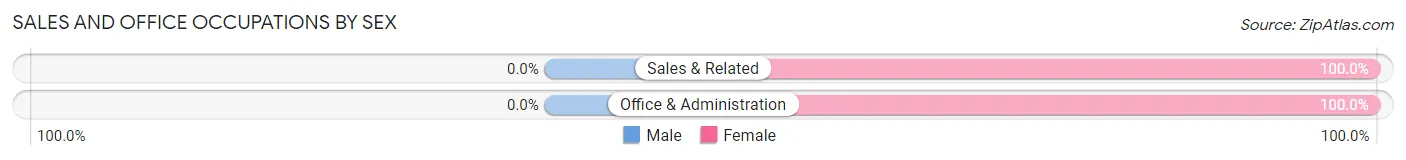
| Occupation | Male | Female |
| Sales & Related | 0 (0.0%) | 26 (100.0%) |
| Office & Administration | 0 (0.0%) | 12 (100.0%) |
| Total (Category) | 0 (0.0%) | 38 (100.0%) |
| Total (Overall) | 139 (69.9%) | 60 (30.1%) |
Natural Resources, Construction and Maintenance Occupations
The most common Natural Resources, Construction and Maintenance occupations in June Lake are , and Installation, Maintenance & Repair (30 | 15.1%).
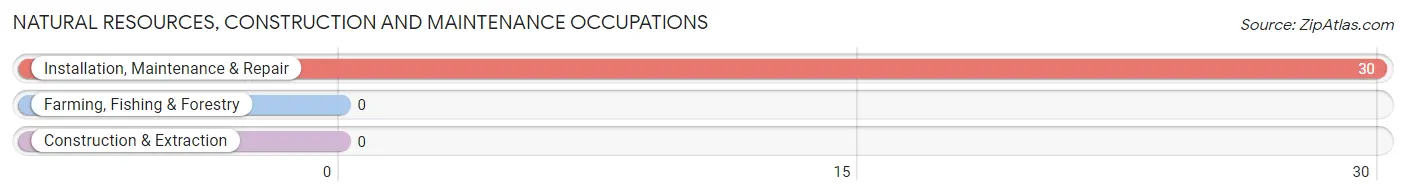
Natural Resources, Construction and Maintenance Occupations by Sex
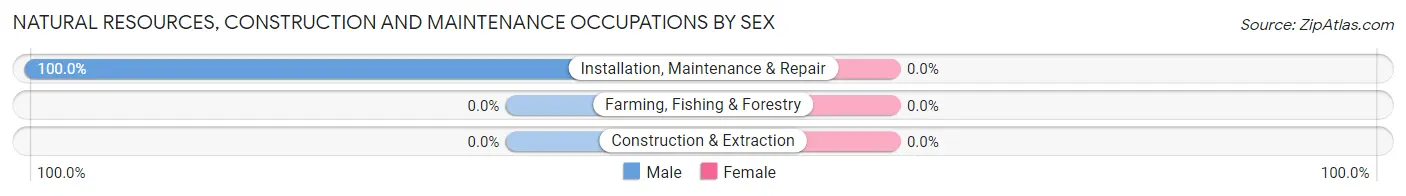
| Occupation | Male | Female |
| Farming, Fishing & Forestry | 0 (0.0%) | 0 (0.0%) |
| Construction & Extraction | 0 (0.0%) | 0 (0.0%) |
| Installation, Maintenance & Repair | 30 (100.0%) | 0 (0.0%) |
| Total (Category) | 30 (100.0%) | 0 (0.0%) |
| Total (Overall) | 139 (69.9%) | 60 (30.1%) |
Production, Transportation and Moving Occupations
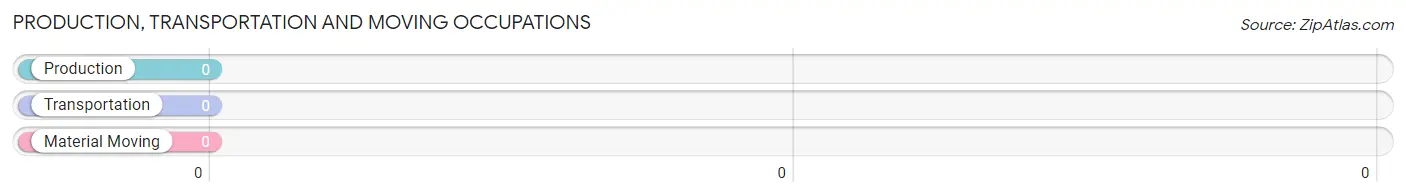
Production, Transportation and Moving Occupations by Sex
| Occupation | Male | Female |
| Production | 0 (0.0%) | 0 (0.0%) |
| Transportation | 0 (0.0%) | 0 (0.0%) |
| Material Moving | 0 (0.0%) | 0 (0.0%) |
| Total (Category) | 0 (0.0%) | 0 (0.0%) |
| Total (Overall) | 139 (69.9%) | 60 (30.1%) |
Employment Industries by Sex in June Lake
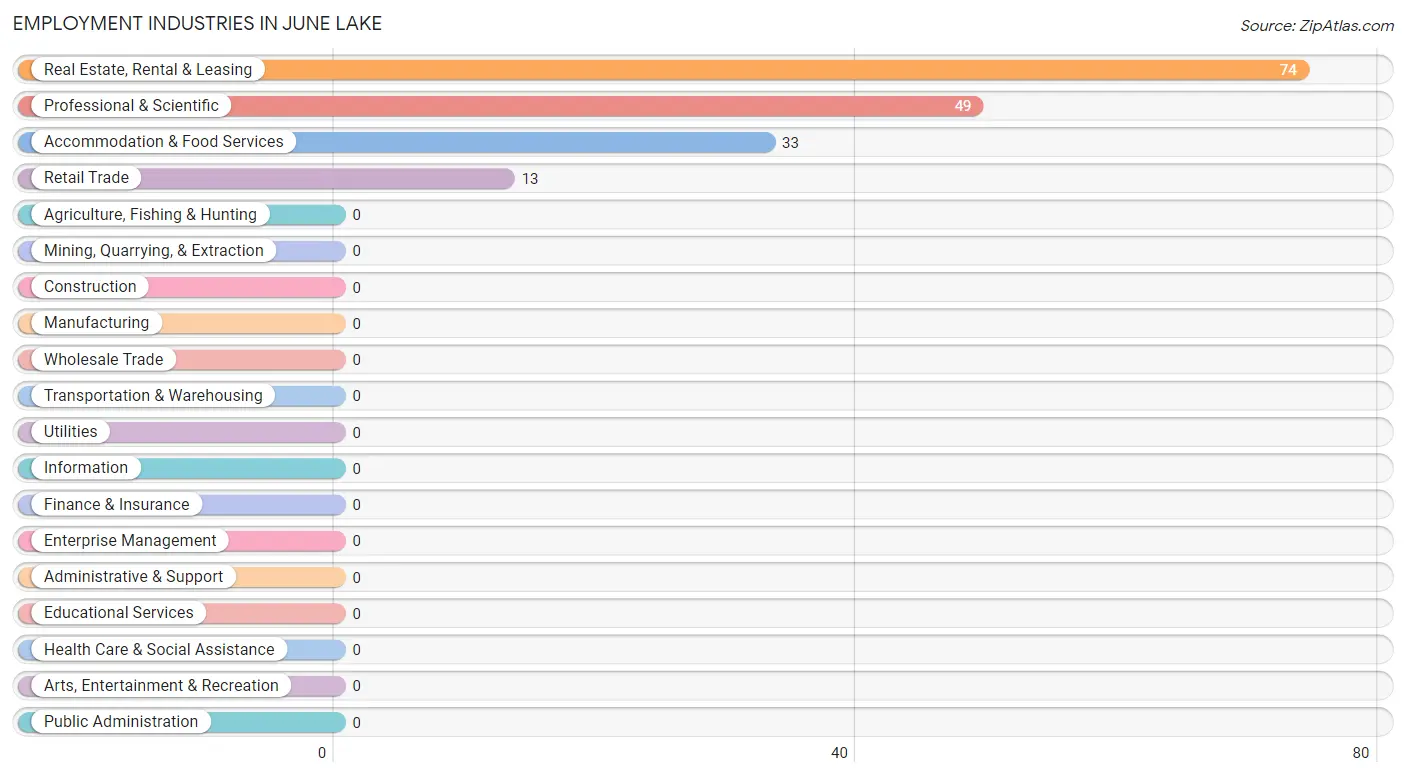
Employment Industries in June Lake
The major employment industries in June Lake include Real Estate, Rental & Leasing (74 | 37.2%), Professional & Scientific (49 | 24.6%), Accommodation & Food Services (33 | 16.6%), and Retail Trade (13 | 6.5%).
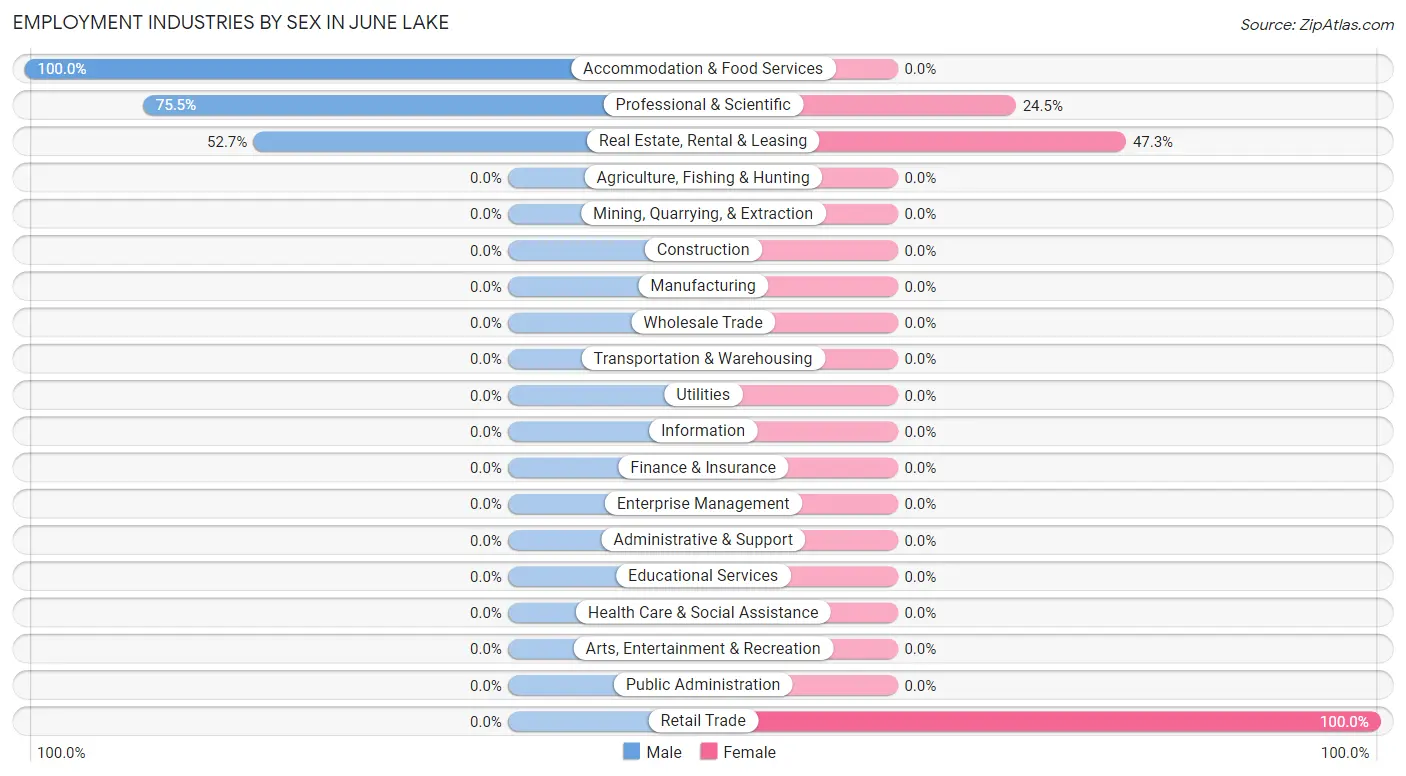
Employment Industries by Sex in June Lake
The June Lake industries that see more men than women are Accommodation & Food Services (100.0%), Professional & Scientific (75.5%), and Real Estate, Rental & Leasing (52.7%), whereas the industries that tend to have a higher number of women are Retail Trade (100.0%), Real Estate, Rental & Leasing (47.3%), and Professional & Scientific (24.5%).
| Industry | Male | Female |
| Agriculture, Fishing & Hunting | 0 (0.0%) | 0 (0.0%) |
| Mining, Quarrying, & Extraction | 0 (0.0%) | 0 (0.0%) |
| Construction | 0 (0.0%) | 0 (0.0%) |
| Manufacturing | 0 (0.0%) | 0 (0.0%) |
| Wholesale Trade | 0 (0.0%) | 0 (0.0%) |
| Retail Trade | 0 (0.0%) | 13 (100.0%) |
| Transportation & Warehousing | 0 (0.0%) | 0 (0.0%) |
| Utilities | 0 (0.0%) | 0 (0.0%) |
| Information | 0 (0.0%) | 0 (0.0%) |
| Finance & Insurance | 0 (0.0%) | 0 (0.0%) |
| Real Estate, Rental & Leasing | 39 (52.7%) | 35 (47.3%) |
| Professional & Scientific | 37 (75.5%) | 12 (24.5%) |
| Enterprise Management | 0 (0.0%) | 0 (0.0%) |
| Administrative & Support | 0 (0.0%) | 0 (0.0%) |
| Educational Services | 0 (0.0%) | 0 (0.0%) |
| Health Care & Social Assistance | 0 (0.0%) | 0 (0.0%) |
| Arts, Entertainment & Recreation | 0 (0.0%) | 0 (0.0%) |
| Accommodation & Food Services | 33 (100.0%) | 0 (0.0%) |
| Public Administration | 0 (0.0%) | 0 (0.0%) |
| Total | 139 (69.9%) | 60 (30.1%) |
Education in June Lake
School Enrollment in June Lake
| School Level | # Students | % Students |
| Nursery / Preschool | 0 | 0.0% |
| Kindergarten | 0 | 0.0% |
| Elementary School | 0 | 0.0% |
| Middle School | 0 | 0.0% |
| High School | 0 | 0.0% |
| College / Undergraduate | 0 | 0.0% |
| Graduate / Professional | 0 | 0.0% |
| Total | 0 | 0.0% |
School Enrollment by Age by Funding Source in June Lake
| Age Bracket | Public School | Private School |
| 3 to 4 Year Olds | 0 (0.0%) | 0 (0.0%) |
| 5 to 9 Year Old | 0 (0.0%) | 0 (0.0%) |
| 10 to 14 Year Olds | 0 (0.0%) | 0 (0.0%) |
| 15 to 17 Year Olds | 0 (0.0%) | 0 (0.0%) |
| 18 to 19 Year Olds | 0 (0.0%) | 0 (0.0%) |
| 20 to 24 Year Olds | 0 (0.0%) | 0 (0.0%) |
| 25 to 34 Year Olds | 0 (0.0%) | 0 (0.0%) |
| 35 Years and over | 0 (0.0%) | 0 (0.0%) |
| Total | 0 (0.0%) | 0 (0.0%) |
Educational Attainment by Field of Study in June Lake
Engineering (37 | 42.0%), business (22 | 25.0%), liberal arts & history (20 | 22.7%), and physical & health sciences (9 | 10.2%) are the most common fields of study among 88 individuals in June Lake who have obtained a bachelor's degree or higher.
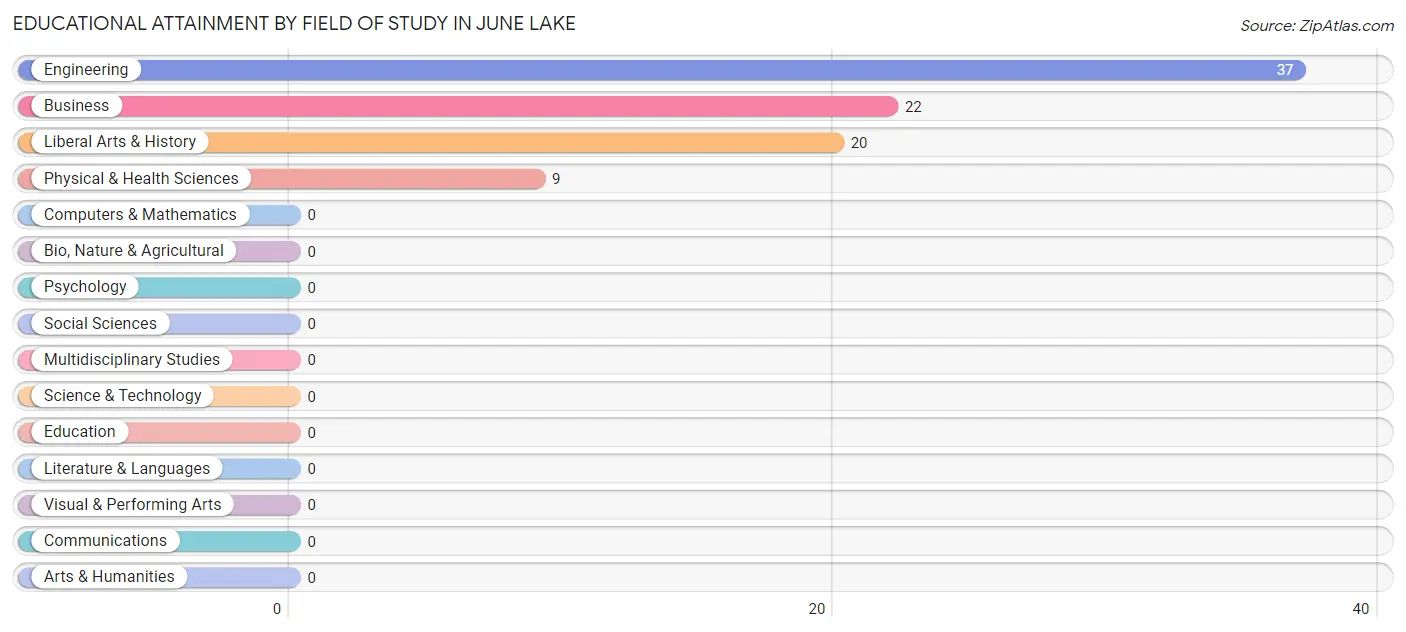
| Field of Study | # Graduates | % Graduates |
| Computers & Mathematics | 0 | 0.0% |
| Bio, Nature & Agricultural | 0 | 0.0% |
| Physical & Health Sciences | 9 | 10.2% |
| Psychology | 0 | 0.0% |
| Social Sciences | 0 | 0.0% |
| Engineering | 37 | 42.0% |
| Multidisciplinary Studies | 0 | 0.0% |
| Science & Technology | 0 | 0.0% |
| Business | 22 | 25.0% |
| Education | 0 | 0.0% |
| Literature & Languages | 0 | 0.0% |
| Liberal Arts & History | 20 | 22.7% |
| Visual & Performing Arts | 0 | 0.0% |
| Communications | 0 | 0.0% |
| Arts & Humanities | 0 | 0.0% |
| Total | 88 | 100.0% |
Transportation & Commute in June Lake
Vehicle Availability by Sex in June Lake
The most prevalent vehicle ownership categories in June Lake are males with 3 vehicles (51, accounting for 36.7%) and females with 3 vehicles (12, making up 85.0%).
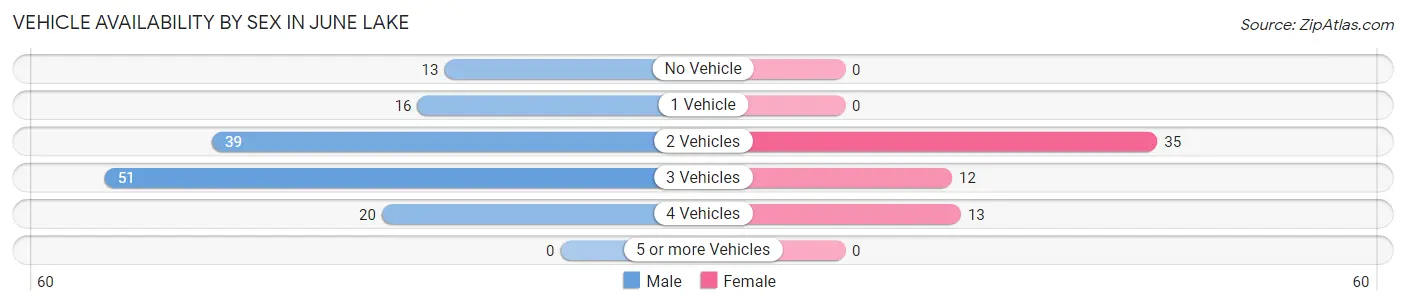
| Vehicles Available | Male | Female |
| No Vehicle | 13 (9.3%) | 0 (0.0%) |
| 1 Vehicle | 16 (11.5%) | 0 (0.0%) |
| 2 Vehicles | 39 (28.1%) | 35 (58.3%) |
| 3 Vehicles | 51 (36.7%) | 12 (20.0%) |
| 4 Vehicles | 20 (14.4%) | 13 (21.7%) |
| 5 or more Vehicles | 0 (0.0%) | 0 (0.0%) |
| Total | 139 (100.0%) | 60 (100.0%) |
Commute Time in June Lake
The most frequently occuring commute durations in June Lake are 5 to 9 minutes (65 commuters, 43.3%), less than 5 minutes (55 commuters, 36.7%), and 15 to 19 minutes (30 commuters, 20.0%).
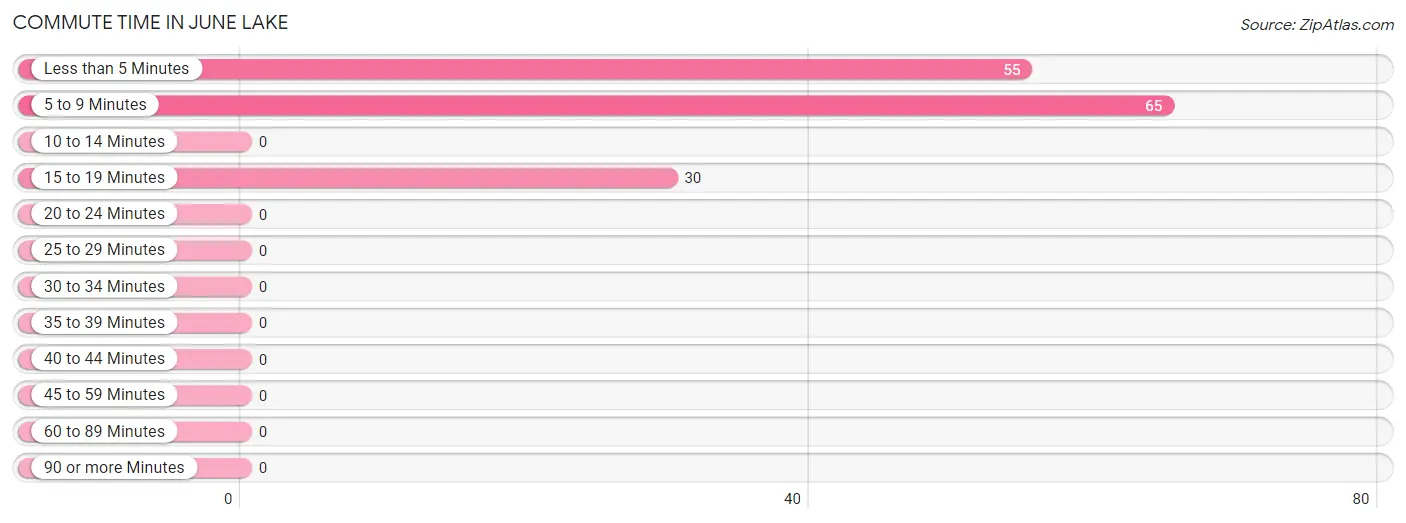
| Commute Time | # Commuters | % Commuters |
| Less than 5 Minutes | 55 | 36.7% |
| 5 to 9 Minutes | 65 | 43.3% |
| 10 to 14 Minutes | 0 | 0.0% |
| 15 to 19 Minutes | 30 | 20.0% |
| 20 to 24 Minutes | 0 | 0.0% |
| 25 to 29 Minutes | 0 | 0.0% |
| 30 to 34 Minutes | 0 | 0.0% |
| 35 to 39 Minutes | 0 | 0.0% |
| 40 to 44 Minutes | 0 | 0.0% |
| 45 to 59 Minutes | 0 | 0.0% |
| 60 to 89 Minutes | 0 | 0.0% |
| 90 or more Minutes | 0 | 0.0% |
Commute Time by Sex in June Lake
The most common commute times in June Lake are 5 to 9 minutes (39 commuters, 38.2%) for males and 5 to 9 minutes (26 commuters, 54.2%) for females.
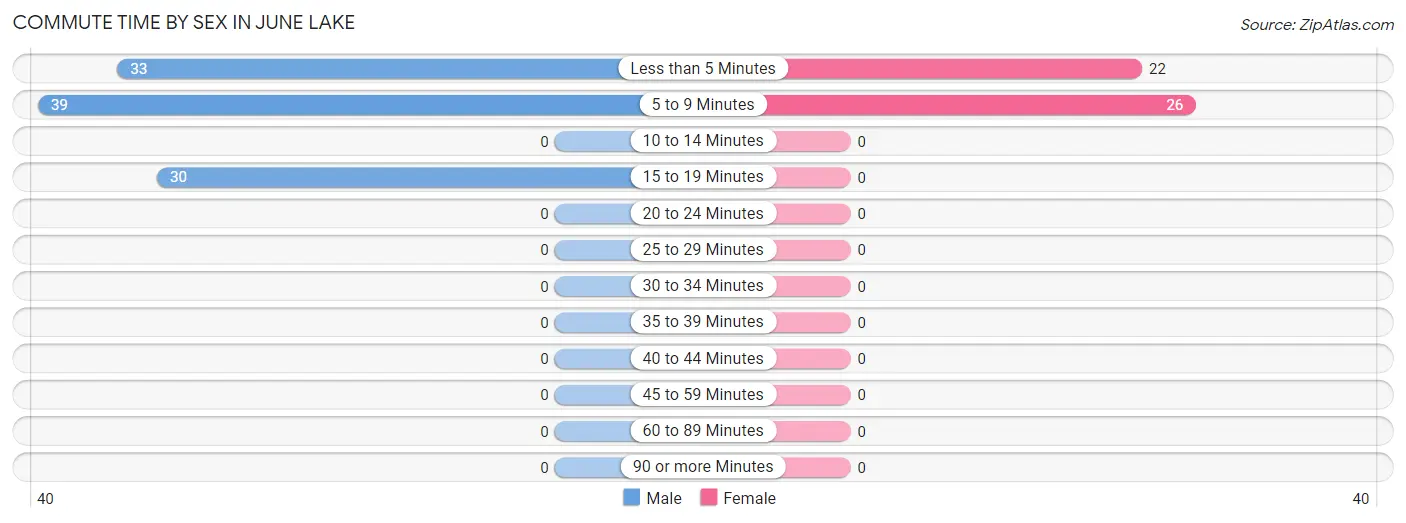
| Commute Time | Male | Female |
| Less than 5 Minutes | 33 (32.4%) | 22 (45.8%) |
| 5 to 9 Minutes | 39 (38.2%) | 26 (54.2%) |
| 10 to 14 Minutes | 0 (0.0%) | 0 (0.0%) |
| 15 to 19 Minutes | 30 (29.4%) | 0 (0.0%) |
| 20 to 24 Minutes | 0 (0.0%) | 0 (0.0%) |
| 25 to 29 Minutes | 0 (0.0%) | 0 (0.0%) |
| 30 to 34 Minutes | 0 (0.0%) | 0 (0.0%) |
| 35 to 39 Minutes | 0 (0.0%) | 0 (0.0%) |
| 40 to 44 Minutes | 0 (0.0%) | 0 (0.0%) |
| 45 to 59 Minutes | 0 (0.0%) | 0 (0.0%) |
| 60 to 89 Minutes | 0 (0.0%) | 0 (0.0%) |
| 90 or more Minutes | 0 (0.0%) | 0 (0.0%) |
Time of Departure to Work by Sex in June Lake
The most frequent times of departure to work in June Lake are 9:00 AM to 9:59 AM (33, 32.4%) for males and 7:30 AM to 7:59 AM (26, 54.2%) for females.
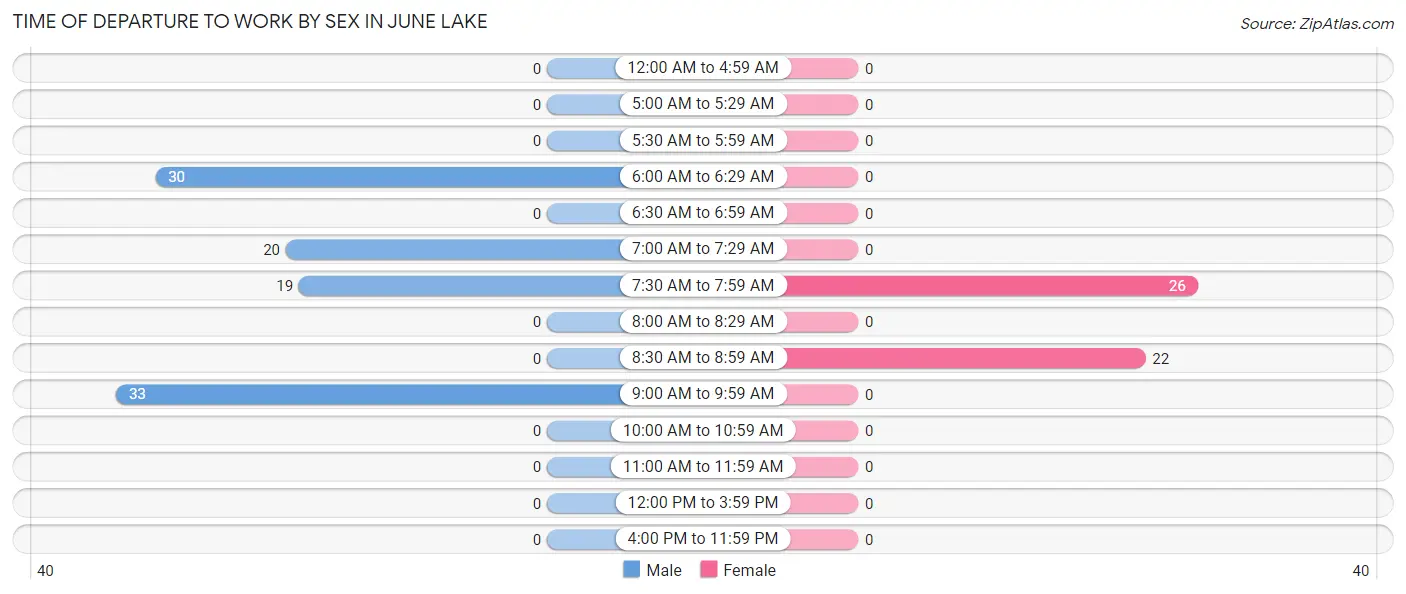
| Time of Departure | Male | Female |
| 12:00 AM to 4:59 AM | 0 (0.0%) | 0 (0.0%) |
| 5:00 AM to 5:29 AM | 0 (0.0%) | 0 (0.0%) |
| 5:30 AM to 5:59 AM | 0 (0.0%) | 0 (0.0%) |
| 6:00 AM to 6:29 AM | 30 (29.4%) | 0 (0.0%) |
| 6:30 AM to 6:59 AM | 0 (0.0%) | 0 (0.0%) |
| 7:00 AM to 7:29 AM | 20 (19.6%) | 0 (0.0%) |
| 7:30 AM to 7:59 AM | 19 (18.6%) | 26 (54.2%) |
| 8:00 AM to 8:29 AM | 0 (0.0%) | 0 (0.0%) |
| 8:30 AM to 8:59 AM | 0 (0.0%) | 22 (45.8%) |
| 9:00 AM to 9:59 AM | 33 (32.4%) | 0 (0.0%) |
| 10:00 AM to 10:59 AM | 0 (0.0%) | 0 (0.0%) |
| 11:00 AM to 11:59 AM | 0 (0.0%) | 0 (0.0%) |
| 12:00 PM to 3:59 PM | 0 (0.0%) | 0 (0.0%) |
| 4:00 PM to 11:59 PM | 0 (0.0%) | 0 (0.0%) |
| Total | 102 (100.0%) | 48 (100.0%) |
Housing Occupancy in June Lake
Occupancy by Ownership in June Lake
Of the total 141 dwellings in June Lake, owner-occupied units account for 115 (81.6%), while renter-occupied units make up 26 (18.4%).
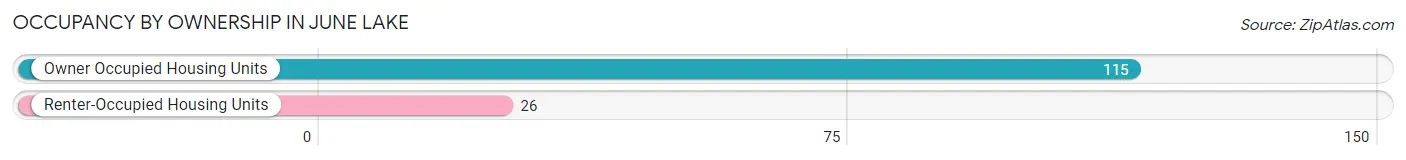
| Occupancy | # Housing Units | % Housing Units |
| Owner Occupied Housing Units | 115 | 81.6% |
| Renter-Occupied Housing Units | 26 | 18.4% |
| Total Occupied Housing Units | 141 | 100.0% |
Occupancy by Household Size in June Lake
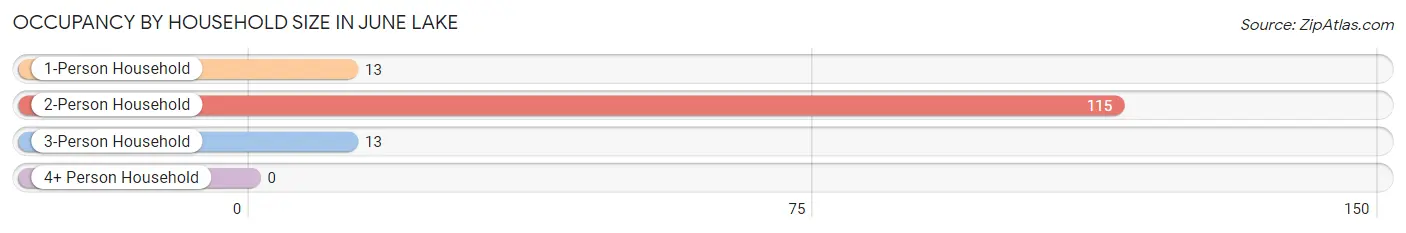
| Household Size | # Housing Units | % Housing Units |
| 1-Person Household | 13 | 9.2% |
| 2-Person Household | 115 | 81.6% |
| 3-Person Household | 13 | 9.2% |
| 4+ Person Household | 0 | 0.0% |
| Total Housing Units | 141 | 100.0% |
Occupancy by Ownership by Household Size in June Lake
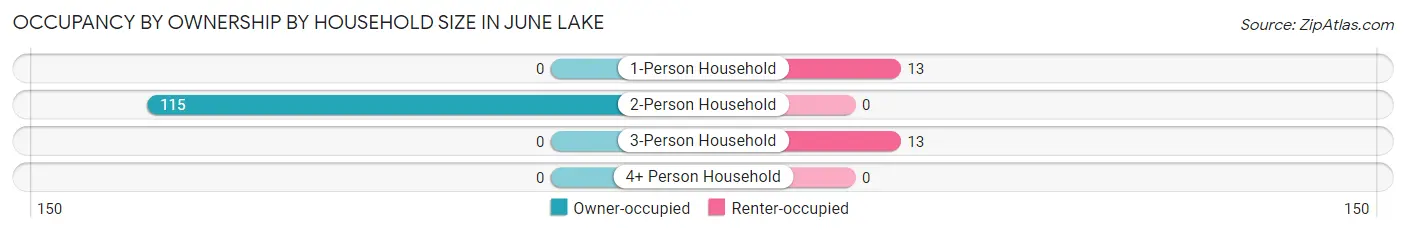
| Household Size | Owner-occupied | Renter-occupied |
| 1-Person Household | 0 (0.0%) | 13 (100.0%) |
| 2-Person Household | 115 (100.0%) | 0 (0.0%) |
| 3-Person Household | 0 (0.0%) | 13 (100.0%) |
| 4+ Person Household | 0 (0.0%) | 0 (0.0%) |
| Total Housing Units | 115 (81.6%) | 26 (18.4%) |
Occupancy by Educational Attainment in June Lake
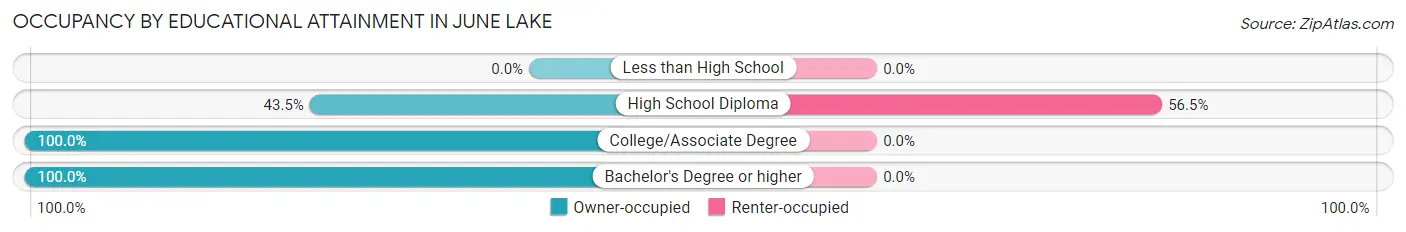
| Household Size | Owner-occupied | Renter-occupied |
| Less than High School | 0 (0.0%) | 0 (0.0%) |
| High School Diploma | 20 (43.5%) | 26 (56.5%) |
| College/Associate Degree | 48 (100.0%) | 0 (0.0%) |
| Bachelor's Degree or higher | 47 (100.0%) | 0 (0.0%) |
Occupancy by Age of Householder in June Lake
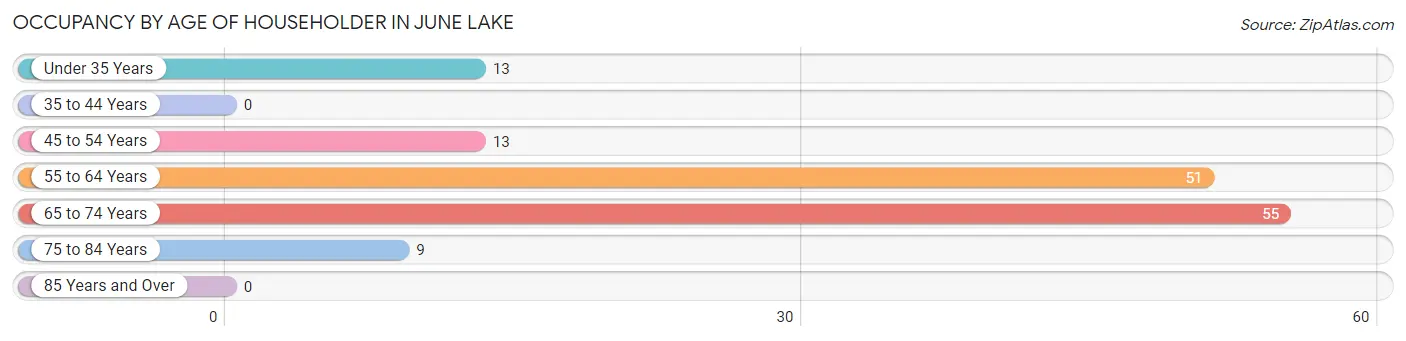
| Age Bracket | # Households | % Households |
| Under 35 Years | 13 | 9.2% |
| 35 to 44 Years | 0 | 0.0% |
| 45 to 54 Years | 13 | 9.2% |
| 55 to 64 Years | 51 | 36.2% |
| 65 to 74 Years | 55 | 39.0% |
| 75 to 84 Years | 9 | 6.4% |
| 85 Years and Over | 0 | 0.0% |
| Total | 141 | 100.0% |
Housing Finances in June Lake
Median Income by Occupancy in June Lake
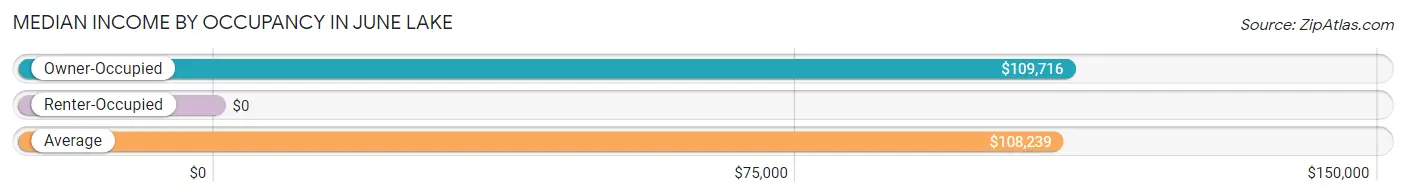
| Occupancy Type | # Households | Median Income |
| Owner-Occupied | 115 (81.6%) | $109,716 |
| Renter-Occupied | 26 (18.4%) | $0 |
| Average | 141 (100.0%) | $108,239 |
Occupancy by Householder Income Bracket in June Lake
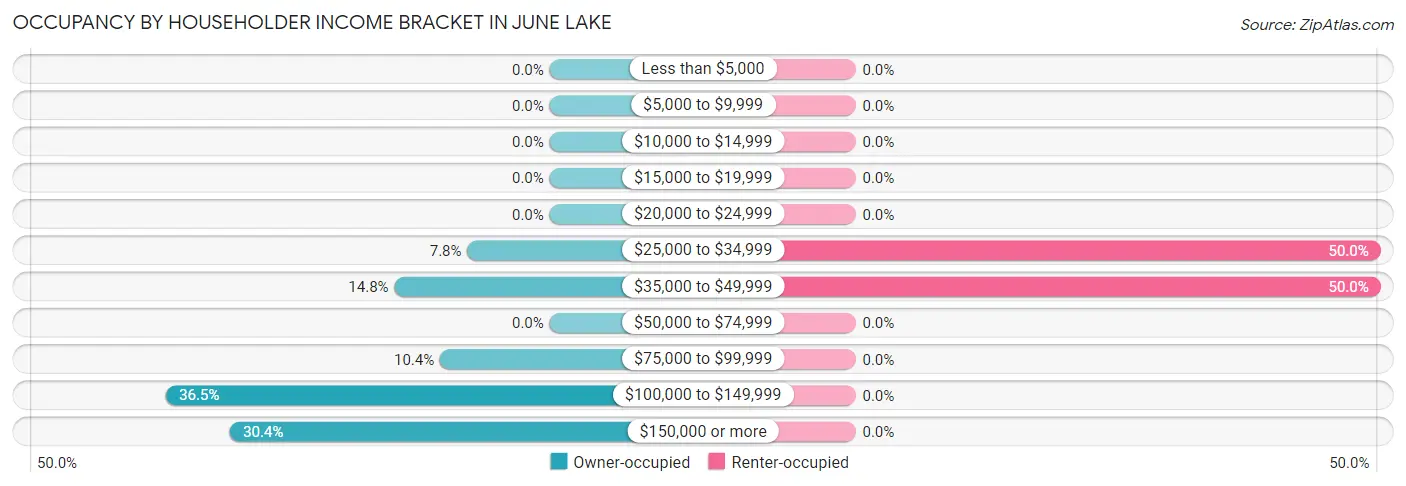
| Income Bracket | Owner-occupied | Renter-occupied |
| Less than $5,000 | 0 (0.0%) | 0 (0.0%) |
| $5,000 to $9,999 | 0 (0.0%) | 0 (0.0%) |
| $10,000 to $14,999 | 0 (0.0%) | 0 (0.0%) |
| $15,000 to $19,999 | 0 (0.0%) | 0 (0.0%) |
| $20,000 to $24,999 | 0 (0.0%) | 0 (0.0%) |
| $25,000 to $34,999 | 9 (7.8%) | 13 (50.0%) |
| $35,000 to $49,999 | 17 (14.8%) | 13 (50.0%) |
| $50,000 to $74,999 | 0 (0.0%) | 0 (0.0%) |
| $75,000 to $99,999 | 12 (10.4%) | 0 (0.0%) |
| $100,000 to $149,999 | 42 (36.5%) | 0 (0.0%) |
| $150,000 or more | 35 (30.4%) | 0 (0.0%) |
| Total | 115 (100.0%) | 26 (100.0%) |
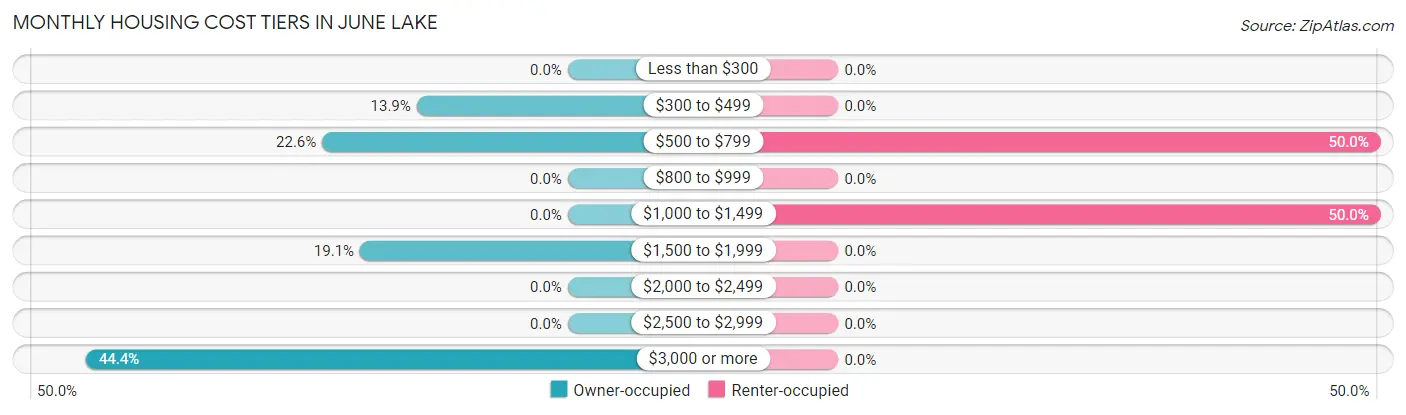
Monthly Housing Cost Tiers in June Lake
| Monthly Cost | Owner-occupied | Renter-occupied |
| Less than $300 | 0 (0.0%) | 0 (0.0%) |
| $300 to $499 | 16 (13.9%) | 0 (0.0%) |
| $500 to $799 | 26 (22.6%) | 13 (50.0%) |
| $800 to $999 | 0 (0.0%) | 0 (0.0%) |
| $1,000 to $1,499 | 0 (0.0%) | 13 (50.0%) |
| $1,500 to $1,999 | 22 (19.1%) | 0 (0.0%) |
| $2,000 to $2,499 | 0 (0.0%) | 0 (0.0%) |
| $2,500 to $2,999 | 0 (0.0%) | 0 (0.0%) |
| $3,000 or more | 51 (44.4%) | 0 (0.0%) |
| Total | 115 (100.0%) | 26 (100.0%) |
Physical Housing Characteristics in June Lake
Housing Structures in June Lake
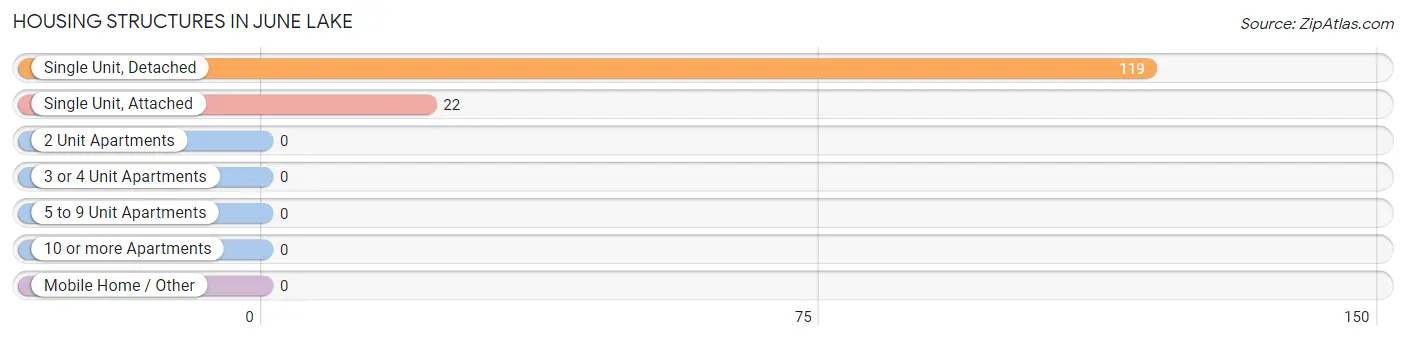
| Structure Type | # Housing Units | % Housing Units |
| Single Unit, Detached | 119 | 84.4% |
| Single Unit, Attached | 22 | 15.6% |
| 2 Unit Apartments | 0 | 0.0% |
| 3 or 4 Unit Apartments | 0 | 0.0% |
| 5 to 9 Unit Apartments | 0 | 0.0% |
| 10 or more Apartments | 0 | 0.0% |
| Mobile Home / Other | 0 | 0.0% |
| Total | 141 | 100.0% |
Housing Structures by Occupancy in June Lake
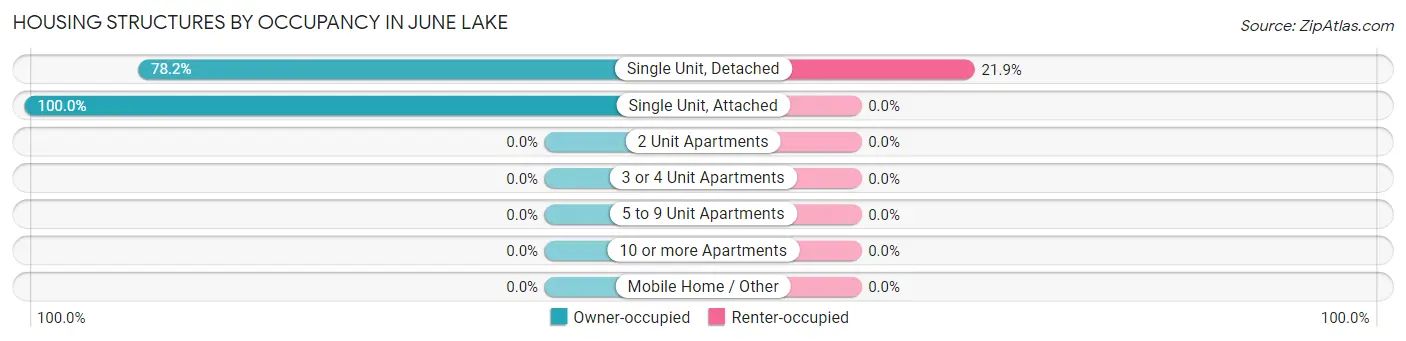
| Structure Type | Owner-occupied | Renter-occupied |
| Single Unit, Detached | 93 (78.1%) | 26 (21.8%) |
| Single Unit, Attached | 22 (100.0%) | 0 (0.0%) |
| 2 Unit Apartments | 0 (0.0%) | 0 (0.0%) |
| 3 or 4 Unit Apartments | 0 (0.0%) | 0 (0.0%) |
| 5 to 9 Unit Apartments | 0 (0.0%) | 0 (0.0%) |
| 10 or more Apartments | 0 (0.0%) | 0 (0.0%) |
| Mobile Home / Other | 0 (0.0%) | 0 (0.0%) |
| Total | 115 (81.6%) | 26 (18.4%) |
Housing Structures by Number of Rooms in June Lake
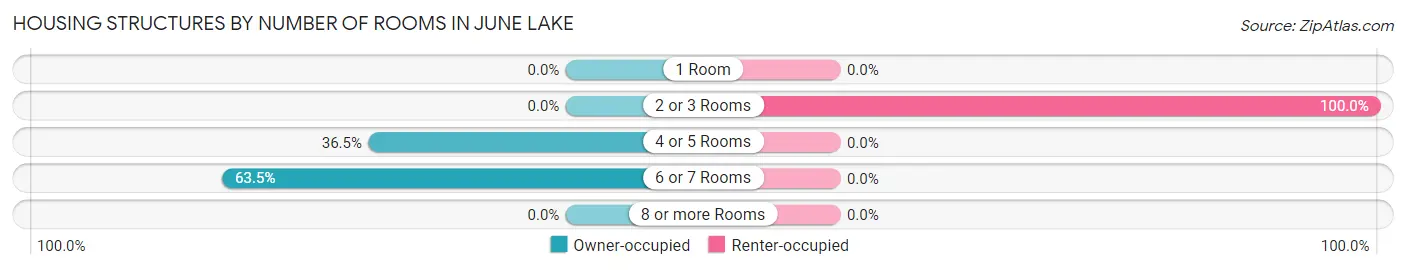
| Number of Rooms | Owner-occupied | Renter-occupied |
| 1 Room | 0 (0.0%) | 0 (0.0%) |
| 2 or 3 Rooms | 0 (0.0%) | 26 (100.0%) |
| 4 or 5 Rooms | 42 (36.5%) | 0 (0.0%) |
| 6 or 7 Rooms | 73 (63.5%) | 0 (0.0%) |
| 8 or more Rooms | 0 (0.0%) | 0 (0.0%) |
| Total | 115 (100.0%) | 26 (100.0%) |
Housing Structure by Heating Type in June Lake
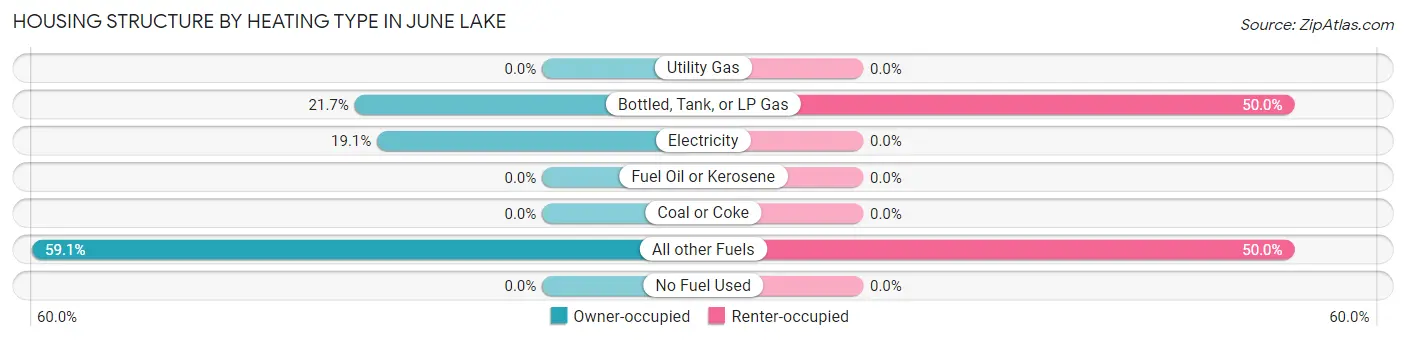
| Heating Type | Owner-occupied | Renter-occupied |
| Utility Gas | 0 (0.0%) | 0 (0.0%) |
| Bottled, Tank, or LP Gas | 25 (21.7%) | 13 (50.0%) |
| Electricity | 22 (19.1%) | 0 (0.0%) |
| Fuel Oil or Kerosene | 0 (0.0%) | 0 (0.0%) |
| Coal or Coke | 0 (0.0%) | 0 (0.0%) |
| All other Fuels | 68 (59.1%) | 13 (50.0%) |
| No Fuel Used | 0 (0.0%) | 0 (0.0%) |
| Total | 115 (100.0%) | 26 (100.0%) |
Household Vehicle Usage in June Lake
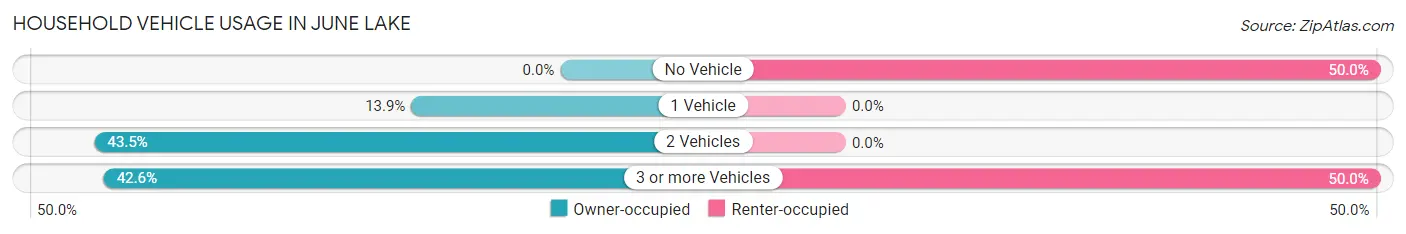
| Vehicles per Household | Owner-occupied | Renter-occupied |
| No Vehicle | 0 (0.0%) | 13 (50.0%) |
| 1 Vehicle | 16 (13.9%) | 0 (0.0%) |
| 2 Vehicles | 50 (43.5%) | 0 (0.0%) |
| 3 or more Vehicles | 49 (42.6%) | 13 (50.0%) |
| Total | 115 (100.0%) | 26 (100.0%) |
Real Estate & Mortgages in June Lake
Real Estate and Mortgage Overview in June Lake
| Characteristic | Without Mortgage | With Mortgage |
| Housing Units | 42 | 73 |
| Median Property Value | $710,000 | $486,900 |
| Median Household Income | - | - |
| Monthly Housing Costs | $619 | $51 |
| Real Estate Taxes | $2,840 | $0 |
Property Value by Mortgage Status in June Lake
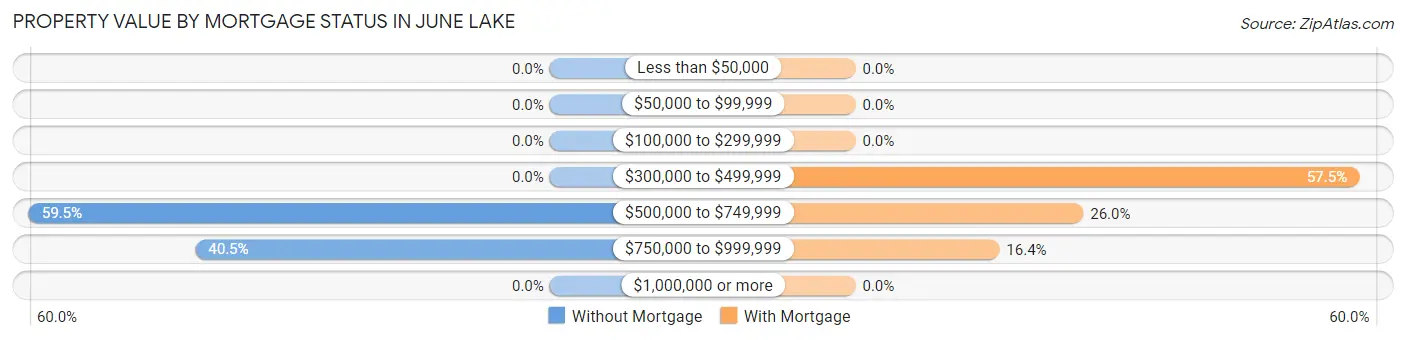
| Property Value | Without Mortgage | With Mortgage |
| Less than $50,000 | 0 (0.0%) | 0 (0.0%) |
| $50,000 to $99,999 | 0 (0.0%) | 0 (0.0%) |
| $100,000 to $299,999 | 0 (0.0%) | 0 (0.0%) |
| $300,000 to $499,999 | 0 (0.0%) | 42 (57.5%) |
| $500,000 to $749,999 | 25 (59.5%) | 19 (26.0%) |
| $750,000 to $999,999 | 17 (40.5%) | 12 (16.4%) |
| $1,000,000 or more | 0 (0.0%) | 0 (0.0%) |
| Total | 42 (100.0%) | 73 (100.0%) |
Household Income by Mortgage Status in June Lake
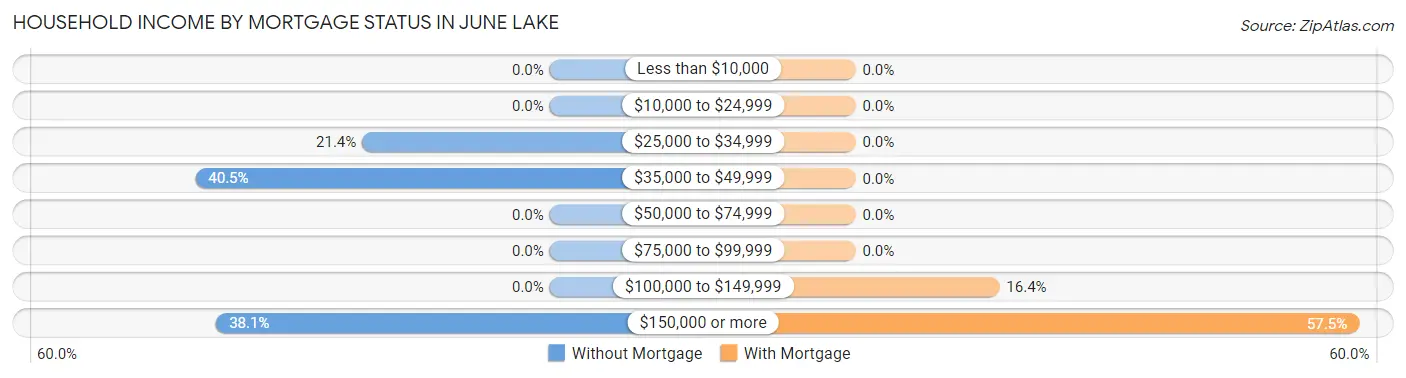
| Household Income | Without Mortgage | With Mortgage |
| Less than $10,000 | 0 (0.0%) | 0 (0.0%) |
| $10,000 to $24,999 | 0 (0.0%) | 0 (0.0%) |
| $25,000 to $34,999 | 9 (21.4%) | 0 (0.0%) |
| $35,000 to $49,999 | 17 (40.5%) | 0 (0.0%) |
| $50,000 to $74,999 | 0 (0.0%) | 0 (0.0%) |
| $75,000 to $99,999 | 0 (0.0%) | 0 (0.0%) |
| $100,000 to $149,999 | 0 (0.0%) | 12 (16.4%) |
| $150,000 or more | 16 (38.1%) | 42 (57.5%) |
| Total | 42 (100.0%) | 73 (100.0%) |
Property Value to Household Income Ratio in June Lake
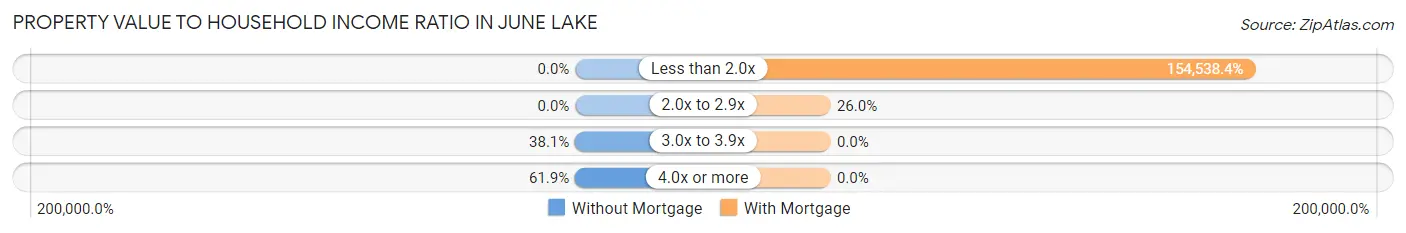
| Value-to-Income Ratio | Without Mortgage | With Mortgage |
| Less than 2.0x | 0 (0.0%) | 112,813 (154,538.4%) |
| 2.0x to 2.9x | 0 (0.0%) | 19 (26.0%) |
| 3.0x to 3.9x | 16 (38.1%) | 0 (0.0%) |
| 4.0x or more | 26 (61.9%) | 0 (0.0%) |
| Total | 42 (100.0%) | 73 (100.0%) |
Real Estate Taxes by Mortgage Status in June Lake
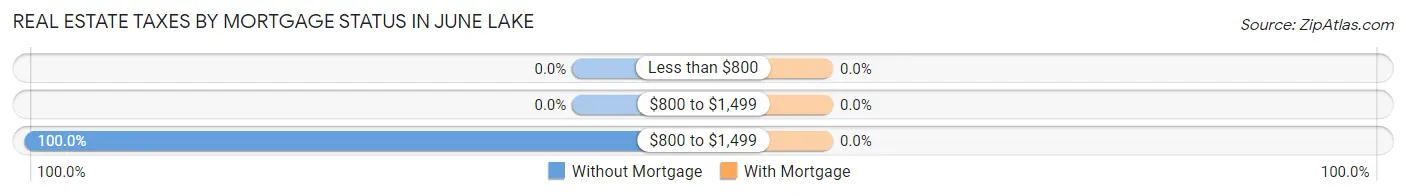
| Property Taxes | Without Mortgage | With Mortgage |
| Less than $800 | 0 (0.0%) | 0 (0.0%) |
| $800 to $1,499 | 0 (0.0%) | 0 (0.0%) |
| $800 to $1,499 | 42 (100.0%) | 0 (0.0%) |
| Total | 42 (100.0%) | 73 (100.0%) |
Health & Disability in June Lake
Health Insurance Coverage by Age in June Lake
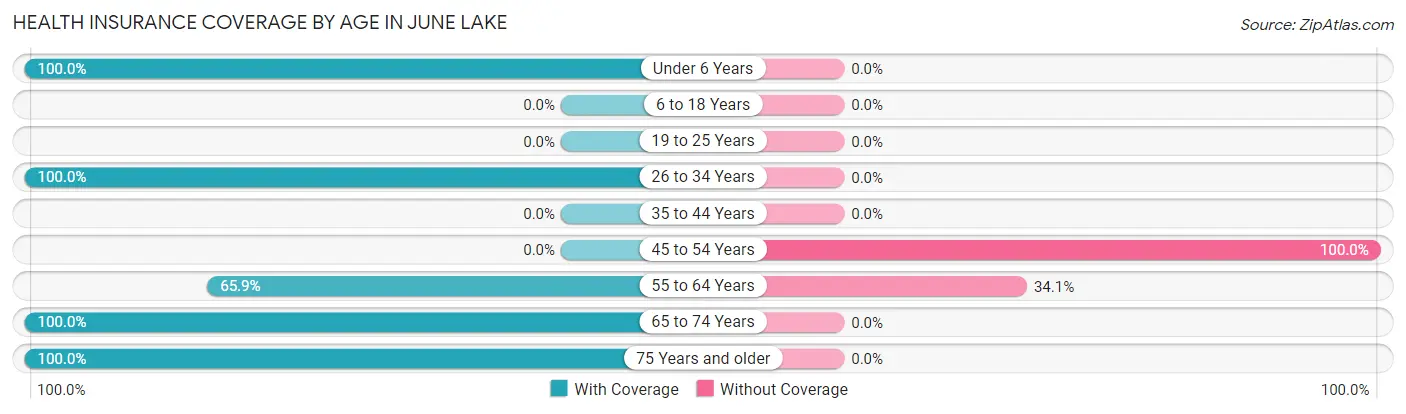
| Age Bracket | With Coverage | Without Coverage |
| Under 6 Years | 17 (100.0%) | 0 (0.0%) |
| 6 to 18 Years | 0 (0.0%) | 0 (0.0%) |
| 19 to 25 Years | 0 (0.0%) | 0 (0.0%) |
| 26 to 34 Years | 43 (100.0%) | 0 (0.0%) |
| 35 to 44 Years | 0 (0.0%) | 0 (0.0%) |
| 45 to 54 Years | 0 (0.0%) | 13 (100.0%) |
| 55 to 64 Years | 60 (65.9%) | 31 (34.1%) |
| 65 to 74 Years | 109 (100.0%) | 0 (0.0%) |
| 75 Years and older | 29 (100.0%) | 0 (0.0%) |
| Total | 258 (85.4%) | 44 (14.6%) |
Health Insurance Coverage by Citizenship Status in June Lake
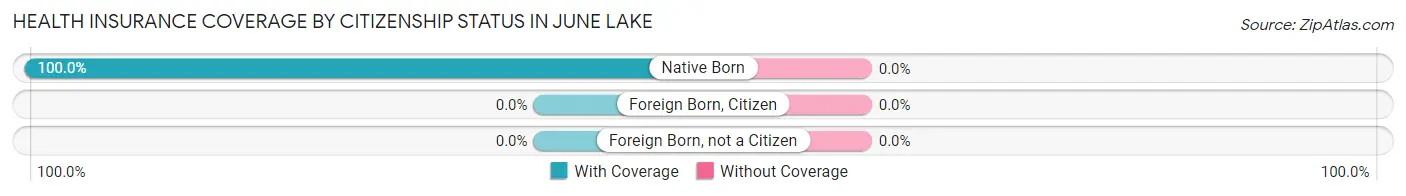
| Citizenship Status | With Coverage | Without Coverage |
| Native Born | 17 (100.0%) | 0 (0.0%) |
| Foreign Born, Citizen | 0 (0.0%) | 0 (0.0%) |
| Foreign Born, not a Citizen | 0 (0.0%) | 0 (0.0%) |
Health Insurance Coverage by Household Income in June Lake
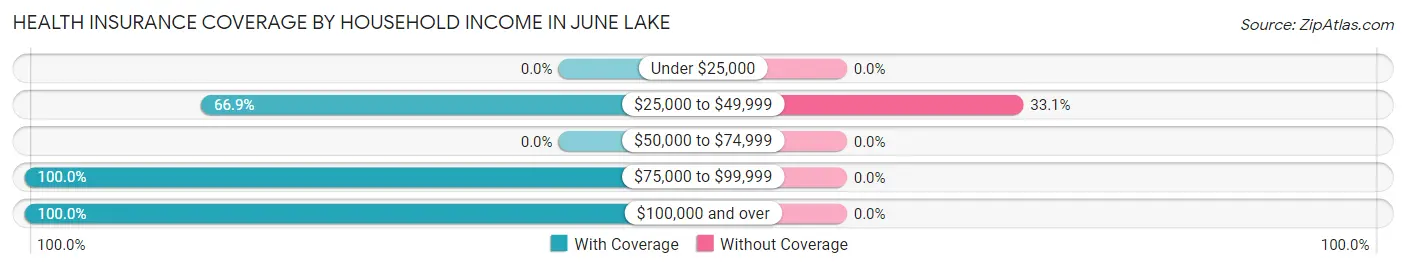
| Household Income | With Coverage | Without Coverage |
| Under $25,000 | 0 (0.0%) | 0 (0.0%) |
| $25,000 to $49,999 | 89 (66.9%) | 44 (33.1%) |
| $50,000 to $74,999 | 0 (0.0%) | 0 (0.0%) |
| $75,000 to $99,999 | 33 (100.0%) | 0 (0.0%) |
| $100,000 and over | 136 (100.0%) | 0 (0.0%) |
Public vs Private Health Insurance Coverage by Age in June Lake
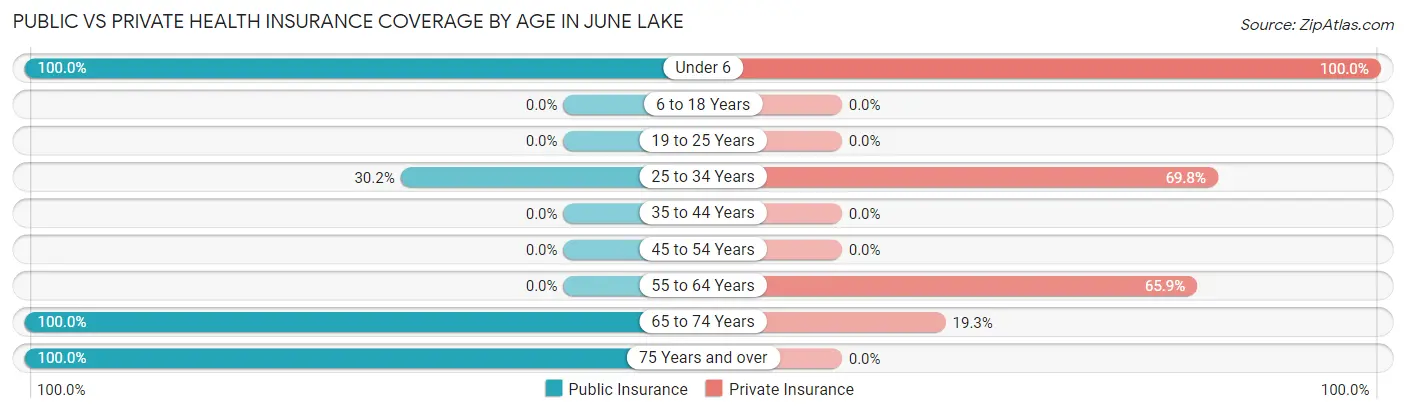
| Age Bracket | Public Insurance | Private Insurance |
| Under 6 | 17 (100.0%) | 17 (100.0%) |
| 6 to 18 Years | 0 (0.0%) | 0 (0.0%) |
| 19 to 25 Years | 0 (0.0%) | 0 (0.0%) |
| 25 to 34 Years | 13 (30.2%) | 30 (69.8%) |
| 35 to 44 Years | 0 (0.0%) | 0 (0.0%) |
| 45 to 54 Years | 0 (0.0%) | 0 (0.0%) |
| 55 to 64 Years | 0 (0.0%) | 60 (65.9%) |
| 65 to 74 Years | 109 (100.0%) | 21 (19.3%) |
| 75 Years and over | 29 (100.0%) | 0 (0.0%) |
| Total | 168 (55.6%) | 128 (42.4%) |
Disability Status by Sex by Age in June Lake
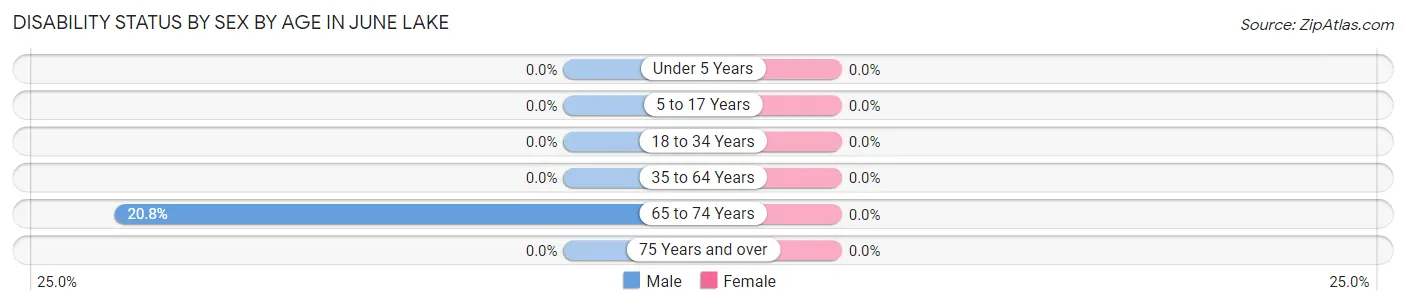
| Age Bracket | Male | Female |
| Under 5 Years | 0 (0.0%) | 0 (0.0%) |
| 5 to 17 Years | 0 (0.0%) | 0 (0.0%) |
| 18 to 34 Years | 0 (0.0%) | 0 (0.0%) |
| 35 to 64 Years | 0 (0.0%) | 0 (0.0%) |
| 65 to 74 Years | 20 (20.8%) | 0 (0.0%) |
| 75 Years and over | 0 (0.0%) | 0 (0.0%) |
Disability Class by Sex by Age in June Lake
Disability Class: Hearing Difficulty
| Age Bracket | Male | Female |
| Under 5 Years | 0 (0.0%) | 0 (0.0%) |
| 5 to 17 Years | 0 (0.0%) | 0 (0.0%) |
| 18 to 34 Years | 0 (0.0%) | 0 (0.0%) |
| 35 to 64 Years | 0 (0.0%) | 0 (0.0%) |
| 65 to 74 Years | 0 (0.0%) | 0 (0.0%) |
| 75 Years and over | 0 (0.0%) | 0 (0.0%) |
Disability Class: Vision Difficulty
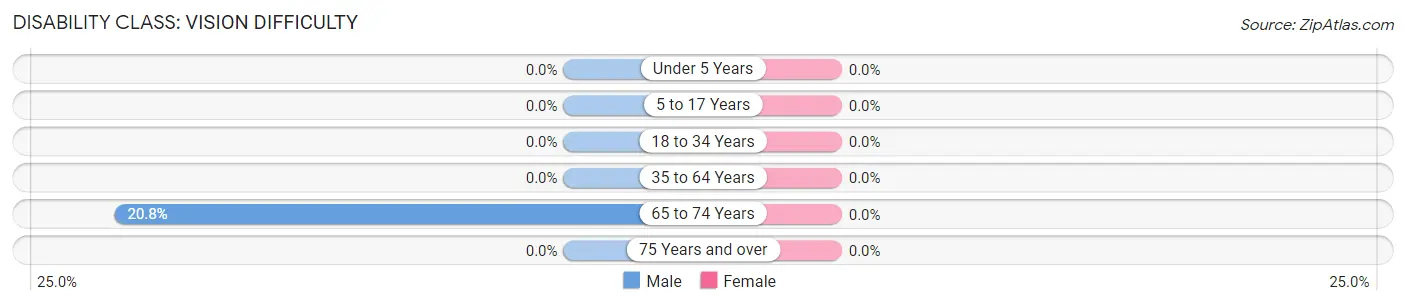
| Age Bracket | Male | Female |
| Under 5 Years | 0 (0.0%) | 0 (0.0%) |
| 5 to 17 Years | 0 (0.0%) | 0 (0.0%) |
| 18 to 34 Years | 0 (0.0%) | 0 (0.0%) |
| 35 to 64 Years | 0 (0.0%) | 0 (0.0%) |
| 65 to 74 Years | 20 (20.8%) | 0 (0.0%) |
| 75 Years and over | 0 (0.0%) | 0 (0.0%) |
Disability Class: Cognitive Difficulty
| Age Bracket | Male | Female |
| 5 to 17 Years | 0 (0.0%) | 0 (0.0%) |
| 18 to 34 Years | 0 (0.0%) | 0 (0.0%) |
| 35 to 64 Years | 0 (0.0%) | 0 (0.0%) |
| 65 to 74 Years | 0 (0.0%) | 0 (0.0%) |
| 75 Years and over | 0 (0.0%) | 0 (0.0%) |
Disability Class: Ambulatory Difficulty
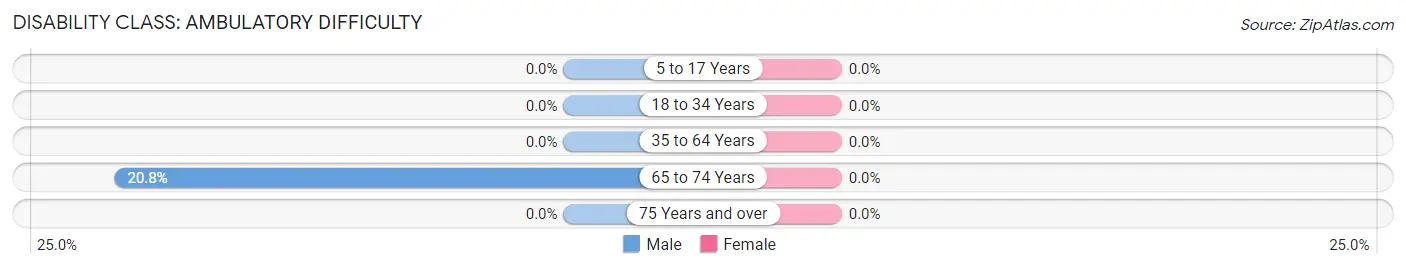
| Age Bracket | Male | Female |
| 5 to 17 Years | 0 (0.0%) | 0 (0.0%) |
| 18 to 34 Years | 0 (0.0%) | 0 (0.0%) |
| 35 to 64 Years | 0 (0.0%) | 0 (0.0%) |
| 65 to 74 Years | 20 (20.8%) | 0 (0.0%) |
| 75 Years and over | 0 (0.0%) | 0 (0.0%) |
Disability Class: Self-Care Difficulty
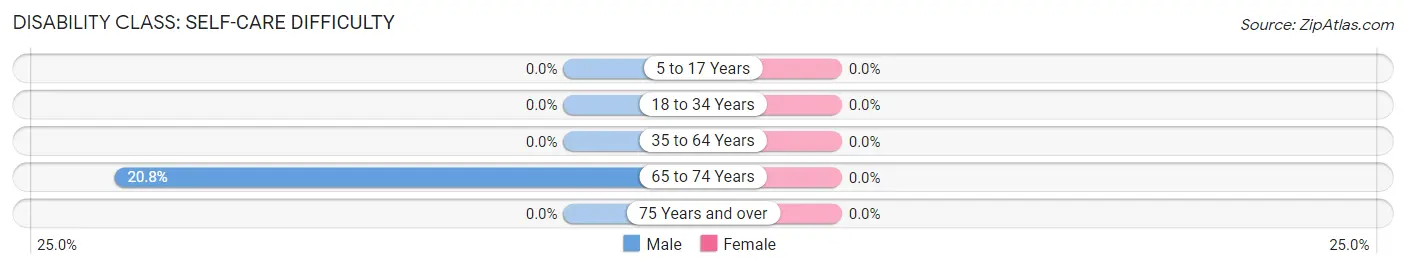
| Age Bracket | Male | Female |
| 5 to 17 Years | 0 (0.0%) | 0 (0.0%) |
| 18 to 34 Years | 0 (0.0%) | 0 (0.0%) |
| 35 to 64 Years | 0 (0.0%) | 0 (0.0%) |
| 65 to 74 Years | 20 (20.8%) | 0 (0.0%) |
| 75 Years and over | 0 (0.0%) | 0 (0.0%) |
Technology Access in June Lake
Computing Device Access in June Lake
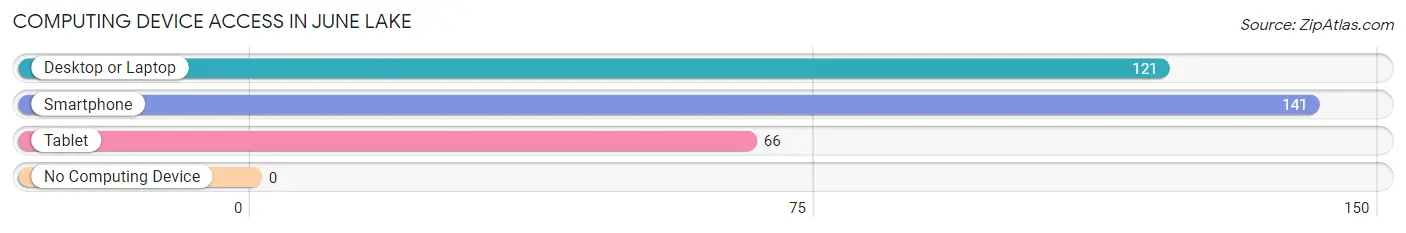
| Device Type | # Households | % Households |
| Desktop or Laptop | 121 | 85.8% |
| Smartphone | 141 | 100.0% |
| Tablet | 66 | 46.8% |
| No Computing Device | 0 | 0.0% |
| Total | 141 | 100.0% |
Internet Access in June Lake
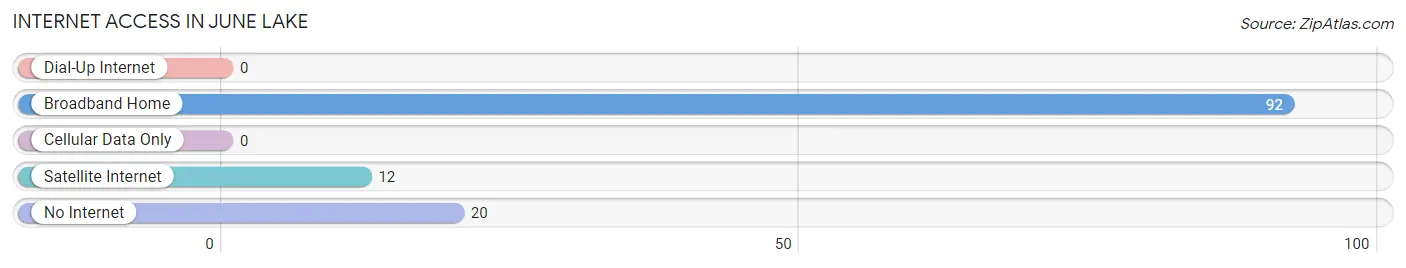
| Internet Type | # Households | % Households |
| Dial-Up Internet | 0 | 0.0% |
| Broadband Home | 92 | 65.2% |
| Cellular Data Only | 0 | 0.0% |
| Satellite Internet | 12 | 8.5% |
| No Internet | 20 | 14.2% |
| Total | 141 | 100.0% |
June Lake Summary
June Lake is a small unincorporated community located in Mono County, California, United States. It is situated in the Sierra Nevada mountain range, at an elevation of 7,654 feet (2,331 m). The community is located on the eastern shore of June Lake, a natural lake that is part of the June Lake Loop, a popular recreation area. The community is home to a variety of businesses, including lodging, restaurants, and retail stores.
History
The area around June Lake has been inhabited for thousands of years by the Paiute and Mono Native American tribes. The first European settlers arrived in the area in the late 19th century, and the town of June Lake was established in the early 1900s. The town was named after the lake, which was named after June Sallie, the daughter of a local rancher.
In the early 20th century, the area became a popular destination for fishing and camping. The June Lake Loop was developed in the 1920s, and the first resort was built in the 1930s. The area continued to grow in popularity, and by the 1950s, it had become a popular destination for skiing and other winter sports.
Geography
June Lake is located in the Sierra Nevada mountain range, at an elevation of 7,654 feet (2,331 m). The community is situated on the eastern shore of June Lake, a natural lake that is part of the June Lake Loop. The lake is approximately 4 miles (6.4 km) long and 1 mile (1.6 km) wide, and is fed by several small streams. The lake is surrounded by mountains, including Carson Peak, which rises to an elevation of 11,845 feet (3,613 m).
The area around June Lake is characterized by alpine forests, meadows, and lakes. The climate is generally cool and dry, with hot summers and cold winters. The average annual precipitation is approximately 20 inches (51 cm).
Economy
June Lake is a popular tourist destination, and the local economy is largely dependent on tourism. The area is home to a variety of businesses, including lodging, restaurants, and retail stores. The June Lake Loop is a popular destination for fishing, camping, skiing, and other outdoor activities. The area is also home to several ski resorts, including June Mountain and Mammoth Mountain.
Demographics
As of the 2010 census, the population of June Lake was 545. The racial makeup of the town was 94.2% White, 0.2% African American, 0.7% Native American, 0.7% Asian, 0.2% Pacific Islander, 0.7% from other races, and 3.0% from two or more races. Hispanic or Latino of any race were 4.7% of the population.
The median household income in June Lake was $45,000, and the median family income was $50,000. The per capita income was $22,000. About 10.7% of families and 14.2% of the population were below the poverty line, including 18.2% of those under age 18 and 8.3% of those age 65 or over.
Common Questions
What is Per Capita Income in June Lake?
Per Capita income in June Lake is $68,901.
What is the Median Family Income in June Lake?
Median Family Income in June Lake is $108,977.
What is the Median Household income in June Lake?
Median Household Income in June Lake is $108,239.
What is Income or Wage Gap in June Lake?
Income or Wage Gap in June Lake is 2.4%.
Women in June Lake earn 97.6 cents for every dollar earned by a man.
What is Inequality or Gini Index in June Lake?
Inequality or Gini Index in June Lake is 0.48.
What is the Total Population of June Lake?
Total Population of June Lake is 302.
What is the Total Male Population of June Lake?
Total Male Population of June Lake is 182.
What is the Total Female Population of June Lake?
Total Female Population of June Lake is 120.
What is the Ratio of Males per 100 Females in June Lake?
There are 151.67 Males per 100 Females in June Lake.
What is the Ratio of Females per 100 Males in June Lake?
There are 65.93 Females per 100 Males in June Lake.
What is the Median Population Age in June Lake?
Median Population Age in June Lake is 64.2 Years.
What is the Average Family Size in June Lake
Average Family Size in June Lake is 2.0 People.
What is the Average Household Size in June Lake
Average Household Size in June Lake is 2.1 People.
How Large is the Labor Force in June Lake?
There are 199 People in the Labor Forcein in June Lake.
What is the Percentage of People in the Labor Force in June Lake?
69.8% of People are in the Labor Force in June Lake.