Cities with the Lowest Percentage of Owner-Occupied Units in California
RELATED REPORTS & OPTIONS
Lowest Owner-Occupied
California
Compare Cities
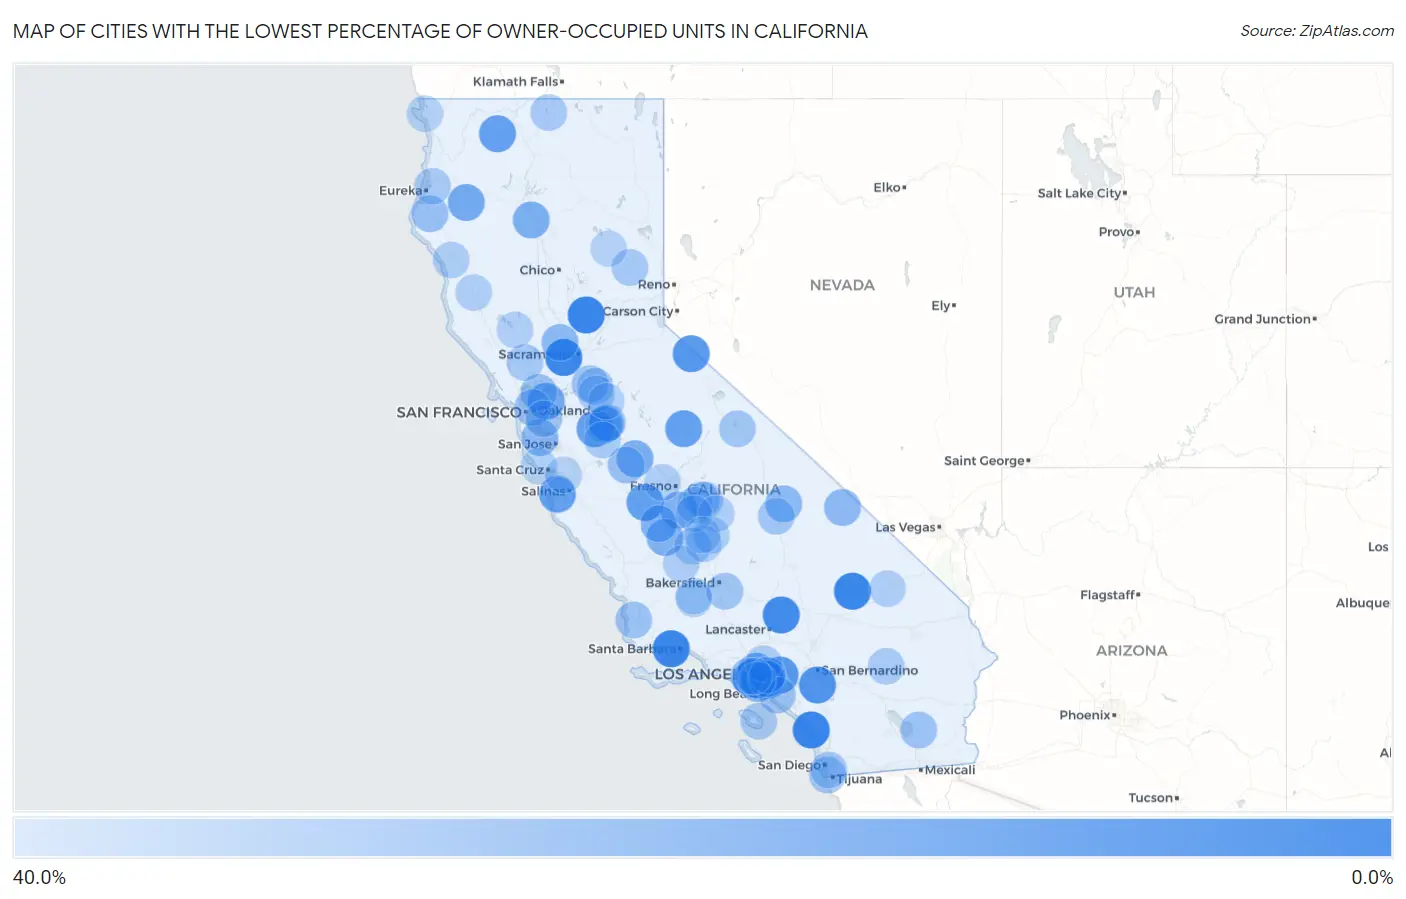
Map of Cities with the Lowest Percentage of Owner-Occupied Units in California
40.0%
0.0%
Cities with the Lowest Percentage of Owner-Occupied Units in California
| City | % Owner-Occupied | vs State | vs National | |
| 1. | Beale Afb | 0.79% | 55.6%(-54.8)#1 | 64.8%(-64.0)#16 |
| 2. | Camp Pendleton South | 1.1% | 55.6%(-54.6)#2 | 64.8%(-63.8)#22 |
| 3. | Isla Vista | 1.4% | 55.6%(-54.2)#3 | 64.8%(-63.4)#29 |
| 4. | Fort Irwin | 1.5% | 55.6%(-54.2)#4 | 64.8%(-63.3)#32 |
| 5. | University Of California Davis | 2.0% | 55.6%(-53.6)#5 | 64.8%(-62.8)#38 |
| 6. | Petaluma Center | 2.5% | 55.6%(-53.1)#6 | 64.8%(-62.3)#42 |
| 7. | Edwards Afb | 3.9% | 55.6%(-51.8)#7 | 64.8%(-60.9)#50 |
| 8. | Vernon | 4.4% | 55.6%(-51.2)#8 | 64.8%(-60.4)#54 |
| 9. | Marina Del Rey | 7.0% | 55.6%(-48.6)#9 | 64.8%(-57.8)#70 |
| 10. | March Arb | 7.4% | 55.6%(-48.2)#10 | 64.8%(-57.4)#74 |
| 11. | Coleville | 9.5% | 55.6%(-46.1)#11 | 64.8%(-55.3)#91 |
| 12. | Industry | 10.0% | 55.6%(-45.6)#12 | 64.8%(-54.8)#97 |
| 13. | Cudahy | 11.9% | 55.6%(-43.7)#13 | 64.8%(-52.9)#113 |
| 14. | Cantua Creek | 13.0% | 55.6%(-42.6)#14 | 64.8%(-51.8)#122 |
| 15. | Greenview | 13.3% | 55.6%(-42.3)#15 | 64.8%(-51.5)#123 |
| 16. | Wawona | 13.5% | 55.6%(-42.1)#16 | 64.8%(-51.3)#124 |
| 17. | Westley | 14.0% | 55.6%(-41.6)#17 | 64.8%(-50.8)#127 |
| 18. | Pumpkin Center | 14.2% | 55.6%(-41.5)#18 | 64.8%(-50.6)#128 |
| 19. | University Of California-Santa Barbara | 17.1% | 55.6%(-38.5)#19 | 64.8%(-47.7)#164 |
| 20. | Hyampom | 17.9% | 55.6%(-37.7)#20 | 64.8%(-46.9)#175 |
| 21. | Contra Costa Centre | 18.4% | 55.6%(-37.2)#21 | 64.8%(-46.4)#182 |
| 22. | West Hollywood | 19.3% | 55.6%(-36.3)#22 | 64.8%(-45.5)#196 |
| 23. | Bell Gardens | 19.6% | 55.6%(-36.1)#23 | 64.8%(-45.2)#202 |
| 24. | East Bakersfield | 19.8% | 55.6%(-35.8)#24 | 64.8%(-45.0)#207 |
| 25. | El Nido | 20.0% | 55.6%(-35.6)#25 | 64.8%(-44.8)#210 |
| 26. | Cottonwood | 20.4% | 55.6%(-35.3)#26 | 64.8%(-44.4)#222 |
| 27. | Riverdale Park | 21.3% | 55.6%(-34.4)#27 | 64.8%(-43.6)#236 |
| 28. | Hardwick | 21.3% | 55.6%(-34.4)#28 | 64.8%(-43.5)#238 |
| 29. | Sand City | 21.5% | 55.6%(-34.1)#29 | 64.8%(-43.3)#243 |
| 30. | Kettleman City | 21.6% | 55.6%(-34.1)#30 | 64.8%(-43.3)#244 |
| 31. | Huron | 22.5% | 55.6%(-33.2)#31 | 64.8%(-42.4)#260 |
| 32. | Huntington Park | 24.3% | 55.6%(-31.4)#32 | 64.8%(-40.5)#295 |
| 33. | Strawberry Cdp Tuolumne County | 24.6% | 55.6%(-31.0)#33 | 64.8%(-40.2)#303 |
| 34. | Yolo | 24.7% | 55.6%(-30.9)#34 | 64.8%(-40.1)#306 |
| 35. | Keeler | 25.0% | 55.6%(-30.6)#35 | 64.8%(-39.8)#316 |
| 36. | Furnace Creek | 25.3% | 55.6%(-30.3)#36 | 64.8%(-39.5)#323 |
| 37. | Stanford | 25.6% | 55.6%(-30.0)#37 | 64.8%(-39.2)#331 |
| 38. | Lennox | 27.3% | 55.6%(-28.4)#38 | 64.8%(-37.5)#372 |
| 39. | Hawthorne | 27.8% | 55.6%(-27.9)#39 | 64.8%(-37.1)#391 |
| 40. | Westmont | 27.9% | 55.6%(-27.7)#40 | 64.8%(-36.9)#397 |
| 41. | Bell | 28.0% | 55.6%(-27.6)#41 | 64.8%(-36.8)#403 |
| 42. | Scotia | 28.6% | 55.6%(-27.1)#42 | 64.8%(-36.2)#415 |
| 43. | Dos Palos Y | 28.6% | 55.6%(-27.1)#43 | 64.8%(-36.2)#419 |
| 44. | Santa Monica | 28.9% | 55.6%(-26.7)#44 | 64.8%(-35.9)#436 |
| 45. | Port Costa | 29.2% | 55.6%(-26.4)#45 | 64.8%(-35.6)#445 |
| 46. | Casmalia | 29.4% | 55.6%(-26.2)#46 | 64.8%(-35.4)#451 |
| 47. | Jovista | 29.4% | 55.6%(-26.2)#47 | 64.8%(-35.4)#452 |
| 48. | Niland | 29.6% | 55.6%(-26.0)#48 | 64.8%(-35.2)#460 |
| 49. | Maywood | 30.2% | 55.6%(-25.5)#49 | 64.8%(-34.6)#483 |
| 50. | Midway City | 30.2% | 55.6%(-25.5)#50 | 64.8%(-34.6)#484 |
| 51. | Emeryville | 30.2% | 55.6%(-25.4)#51 | 64.8%(-34.6)#486 |
| 52. | Acampo | 30.3% | 55.6%(-25.3)#52 | 64.8%(-34.5)#493 |
| 53. | Sultana | 30.6% | 55.6%(-25.1)#53 | 64.8%(-34.3)#503 |
| 54. | Potomac Park | 30.6% | 55.6%(-25.0)#54 | 64.8%(-34.2)#505 |
| 55. | Di Giorgio | 30.7% | 55.6%(-24.9)#55 | 64.8%(-34.1)#507 |
| 56. | Weedpatch | 30.7% | 55.6%(-24.9)#56 | 64.8%(-34.1)#510 |
| 57. | Cherryland | 30.7% | 55.6%(-24.9)#57 | 64.8%(-34.1)#511 |
| 58. | Cartago | 30.8% | 55.6%(-24.9)#58 | 64.8%(-34.0)#518 |
| 59. | Imperial Beach | 31.0% | 55.6%(-24.7)#59 | 64.8%(-33.8)#528 |
| 60. | Airport | 31.0% | 55.6%(-24.6)#60 | 64.8%(-33.8)#533 |
| 61. | Aspen Springs | 31.3% | 55.6%(-24.3)#61 | 64.8%(-33.5)#544 |
| 62. | Avalon | 32.6% | 55.6%(-23.1)#62 | 64.8%(-32.3)#588 |
| 63. | Clio | 32.7% | 55.6%(-22.9)#63 | 64.8%(-32.1)#599 |
| 64. | Rutherford | 32.7% | 55.6%(-22.9)#64 | 64.8%(-32.1)#600 |
| 65. | Johnson Park | 32.7% | 55.6%(-22.9)#65 | 64.8%(-32.1)#601 |
| 66. | National City | 32.8% | 55.6%(-22.8)#66 | 64.8%(-32.0)#604 |
| 67. | Victor | 32.9% | 55.6%(-22.7)#67 | 64.8%(-31.9)#610 |
| 68. | Waterloo | 33.0% | 55.6%(-22.6)#68 | 64.8%(-31.8)#618 |
| 69. | Rouse | 33.0% | 55.6%(-22.6)#69 | 64.8%(-31.8)#619 |
| 70. | Alpaugh | 33.2% | 55.6%(-22.5)#70 | 64.8%(-31.7)#623 |
| 71. | Arcata | 33.2% | 55.6%(-22.4)#71 | 64.8%(-31.6)#626 |
| 72. | East Orosi | 33.3% | 55.6%(-22.3)#72 | 64.8%(-31.5)#632 |
| 73. | Macdoel | 33.3% | 55.6%(-22.3)#73 | 64.8%(-31.5)#637 |
| 74. | Twentynine Palms | 33.9% | 55.6%(-21.8)#74 | 64.8%(-31.0)#662 |
| 75. | Crows Landing | 33.9% | 55.6%(-21.7)#75 | 64.8%(-30.9)#663 |
| 76. | Leggett | 34.2% | 55.6%(-21.4)#76 | 64.8%(-30.6)#674 |
| 77. | Glendale | 34.2% | 55.6%(-21.4)#77 | 64.8%(-30.6)#675 |
| 78. | Yermo | 34.2% | 55.6%(-21.4)#78 | 64.8%(-30.6)#676 |
| 79. | Poplar Cotton Center | 34.2% | 55.6%(-21.4)#79 | 64.8%(-30.6)#678 |
| 80. | Lost Hills | 34.8% | 55.6%(-20.9)#80 | 64.8%(-30.0)#699 |
| 81. | East Los Angeles | 34.9% | 55.6%(-20.7)#81 | 64.8%(-29.9)#711 |
| 82. | Willits | 35.0% | 55.6%(-20.6)#82 | 64.8%(-29.8)#718 |
| 83. | Baker | 35.1% | 55.6%(-20.5)#83 | 64.8%(-29.7)#721 |
| 84. | South Taft | 35.3% | 55.6%(-20.4)#84 | 64.8%(-29.5)#735 |
| 85. | Lower Lake | 35.5% | 55.6%(-20.2)#85 | 64.8%(-29.4)#752 |
| 86. | London | 35.5% | 55.6%(-20.1)#86 | 64.8%(-29.3)#758 |
| 87. | Inglewood | 35.5% | 55.6%(-20.1)#87 | 64.8%(-29.3)#759 |
| 88. | Lindcove | 35.6% | 55.6%(-20.0)#88 | 64.8%(-29.2)#763 |
| 89. | Monterey | 35.6% | 55.6%(-20.0)#89 | 64.8%(-29.2)#764 |
| 90. | Teviston | 35.7% | 55.6%(-20.0)#90 | 64.8%(-29.2)#768 |
| 91. | West Goshen | 35.8% | 55.6%(-19.8)#91 | 64.8%(-29.0)#779 |
| 92. | Biola | 35.9% | 55.6%(-19.8)#92 | 64.8%(-28.9)#785 |
| 93. | Davenport | 36.1% | 55.6%(-19.5)#93 | 64.8%(-28.7)#799 |
| 94. | Farmington | 36.2% | 55.6%(-19.5)#94 | 64.8%(-28.6)#803 |
| 95. | Crescent City | 36.5% | 55.6%(-19.1)#95 | 64.8%(-28.3)#831 |
| 96. | Los Angeles | 36.6% | 55.6%(-19.0)#96 | 64.8%(-28.2)#838 |
| 97. | Keddie | 36.7% | 55.6%(-19.0)#97 | 64.8%(-28.1)#845 |
| 98. | Pajaro | 36.8% | 55.6%(-18.8)#98 | 64.8%(-28.0)#851 |
| 99. | Tipton | 36.8% | 55.6%(-18.8)#99 | 64.8%(-28.0)#852 |
| 100. | Ford City | 36.8% | 55.6%(-18.8)#100 | 64.8%(-28.0)#854 |
Common Questions
What are the Top 10 Cities with the Lowest Percentage of Owner-Occupied Units in California?
Top 10 Cities with the Lowest Percentage of Owner-Occupied Units in California are:
#1
0.79%
#2
1.1%
#3
1.4%
#4
1.5%
#5
2.0%
#6
3.9%
#7
4.4%
#8
7.0%
#9
7.4%
#10
9.5%
What city has the Lowest Percentage of Owner-Occupied Units in California?
Beale AFB has the Lowest Percentage of Owner-Occupied Units in California with 0.79%.
What is the Percentage of Owner-Occupied Units in the State of California?
Percentage of Owner-Occupied Units in California is 55.6%.
What is the Percentage of Owner-Occupied Units in the United States?
Percentage of Owner-Occupied Units in the United States is 64.8%.