Cities with the Highest Percentage of Trinidadian and Tobagonian Population in California
RELATED REPORTS & OPTIONS
Trinidadian and Tobagonian
California
Compare Cities
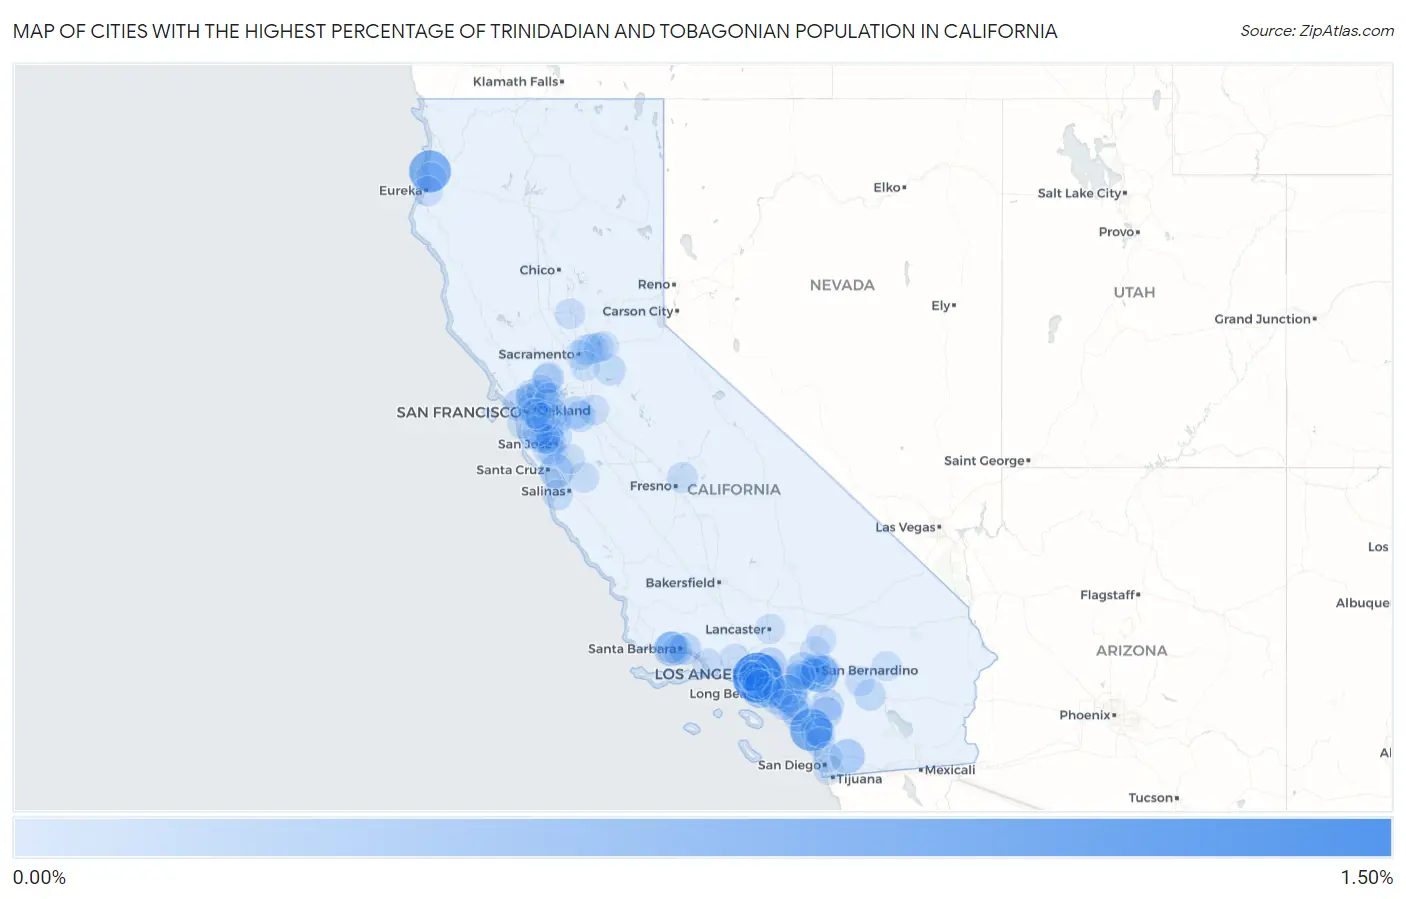
Map of Cities with the Highest Percentage of Trinidadian and Tobagonian Population in California
0.00%
1.50%
Cities with the Highest Percentage of Trinidadian and Tobagonian Population in California
| City | Trinidadian and Tobagonian | vs State | vs National | |
| 1. | View Park Windsor Hills | 1.16% | 0.017%(+1.14)#1 | 0.071%(+1.09)#100 |
| 2. | Camp Pendleton South | 0.73% | 0.017%(+0.715)#2 | 0.071%(+0.661)#185 |
| 3. | Westhaven Moonstone | 0.69% | 0.017%(+0.677)#3 | 0.071%(+0.623)#204 |
| 4. | Loma Linda | 0.46% | 0.017%(+0.441)#4 | 0.071%(+0.387)#312 |
| 5. | North Tustin | 0.43% | 0.017%(+0.413)#5 | 0.071%(+0.359)#334 |
| 6. | West Carson | 0.36% | 0.017%(+0.343)#6 | 0.071%(+0.289)#394 |
| 7. | Isla Vista | 0.29% | 0.017%(+0.268)#7 | 0.071%(+0.215)#475 |
| 8. | Alpine | 0.26% | 0.017%(+0.247)#8 | 0.071%(+0.193)#508 |
| 9. | Rio Del Mar | 0.24% | 0.017%(+0.227)#9 | 0.071%(+0.174)#537 |
| 10. | Ladera Heights | 0.24% | 0.017%(+0.222)#10 | 0.071%(+0.168)#552 |
| 11. | Rancho Cucamonga | 0.18% | 0.017%(+0.165)#11 | 0.071%(+0.111)#663 |
| 12. | Grand Terrace | 0.18% | 0.017%(+0.159)#12 | 0.071%(+0.105)#681 |
| 13. | Altadena | 0.16% | 0.017%(+0.147)#13 | 0.071%(+0.093)#715 |
| 14. | Martinez | 0.15% | 0.017%(+0.137)#14 | 0.071%(+0.083)#738 |
| 15. | Mountain House | 0.15% | 0.017%(+0.132)#15 | 0.071%(+0.078)#756 |
| 16. | French Valley | 0.14% | 0.017%(+0.124)#16 | 0.071%(+0.070)#774 |
| 17. | Oceanside | 0.14% | 0.017%(+0.124)#17 | 0.071%(+0.070)#777 |
| 18. | Montecito | 0.13% | 0.017%(+0.112)#18 | 0.071%(+0.058)#826 |
| 19. | Tamalpais Homestead Valley | 0.12% | 0.017%(+0.106)#19 | 0.071%(+0.052)#843 |
| 20. | Bloomington | 0.12% | 0.017%(+0.105)#20 | 0.071%(+0.051)#847 |
| 21. | San Carlos | 0.12% | 0.017%(+0.101)#21 | 0.071%(+0.047)#859 |
| 22. | Temecula | 0.12% | 0.017%(+0.099)#22 | 0.071%(+0.046)#869 |
| 23. | Redondo Beach | 0.11% | 0.017%(+0.094)#23 | 0.071%(+0.040)#887 |
| 24. | Inglewood | 0.10% | 0.017%(+0.088)#24 | 0.071%(+0.034)#916 |
| 25. | Goleta | 0.10% | 0.017%(+0.084)#25 | 0.071%(+0.030)#933 |
| 26. | Tracy | 0.096% | 0.017%(+0.079)#26 | 0.071%(+0.025)#966 |
| 27. | Palm Desert | 0.096% | 0.017%(+0.079)#27 | 0.071%(+0.025)#969 |
| 28. | Ione | 0.093% | 0.017%(+0.076)#28 | 0.071%(+0.023)#981 |
| 29. | Carmichael | 0.091% | 0.017%(+0.074)#29 | 0.071%(+0.020)#990 |
| 30. | West Hollywood | 0.091% | 0.017%(+0.074)#30 | 0.071%(+0.020)#992 |
| 31. | San Clemente | 0.087% | 0.017%(+0.070)#31 | 0.071%(+0.017)#1,003 |
| 32. | Milpitas | 0.081% | 0.017%(+0.064)#32 | 0.071%(+0.010)#1,034 |
| 33. | San Ramon | 0.080% | 0.017%(+0.063)#33 | 0.071%(+0.009)#1,041 |
| 34. | Huntington Beach | 0.080% | 0.017%(+0.063)#34 | 0.071%(+0.009)#1,044 |
| 35. | Suisun City | 0.078% | 0.017%(+0.062)#35 | 0.071%(+0.008)#1,051 |
| 36. | Pinole | 0.074% | 0.017%(+0.057)#36 | 0.071%(+0.003)#1,075 |
| 37. | Emeryville | 0.062% | 0.017%(+0.045)#37 | 0.071%(-0.008)#1,134 |
| 38. | Culver City | 0.062% | 0.017%(+0.045)#38 | 0.071%(-0.009)#1,138 |
| 39. | Eastvale | 0.060% | 0.017%(+0.044)#39 | 0.071%(-0.010)#1,146 |
| 40. | Fair Oaks | 0.058% | 0.017%(+0.041)#40 | 0.071%(-0.013)#1,158 |
| 41. | Pleasanton | 0.056% | 0.017%(+0.039)#41 | 0.071%(-0.015)#1,175 |
| 42. | Saratoga | 0.055% | 0.017%(+0.038)#42 | 0.071%(-0.015)#1,180 |
| 43. | Clovis | 0.054% | 0.017%(+0.037)#43 | 0.071%(-0.017)#1,189 |
| 44. | Chino | 0.054% | 0.017%(+0.037)#44 | 0.071%(-0.017)#1,190 |
| 45. | Spring Valley Cdp San Diego County | 0.052% | 0.017%(+0.036)#45 | 0.071%(-0.018)#1,198 |
| 46. | South Pasadena | 0.049% | 0.017%(+0.032)#46 | 0.071%(-0.022)#1,223 |
| 47. | Mission Viejo | 0.048% | 0.017%(+0.031)#47 | 0.071%(-0.022)#1,228 |
| 48. | Bellflower | 0.047% | 0.017%(+0.030)#48 | 0.071%(-0.023)#1,240 |
| 49. | Long Beach | 0.046% | 0.017%(+0.029)#49 | 0.071%(-0.025)#1,248 |
| 50. | Garden Grove | 0.046% | 0.017%(+0.029)#50 | 0.071%(-0.025)#1,249 |
| 51. | Hollister | 0.045% | 0.017%(+0.028)#51 | 0.071%(-0.026)#1,258 |
| 52. | San Pablo | 0.044% | 0.017%(+0.027)#52 | 0.071%(-0.027)#1,268 |
| 53. | Monterey | 0.043% | 0.017%(+0.027)#53 | 0.071%(-0.027)#1,269 |
| 54. | Orange | 0.043% | 0.017%(+0.026)#54 | 0.071%(-0.027)#1,272 |
| 55. | Yuba City | 0.042% | 0.017%(+0.025)#55 | 0.071%(-0.029)#1,284 |
| 56. | Mckinleyville | 0.041% | 0.017%(+0.025)#56 | 0.071%(-0.029)#1,286 |
| 57. | Sunnyvale | 0.041% | 0.017%(+0.024)#57 | 0.071%(-0.030)#1,292 |
| 58. | Santa Barbara | 0.041% | 0.017%(+0.024)#58 | 0.071%(-0.030)#1,293 |
| 59. | Stanford | 0.041% | 0.017%(+0.024)#59 | 0.071%(-0.030)#1,294 |
| 60. | Santa Monica | 0.040% | 0.017%(+0.023)#60 | 0.071%(-0.031)#1,297 |
| 61. | Manteca | 0.039% | 0.017%(+0.023)#61 | 0.071%(-0.031)#1,300 |
| 62. | Encinitas | 0.039% | 0.017%(+0.022)#62 | 0.071%(-0.032)#1,305 |
| 63. | Fremont | 0.034% | 0.017%(+0.017)#63 | 0.071%(-0.037)#1,343 |
| 64. | Oxnard | 0.032% | 0.017%(+0.015)#64 | 0.071%(-0.039)#1,363 |
| 65. | Pacifica | 0.032% | 0.017%(+0.015)#65 | 0.071%(-0.039)#1,366 |
| 66. | Santa Clara | 0.031% | 0.017%(+0.014)#66 | 0.071%(-0.039)#1,369 |
| 67. | Laguna Niguel | 0.031% | 0.017%(+0.014)#67 | 0.071%(-0.040)#1,370 |
| 68. | Los Gatos | 0.030% | 0.017%(+0.013)#68 | 0.071%(-0.040)#1,379 |
| 69. | Eureka | 0.030% | 0.017%(+0.013)#69 | 0.071%(-0.040)#1,381 |
| 70. | Los Angeles | 0.030% | 0.017%(+0.013)#70 | 0.071%(-0.041)#1,382 |
| 71. | Benicia | 0.030% | 0.017%(+0.013)#71 | 0.071%(-0.041)#1,391 |
| 72. | Simi Valley | 0.029% | 0.017%(+0.013)#72 | 0.071%(-0.041)#1,394 |
| 73. | Vista | 0.028% | 0.017%(+0.012)#73 | 0.071%(-0.042)#1,399 |
| 74. | Redwood City | 0.026% | 0.017%(+0.010)#74 | 0.071%(-0.044)#1,414 |
| 75. | Fairfield | 0.026% | 0.017%(+0.009)#75 | 0.071%(-0.045)#1,418 |
| 76. | Desert Hot Springs | 0.025% | 0.017%(+0.008)#76 | 0.071%(-0.046)#1,432 |
| 77. | Alameda | 0.023% | 0.017%(+0.006)#77 | 0.071%(-0.047)#1,451 |
| 78. | Gardena | 0.023% | 0.017%(+0.006)#78 | 0.071%(-0.047)#1,452 |
| 79. | Hesperia | 0.022% | 0.017%(+0.005)#79 | 0.071%(-0.049)#1,461 |
| 80. | Twentynine Palms | 0.021% | 0.017%(+0.005)#80 | 0.071%(-0.049)#1,468 |
| 81. | Highland | 0.021% | 0.017%(+0.004)#81 | 0.071%(-0.050)#1,470 |
| 82. | Lancaster | 0.020% | 0.017%(+0.004)#82 | 0.071%(-0.050)#1,479 |
| 83. | El Dorado Hills | 0.020% | 0.017%(+0.004)#83 | 0.071%(-0.050)#1,480 |
| 84. | San Bernardino | 0.020% | 0.017%(+0.003)#84 | 0.071%(-0.051)#1,483 |
| 85. | Ontario | 0.019% | 0.017%(+0.002)#85 | 0.071%(-0.051)#1,489 |
| 86. | Newport Beach | 0.019% | 0.017%(+0.002)#86 | 0.071%(-0.052)#1,496 |
| 87. | Walnut Creek | 0.019% | 0.017%(+0.002)#87 | 0.071%(-0.052)#1,498 |
| 88. | Sacramento | 0.019% | 0.017%(+0.002)#88 | 0.071%(-0.052)#1,499 |
| 89. | Folsom | 0.018% | 0.017%(+0.002)#89 | 0.071%(-0.052)#1,500 |
| 90. | National City | 0.018% | 0.017%(+0.001)#90 | 0.071%(-0.053)#1,510 |
| 91. | Hawthorne | 0.017% | 0.017%(+0.000)#91 | 0.071%(-0.053)#1,515 |
| 92. | Mountain View | 0.017% | 0.017%(+0.000)#92 | 0.071%(-0.054)#1,518 |
| 93. | Castro Valley | 0.017% | 0.017%(=0.000)#93 | 0.071%(-0.054)#1,520 |
| 94. | Concord | 0.017% | 0.017%(-0.000)#94 | 0.071%(-0.054)#1,521 |
| 95. | Oakland | 0.017% | 0.017%(-0.000)#95 | 0.071%(-0.054)#1,522 |
| 96. | Apple Valley | 0.016% | 0.017%(-0.001)#96 | 0.071%(-0.055)#1,528 |
| 97. | Morgan Hill | 0.015% | 0.017%(-0.001)#97 | 0.071%(-0.055)#1,532 |
| 98. | Elk Grove | 0.015% | 0.017%(-0.002)#98 | 0.071%(-0.056)#1,536 |
| 99. | San Leandro | 0.014% | 0.017%(-0.002)#99 | 0.071%(-0.056)#1,545 |
| 100. | San Diego | 0.014% | 0.017%(-0.002)#100 | 0.071%(-0.056)#1,546 |
Common Questions
What are the Top 10 Cities with the Highest Percentage of Trinidadian and Tobagonian Population in California?
Top 10 Cities with the Highest Percentage of Trinidadian and Tobagonian Population in California are:
#1
1.16%
#2
0.73%
#3
0.69%
#4
0.46%
#5
0.43%
#6
0.36%
#7
0.29%
#8
0.26%
#9
0.24%
#10
0.24%
What city has the Highest Percentage of Trinidadian and Tobagonian Population in California?
View Park Windsor Hills has the Highest Percentage of Trinidadian and Tobagonian Population in California with 1.16%.
What is the Percentage of Trinidadian and Tobagonian Population in the State of California?
Percentage of Trinidadian and Tobagonian Population in California is 0.017%.
What is the Percentage of Trinidadian and Tobagonian Population in the United States?
Percentage of Trinidadian and Tobagonian Population in the United States is 0.071%.