Cities with the Highest Percentage of Immigrants from Somalia in California
RELATED REPORTS & OPTIONS
Somalia
California
Compare Cities
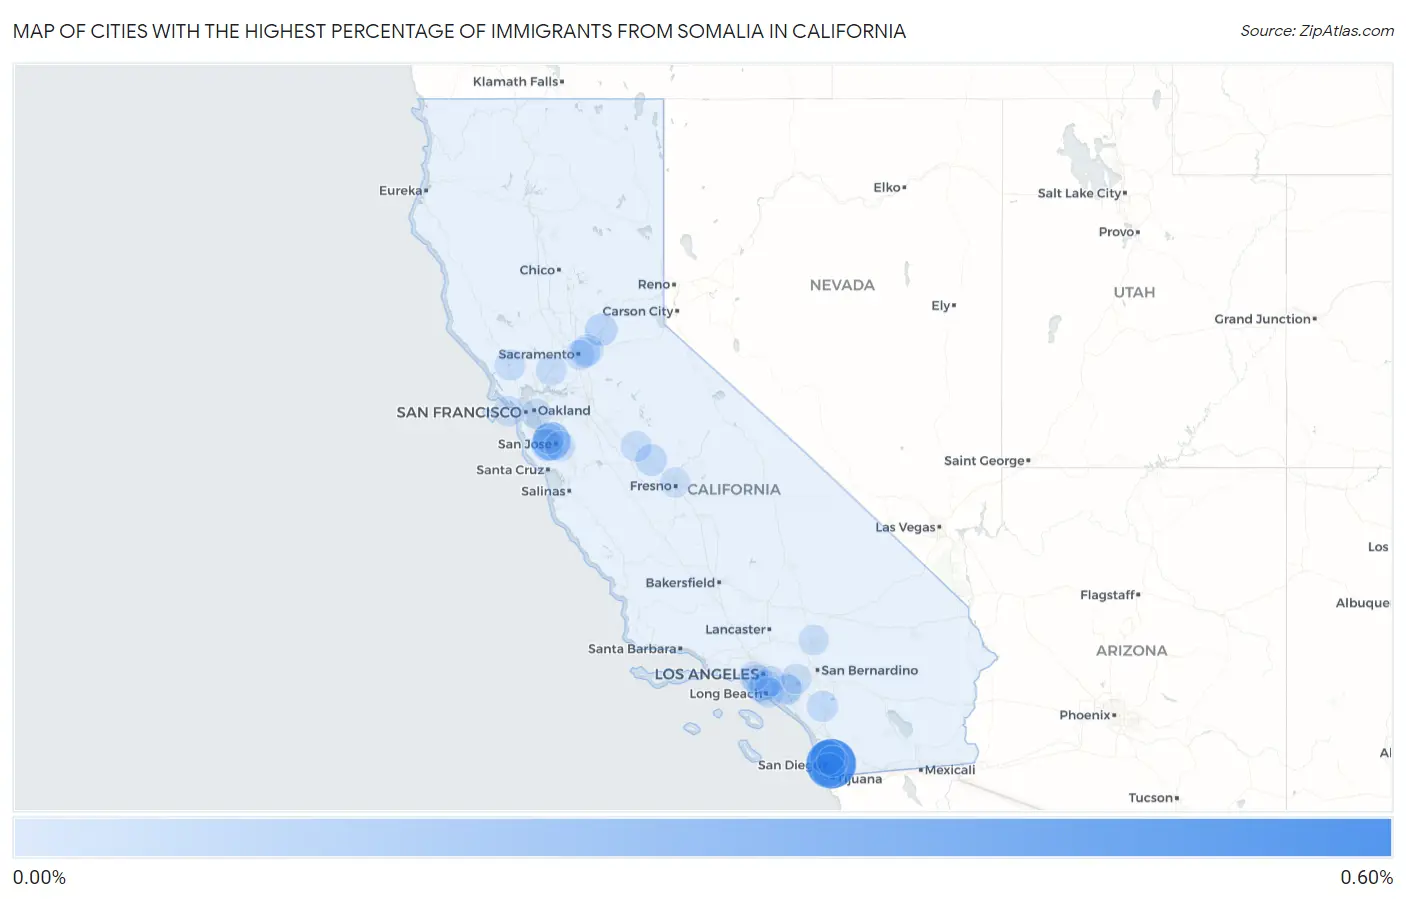
Map of Cities with the Highest Percentage of Immigrants from Somalia in California
0.00%
0.60%
Cities with the Highest Percentage of Immigrants from Somalia in California
| City | Somalia | vs State | vs National | |
| 1. | Lemon Grove | 0.56% | 0.0072%(+0.557)#14 | 0.030%(+0.534)#563 |
| 2. | Santa Clara | 0.23% | 0.0072%(+0.225)#34 | 0.030%(+0.202)#911 |
| 3. | San Diego | 0.12% | 0.0072%(+0.117)#43 | 0.030%(+0.094)#1,040 |
| 4. | National City | 0.098% | 0.0072%(+0.090)#59 | 0.030%(+0.068)#1,155 |
| 5. | Spring Valley Cdp San Diego County | 0.092% | 0.0072%(+0.085)#60 | 0.030%(+0.063)#1,156 |
| 6. | Cupertino | 0.069% | 0.0072%(+0.061)#61 | 0.030%(+0.039)#1,157 |
| 7. | Auburn | 0.065% | 0.0072%(+0.058)#258 | 0.030%(+0.036)#2,783 |
| 8. | Chowchilla | 0.043% | 0.0072%(+0.035)#279 | 0.030%(+0.013)#2,913 |
| 9. | Carmichael | 0.041% | 0.0072%(+0.034)#280 | 0.030%(+0.011)#2,914 |
| 10. | Murrieta | 0.030% | 0.0072%(+0.023)#318 | 0.030%(+0.001)#3,177 |
| 11. | La Mesa | 0.025% | 0.0072%(+0.017)#319 | 0.030%(-0.005)#3,178 |
| 12. | Santa Rosa | 0.023% | 0.0072%(+0.016)#320 | 0.030%(-0.007)#3,179 |
| 13. | Merced | 0.021% | 0.0072%(+0.013)#321 | 0.030%(-0.009)#3,185 |
| 14. | Inglewood | 0.017% | 0.0072%(+0.010)#322 | 0.030%(-0.013)#3,186 |
| 15. | Sunnyvale | 0.016% | 0.0072%(+0.009)#323 | 0.030%(-0.014)#3,187 |
| 16. | Vacaville | 0.016% | 0.0072%(+0.009)#326 | 0.030%(-0.014)#3,214 |
| 17. | Orange | 0.012% | 0.0072%(+0.004)#327 | 0.030%(-0.018)#3,215 |
| 18. | Arden Arcade | 0.011% | 0.0072%(+0.004)#328 | 0.030%(-0.018)#3,216 |
| 19. | Carson | 0.0095% | 0.0072%(+0.002)#329 | 0.030%(-0.020)#3,217 |
| 20. | San Francisco | 0.0094% | 0.0072%(+0.002)#330 | 0.030%(-0.020)#3,218 |
| 21. | San Jose | 0.0092% | 0.0072%(+0.002)#331 | 0.030%(-0.021)#3,219 |
| 22. | Anaheim | 0.0075% | 0.0072%(+0.000)#332 | 0.030%(-0.022)#3,220 |
| 23. | Compton | 0.0074% | 0.0072%(+0.000)#359 | 0.030%(-0.022)#3,442 |
| 24. | Victorville | 0.0060% | 0.0072%(-0.001)#360 | 0.030%(-0.024)#3,443 |
| 25. | Downey | 0.0053% | 0.0072%(-0.002)#361 | 0.030%(-0.024)#3,444 |
| 26. | Long Beach | 0.0052% | 0.0072%(-0.002)#362 | 0.030%(-0.025)#3,445 |
| 27. | Chino | 0.0044% | 0.0072%(-0.003)#363 | 0.030%(-0.025)#3,446 |
| 28. | Sacramento | 0.0015% | 0.0072%(-0.006)#364 | 0.030%(-0.028)#3,447 |
| 29. | Oakland | 0.0014% | 0.0072%(-0.006)#365 | 0.030%(-0.028)#3,448 |
| 30. | Fresno | 0.00074% | 0.0072%(-0.006)#366 | 0.030%(-0.029)#3,449 |
| 31. | Los Angeles | 0.00031% | 0.0072%(-0.007)#367 | 0.030%(-0.029)#3,450 |
Common Questions
What are the Top 10 Cities with the Highest Percentage of Immigrants from Somalia in California?
Top 10 Cities with the Highest Percentage of Immigrants from Somalia in California are:
#1
0.56%
#2
0.23%
#3
0.12%
#4
0.098%
#5
0.069%
#6
0.065%
#7
0.043%
#8
0.041%
#9
0.030%
#10
0.025%
What city has the Highest Percentage of Immigrants from Somalia in California?
Lemon Grove has the Highest Percentage of Immigrants from Somalia in California with 0.56%.
What is the Percentage of Immigrants from Somalia in the State of California?
Percentage of Immigrants from Somalia in California is 0.0072%.
What is the Percentage of Immigrants from Somalia in the United States?
Percentage of Immigrants from Somalia in the United States is 0.030%.