Lewiston, CA Map & Demographics
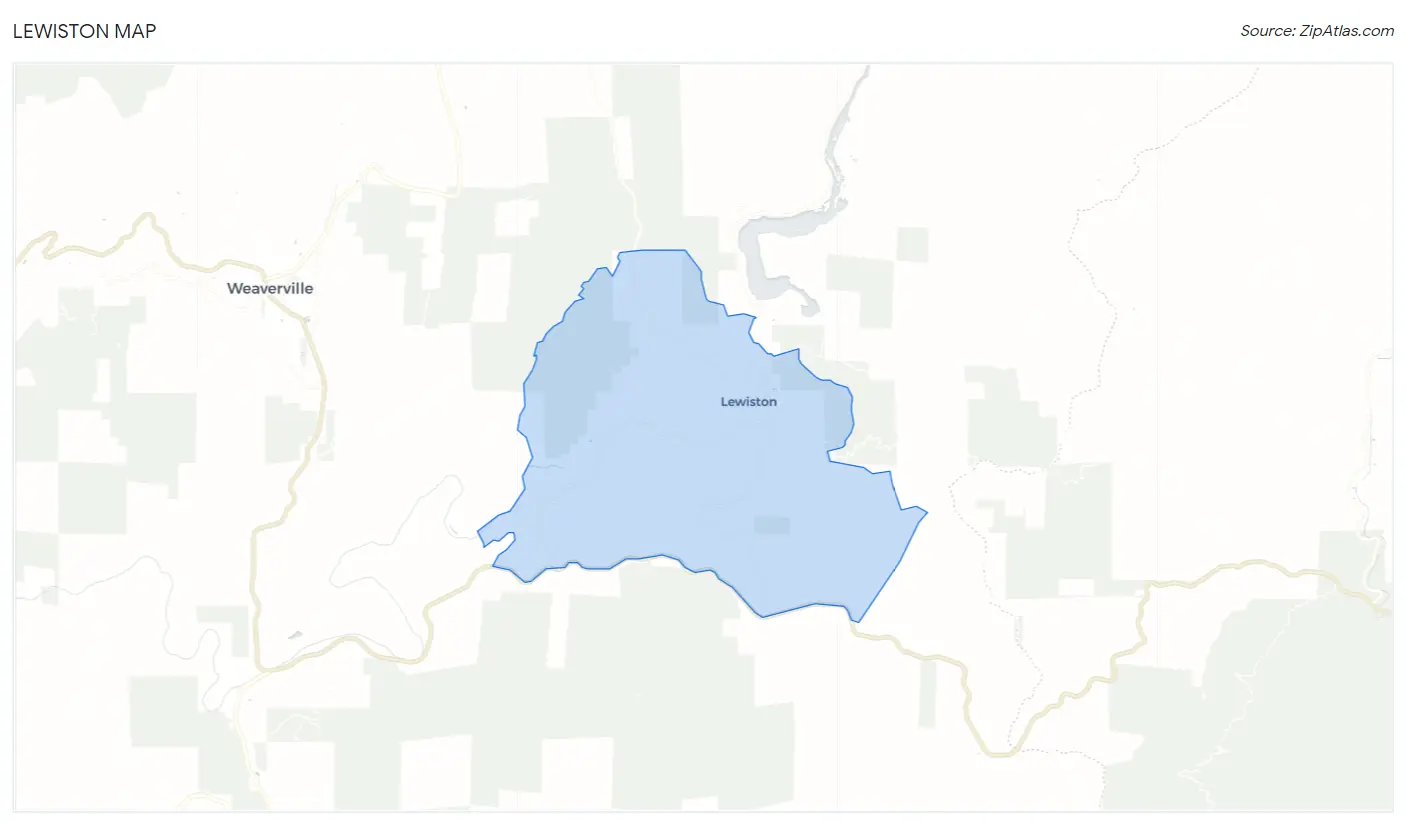
Lewiston Map
Lewiston Overview
$24,361
PER CAPITA INCOME
$101,000
AVG FAMILY INCOME
$57,212
AVG HOUSEHOLD INCOME
0.42
INEQUALITY / GINI INDEX
2,218
TOTAL POPULATION
984
MALE POPULATION
1,234
FEMALE POPULATION
79.74
MALES / 100 FEMALES
125.41
FEMALES / 100 MALES
38.6
MEDIAN AGE
5.6
AVG FAMILY SIZE
4.6
AVG HOUSEHOLD SIZE
862
LABOR FORCE [ PEOPLE ]
52.3%
PERCENT IN LABOR FORCE
3.9%
UNEMPLOYMENT RATE
Lewiston Zip Codes
Lewiston Area Codes
Income in Lewiston
Income Overview in Lewiston
Per Capita Income in Lewiston is $24,361, while median incomes of families and households are $101,000 and $57,212 respectively.
| Characteristic | Number | Measure |
| Per Capita Income | 2,218 | $24,361 |
| Median Family Income | 338 | $101,000 |
| Mean Family Income | 338 | $95,525 |
| Median Household Income | 484 | $57,212 |
| Mean Household Income | 484 | $83,464 |
| Income Deficit | 338 | $0 |
| Wage / Income Gap (%) | 2,218 | 0.00% |
| Wage / Income Gap ($) | 2,218 | 100.00¢ per $1 |
| Gini / Inequality Index | 2,218 | 0.42 |
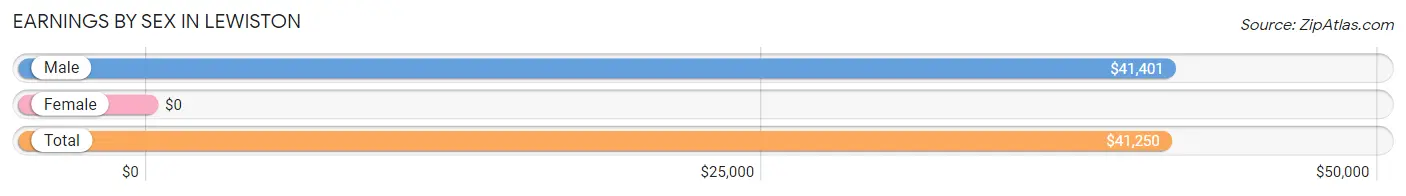
Earnings by Sex in Lewiston
| Sex | Number | Average Earnings |
| Male | 561 (63.6%) | $41,401 |
| Female | 321 (36.4%) | $0 |
| Total | 882 (100.0%) | $41,250 |
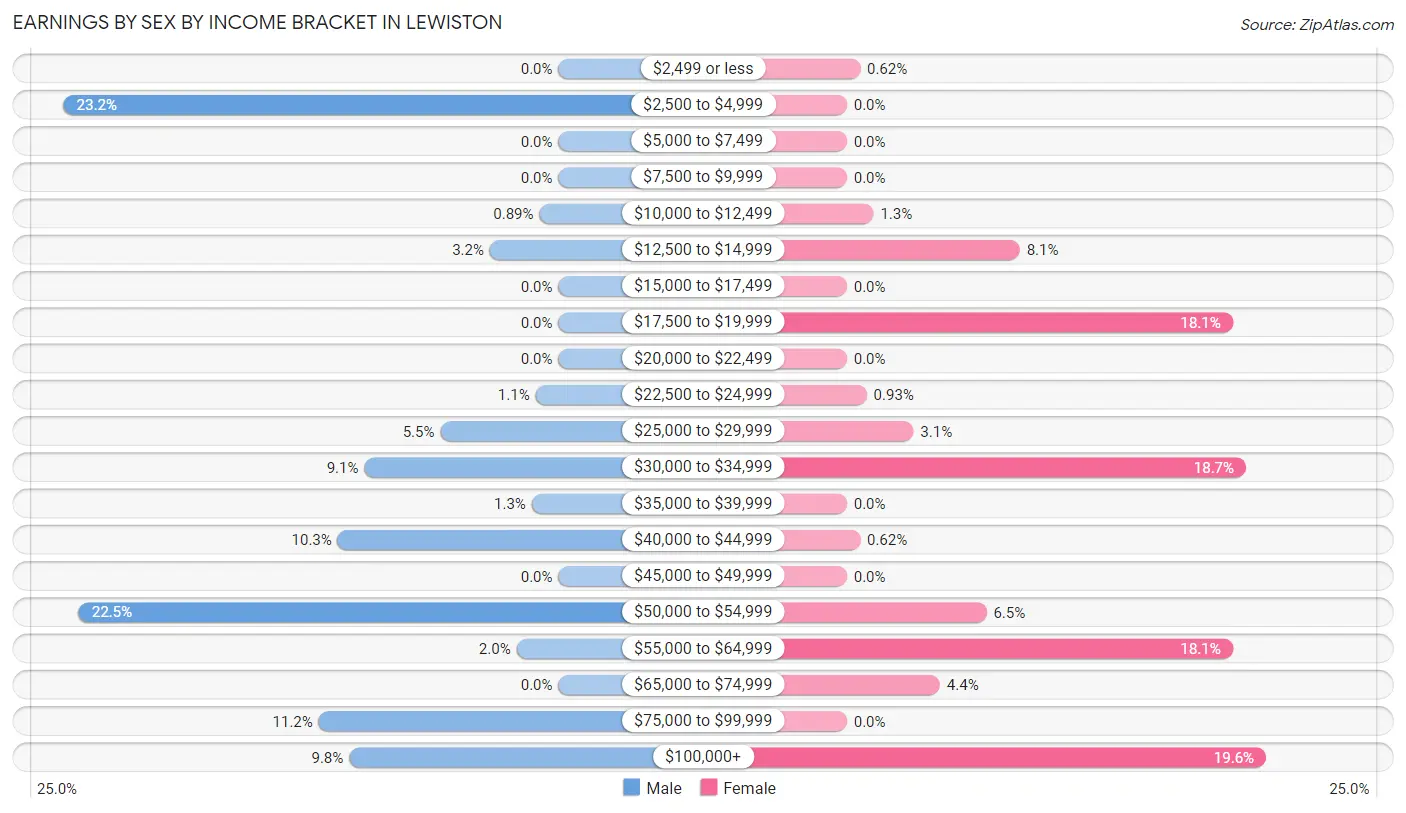
Earnings by Sex by Income Bracket in Lewiston
The most common earnings brackets in Lewiston are $2,500 to $4,999 for men (130 | 23.2%) and $100,000+ for women (63 | 19.6%).
| Income | Male | Female |
| $2,499 or less | 0 (0.0%) | 2 (0.6%) |
| $2,500 to $4,999 | 130 (23.2%) | 0 (0.0%) |
| $5,000 to $7,499 | 0 (0.0%) | 0 (0.0%) |
| $7,500 to $9,999 | 0 (0.0%) | 0 (0.0%) |
| $10,000 to $12,499 | 5 (0.9%) | 4 (1.3%) |
| $12,500 to $14,999 | 18 (3.2%) | 26 (8.1%) |
| $15,000 to $17,499 | 0 (0.0%) | 0 (0.0%) |
| $17,500 to $19,999 | 0 (0.0%) | 58 (18.1%) |
| $20,000 to $22,499 | 0 (0.0%) | 0 (0.0%) |
| $22,500 to $24,999 | 6 (1.1%) | 3 (0.9%) |
| $25,000 to $29,999 | 31 (5.5%) | 10 (3.1%) |
| $30,000 to $34,999 | 51 (9.1%) | 60 (18.7%) |
| $35,000 to $39,999 | 7 (1.3%) | 0 (0.0%) |
| $40,000 to $44,999 | 58 (10.3%) | 2 (0.6%) |
| $45,000 to $49,999 | 0 (0.0%) | 0 (0.0%) |
| $50,000 to $54,999 | 126 (22.5%) | 21 (6.5%) |
| $55,000 to $64,999 | 11 (2.0%) | 58 (18.1%) |
| $65,000 to $74,999 | 0 (0.0%) | 14 (4.4%) |
| $75,000 to $99,999 | 63 (11.2%) | 0 (0.0%) |
| $100,000+ | 55 (9.8%) | 63 (19.6%) |
| Total | 561 (100.0%) | 321 (100.0%) |
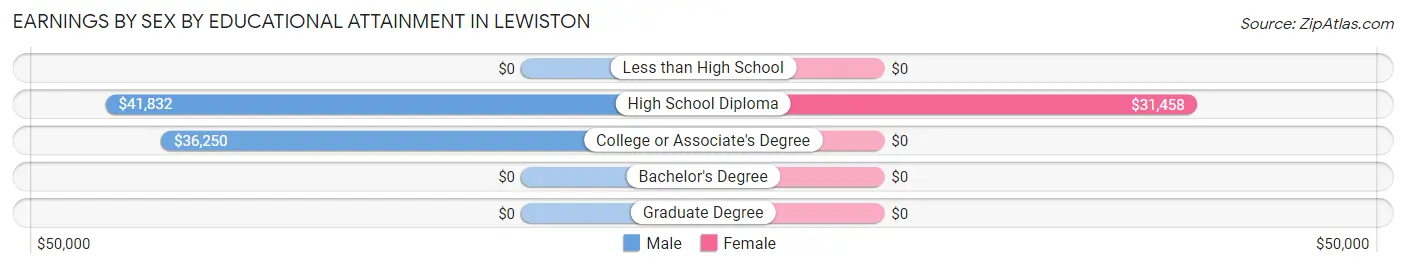
Earnings by Sex by Educational Attainment in Lewiston
| Educational Attainment | Male Income | Female Income |
| Less than High School | - | - |
| High School Diploma | $41,832 | $31,458 |
| College or Associate's Degree | $36,250 | $0 |
| Bachelor's Degree | - | - |
| Graduate Degree | - | - |
| Total | $41,401 | $0 |
Family Income in Lewiston
Family Income Brackets in Lewiston
According to the Lewiston family income data, there are 142 families falling into the $100,000 to $149,999 income range, which is the most common income bracket and makes up 42.0% of all families. Conversely, the less than $10,000 income bracket is the least frequent group with only 2 families (0.6%) belonging to this category.
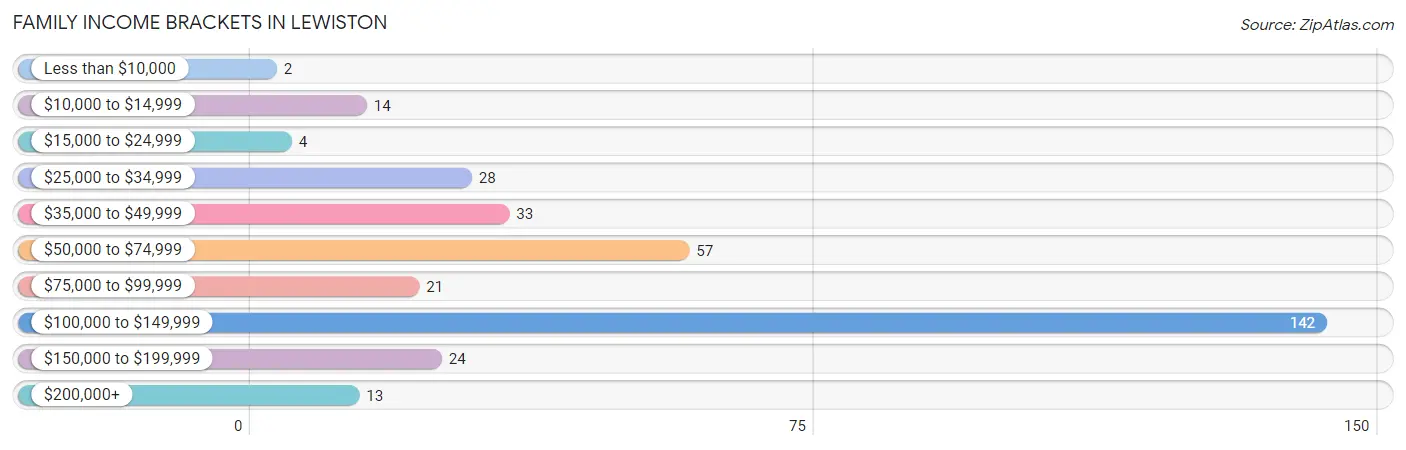
| Income Bracket | # Families | % Families |
| Less than $10,000 | 2 | 0.6% |
| $10,000 to $14,999 | 14 | 4.1% |
| $15,000 to $24,999 | 4 | 1.2% |
| $25,000 to $34,999 | 28 | 8.3% |
| $35,000 to $49,999 | 33 | 9.8% |
| $50,000 to $74,999 | 57 | 16.9% |
| $75,000 to $99,999 | 21 | 6.2% |
| $100,000 to $149,999 | 142 | 42.0% |
| $150,000 to $199,999 | 24 | 7.1% |
| $200,000+ | 13 | 3.8% |
Family Income by Famaliy Size in Lewiston
5-person families (102 | 30.2%) account for the highest median family income in Lewiston with $123,804 per family, while 2-person families (97 | 28.7%) have the highest median income of $39,312 per family member.
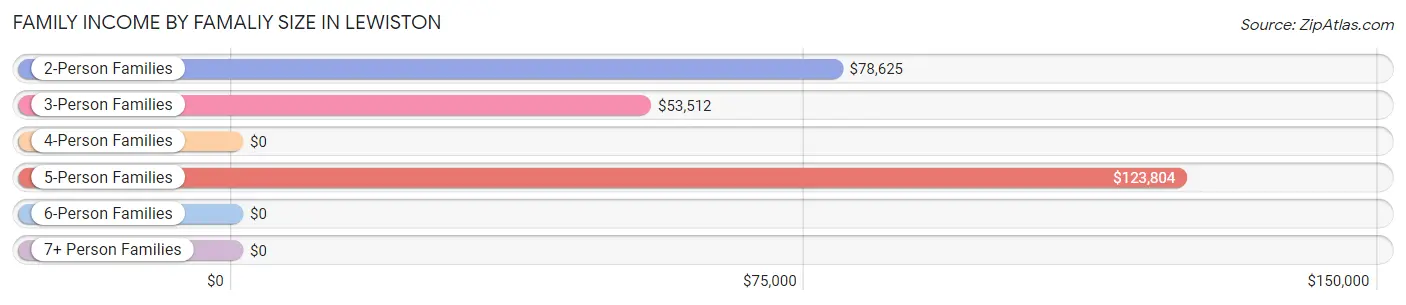
| Income Bracket | # Families | Median Income |
| 2-Person Families | 97 (28.7%) | $78,625 |
| 3-Person Families | 93 (27.5%) | $53,512 |
| 4-Person Families | 38 (11.2%) | $0 |
| 5-Person Families | 102 (30.2%) | $123,804 |
| 6-Person Families | 0 (0.0%) | $0 |
| 7+ Person Families | 8 (2.4%) | $0 |
| Total | 338 (100.0%) | $101,000 |
Family Income by Number of Earners in Lewiston
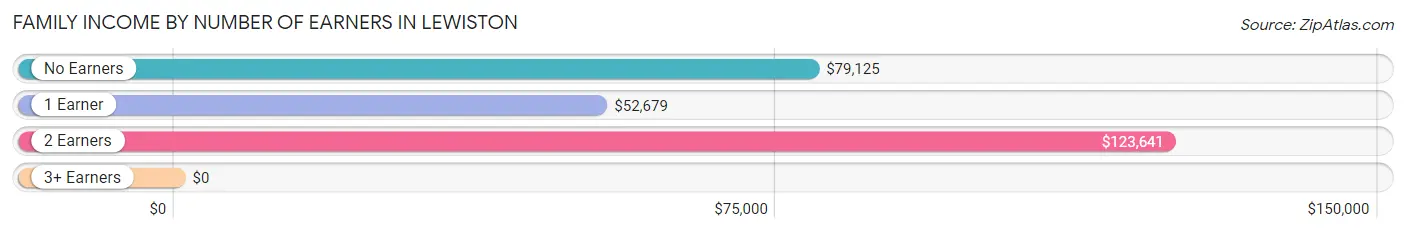
| Number of Earners | # Families | Median Income |
| No Earners | 29 (8.6%) | $79,125 |
| 1 Earner | 135 (39.9%) | $52,679 |
| 2 Earners | 174 (51.5%) | $123,641 |
| 3+ Earners | 0 (0.0%) | $0 |
| Total | 338 (100.0%) | $101,000 |
Household Income in Lewiston
Household Income Brackets in Lewiston
With 125 households falling in the category, the $150,000 to $199,999 income range is the most frequent in Lewiston, accounting for 25.8% of all households. In contrast, only 13 households (2.7%) fall into the $200,000+ income bracket, making it the least populous group.
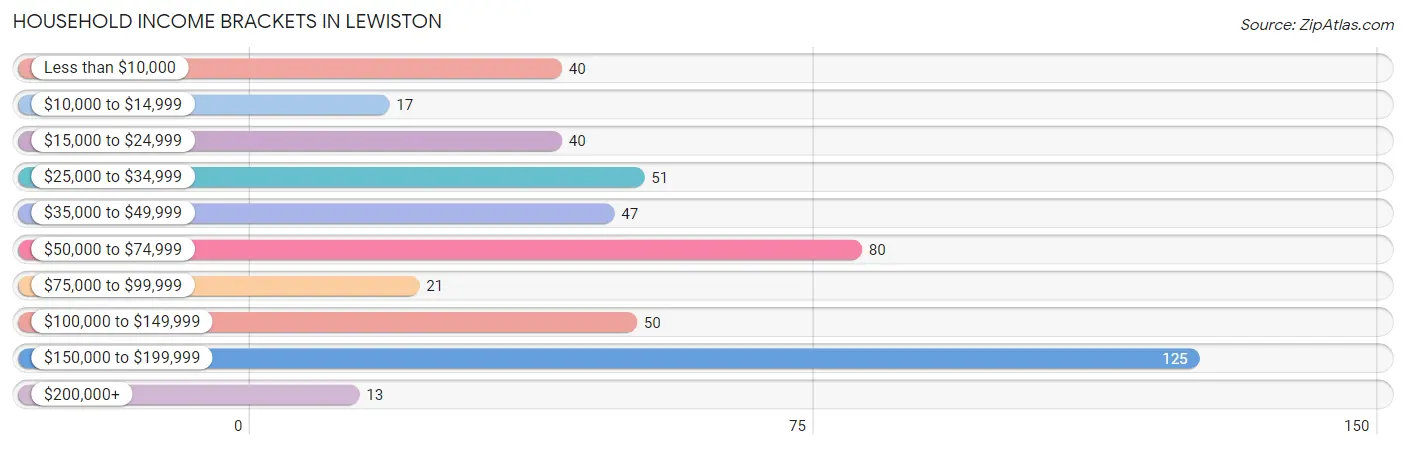
| Income Bracket | # Households | % Households |
| Less than $10,000 | 40 | 8.3% |
| $10,000 to $14,999 | 17 | 3.5% |
| $15,000 to $24,999 | 40 | 8.3% |
| $25,000 to $34,999 | 51 | 10.5% |
| $35,000 to $49,999 | 47 | 9.7% |
| $50,000 to $74,999 | 80 | 16.5% |
| $75,000 to $99,999 | 21 | 4.3% |
| $100,000 to $149,999 | 50 | 10.3% |
| $150,000 to $199,999 | 125 | 25.8% |
| $200,000+ | 13 | 2.7% |
Household Income by Householder Age in Lewiston
The median household income in Lewiston is $57,212, with the highest median household income of $155,681 found in the 45 to 64 years age bracket for the primary householder. A total of 209 households (43.2%) fall into this category. Meanwhile, the 15 to 24 years age bracket for the primary householder has the lowest median household income of $0, with 6 households (1.2%) in this group.
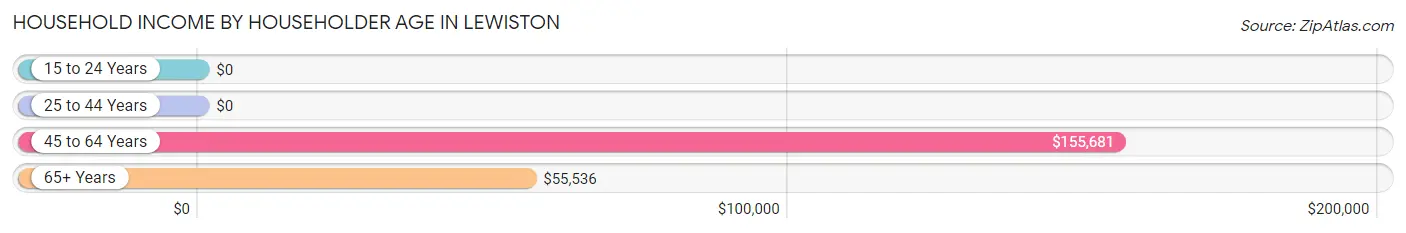
| Income Bracket | # Households | Median Income |
| 15 to 24 Years | 6 (1.2%) | $0 |
| 25 to 44 Years | 149 (30.8%) | $0 |
| 45 to 64 Years | 209 (43.2%) | $155,681 |
| 65+ Years | 120 (24.8%) | $55,536 |
| Total | 484 (100.0%) | $57,212 |
Poverty in Lewiston
Income Below Poverty by Sex and Age in Lewiston
With 12.9% poverty level for males and 17.9% for females among the residents of Lewiston, 12 to 14 year old males and 5 year old females are the most vulnerable to poverty, with 15 males (100.0%) and 21 females (100.0%) in their respective age groups living below the poverty level.
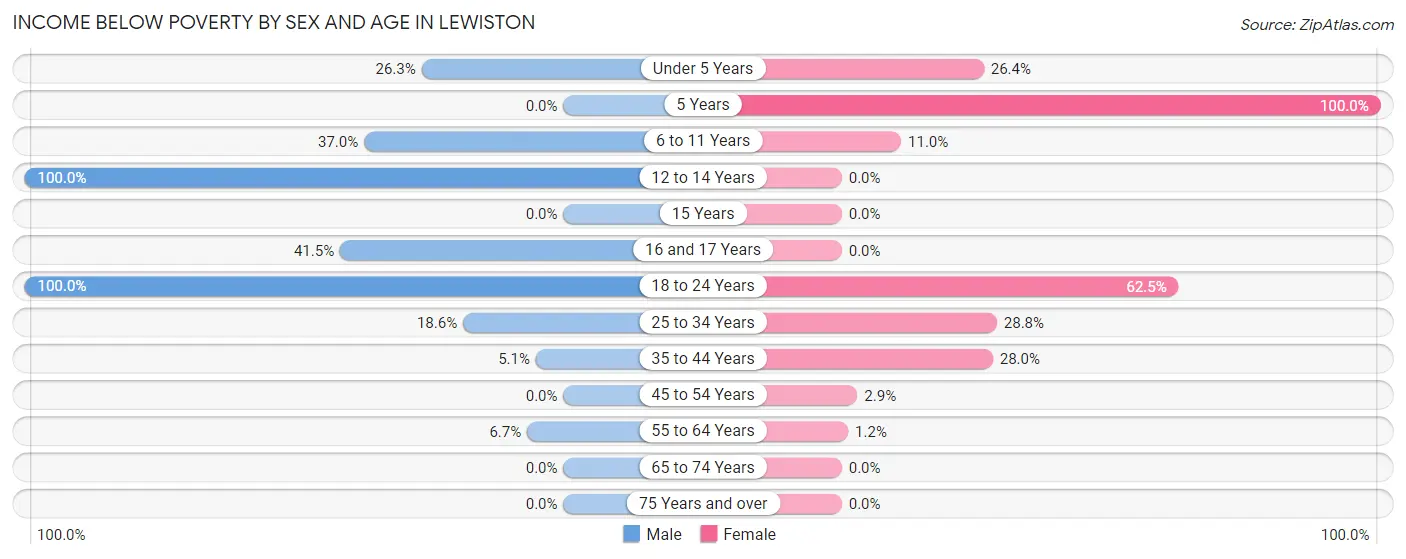
| Age Bracket | Male | Female |
| Under 5 Years | 20 (26.3%) | 39 (26.4%) |
| 5 Years | 0 (0.0%) | 21 (100.0%) |
| 6 to 11 Years | 27 (37.0%) | 12 (11.0%) |
| 12 to 14 Years | 15 (100.0%) | 0 (0.0%) |
| 15 Years | 0 (0.0%) | 0 (0.0%) |
| 16 and 17 Years | 17 (41.5%) | 0 (0.0%) |
| 18 to 24 Years | 3 (100.0%) | 50 (62.5%) |
| 25 to 34 Years | 30 (18.6%) | 40 (28.8%) |
| 35 to 44 Years | 9 (5.1%) | 51 (28.0%) |
| 45 to 54 Years | 0 (0.0%) | 6 (2.9%) |
| 55 to 64 Years | 6 (6.7%) | 2 (1.2%) |
| 65 to 74 Years | 0 (0.0%) | 0 (0.0%) |
| 75 Years and over | 0 (0.0%) | 0 (0.0%) |
| Total | 127 (12.9%) | 221 (17.9%) |
Income Above Poverty by Sex and Age in Lewiston
According to the poverty statistics in Lewiston, males aged 5 years and females aged 12 to 14 years are the age groups that are most secure financially, with 100.0% of males and 100.0% of females in these age groups living above the poverty line.
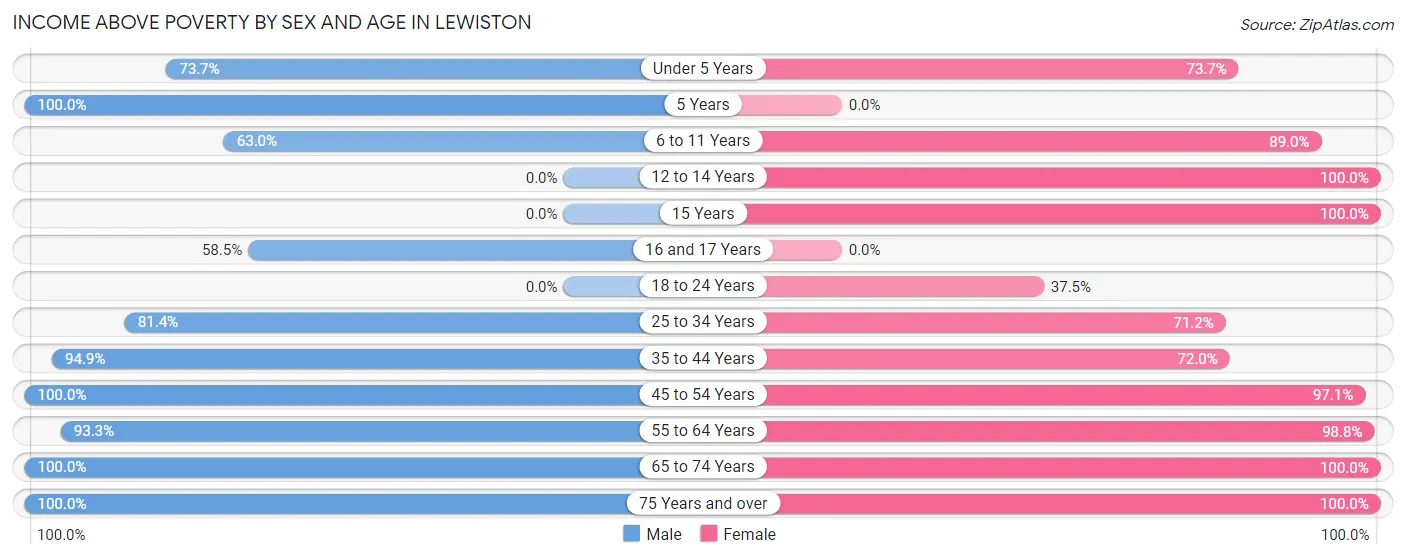
| Age Bracket | Male | Female |
| Under 5 Years | 56 (73.7%) | 109 (73.7%) |
| 5 Years | 47 (100.0%) | 0 (0.0%) |
| 6 to 11 Years | 46 (63.0%) | 97 (89.0%) |
| 12 to 14 Years | 0 (0.0%) | 25 (100.0%) |
| 15 Years | 0 (0.0%) | 56 (100.0%) |
| 16 and 17 Years | 24 (58.5%) | 0 (0.0%) |
| 18 to 24 Years | 0 (0.0%) | 30 (37.5%) |
| 25 to 34 Years | 131 (81.4%) | 99 (71.2%) |
| 35 to 44 Years | 167 (94.9%) | 131 (72.0%) |
| 45 to 54 Years | 210 (100.0%) | 201 (97.1%) |
| 55 to 64 Years | 83 (93.3%) | 167 (98.8%) |
| 65 to 74 Years | 47 (100.0%) | 37 (100.0%) |
| 75 Years and over | 46 (100.0%) | 61 (100.0%) |
| Total | 857 (87.1%) | 1,013 (82.1%) |
Income Below Poverty Among Married-Couple Families in Lewiston
The poverty statistics for married-couple families in Lewiston show that 4.2% or 10 of the total 241 families live below the poverty line. Families with 5 or more children have the highest poverty rate of 100.0%, comprising of 8 families. On the other hand, families with 1 or 2 children have the lowest poverty rate of 0.0%, which includes 0 families.
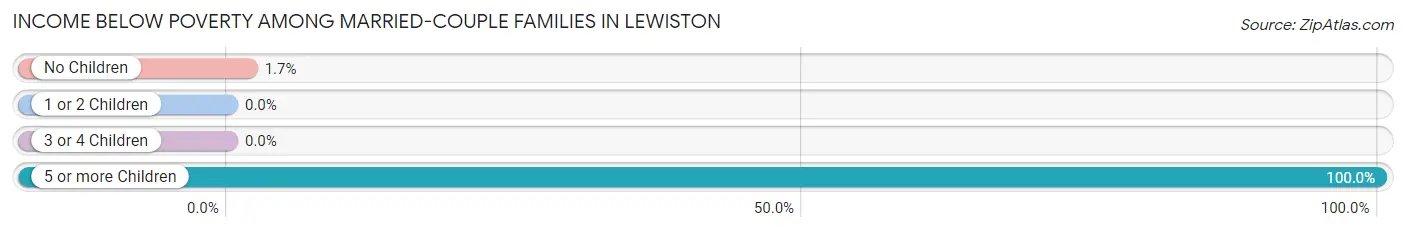
| Children | Above Poverty | Below Poverty |
| No Children | 115 (98.3%) | 2 (1.7%) |
| 1 or 2 Children | 113 (100.0%) | 0 (0.0%) |
| 3 or 4 Children | 3 (100.0%) | 0 (0.0%) |
| 5 or more Children | 0 (0.0%) | 8 (100.0%) |
| Total | 231 (95.9%) | 10 (4.2%) |
Income Below Poverty Among Single-Parent Households in Lewiston
According to the poverty data in Lewiston, 18.2% or 4 single-father households and 34.7% or 26 single-mother households are living below the poverty line. Among single-father households, those with 1 or 2 children have the highest poverty rate, with 4 households (26.7%) experiencing poverty. Likewise, among single-mother households, those with 1 or 2 children have the highest poverty rate, with 26 households (50.0%) falling below the poverty line.
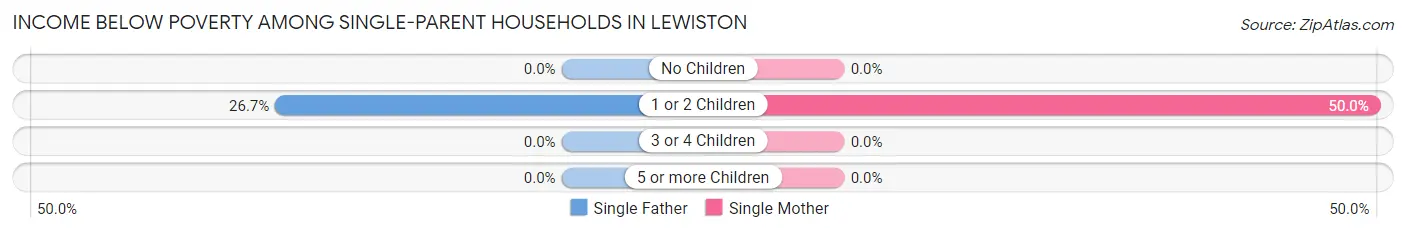
| Children | Single Father | Single Mother |
| No Children | 0 (0.0%) | 0 (0.0%) |
| 1 or 2 Children | 4 (26.7%) | 26 (50.0%) |
| 3 or 4 Children | 0 (0.0%) | 0 (0.0%) |
| 5 or more Children | 0 (0.0%) | 0 (0.0%) |
| Total | 4 (18.2%) | 26 (34.7%) |
Income Below Poverty Among Married-Couple vs Single-Parent Households in Lewiston
The poverty data for Lewiston shows that 10 of the married-couple family households (4.2%) and 30 of the single-parent households (30.9%) are living below the poverty level. Within the married-couple family households, those with 5 or more children have the highest poverty rate, with 8 households (100.0%) falling below the poverty line. Among the single-parent households, those with 1 or 2 children have the highest poverty rate, with 30 household (44.8%) living below poverty.
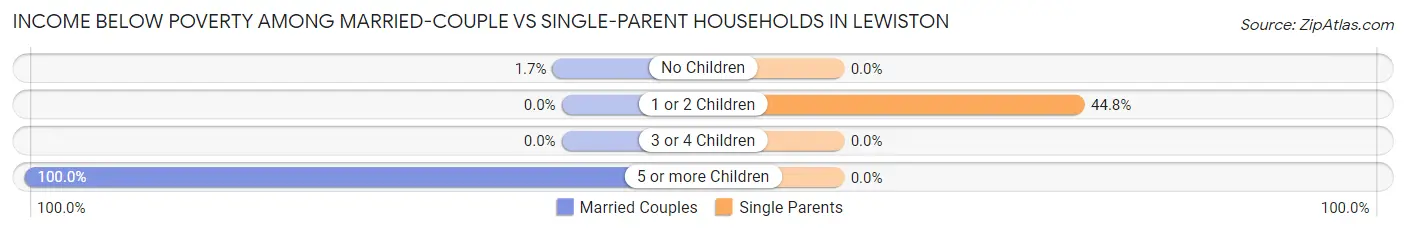
| Children | Married-Couple Families | Single-Parent Households |
| No Children | 2 (1.7%) | 0 (0.0%) |
| 1 or 2 Children | 0 (0.0%) | 30 (44.8%) |
| 3 or 4 Children | 0 (0.0%) | 0 (0.0%) |
| 5 or more Children | 8 (100.0%) | 0 (0.0%) |
| Total | 10 (4.2%) | 30 (30.9%) |
Race in Lewiston
The most populous races in Lewiston are White / Caucasian (1,777 | 80.1%), Two or more Races (333 | 15.0%), and Native / Alaskan (95 | 4.3%).
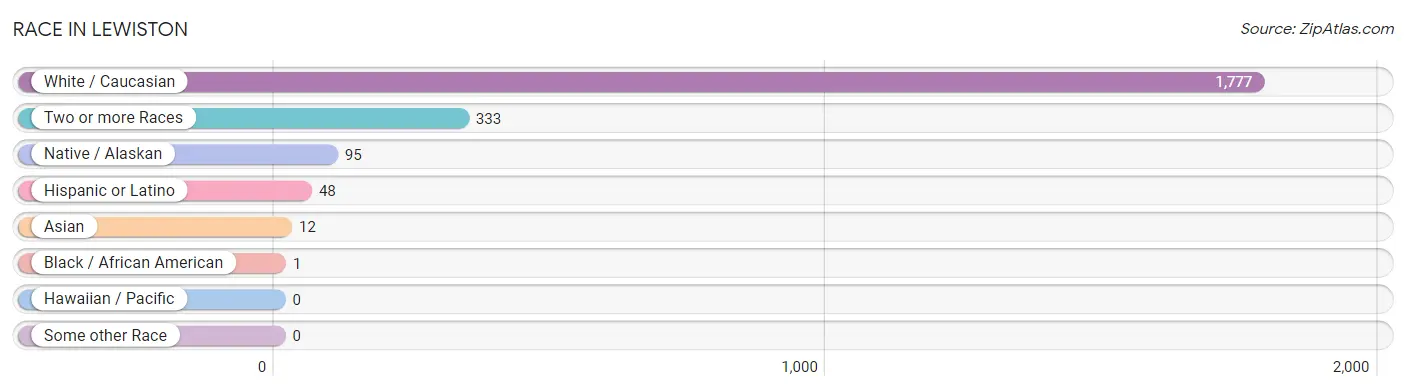
| Race | # Population | % Population |
| Asian | 12 | 0.5% |
| Black / African American | 1 | 0.1% |
| Hawaiian / Pacific | 0 | 0.0% |
| Hispanic or Latino | 48 | 2.2% |
| Native / Alaskan | 95 | 4.3% |
| White / Caucasian | 1,777 | 80.1% |
| Two or more Races | 333 | 15.0% |
| Some other Race | 0 | 0.0% |
| Total | 2,218 | 100.0% |
Ancestry in Lewiston
The most populous ancestries reported in Lewiston are American (336 | 15.1%), Irish (269 | 12.1%), German (251 | 11.3%), Cherokee (241 | 10.9%), and Welsh (185 | 8.3%), together accounting for 57.8% of all Lewiston residents.
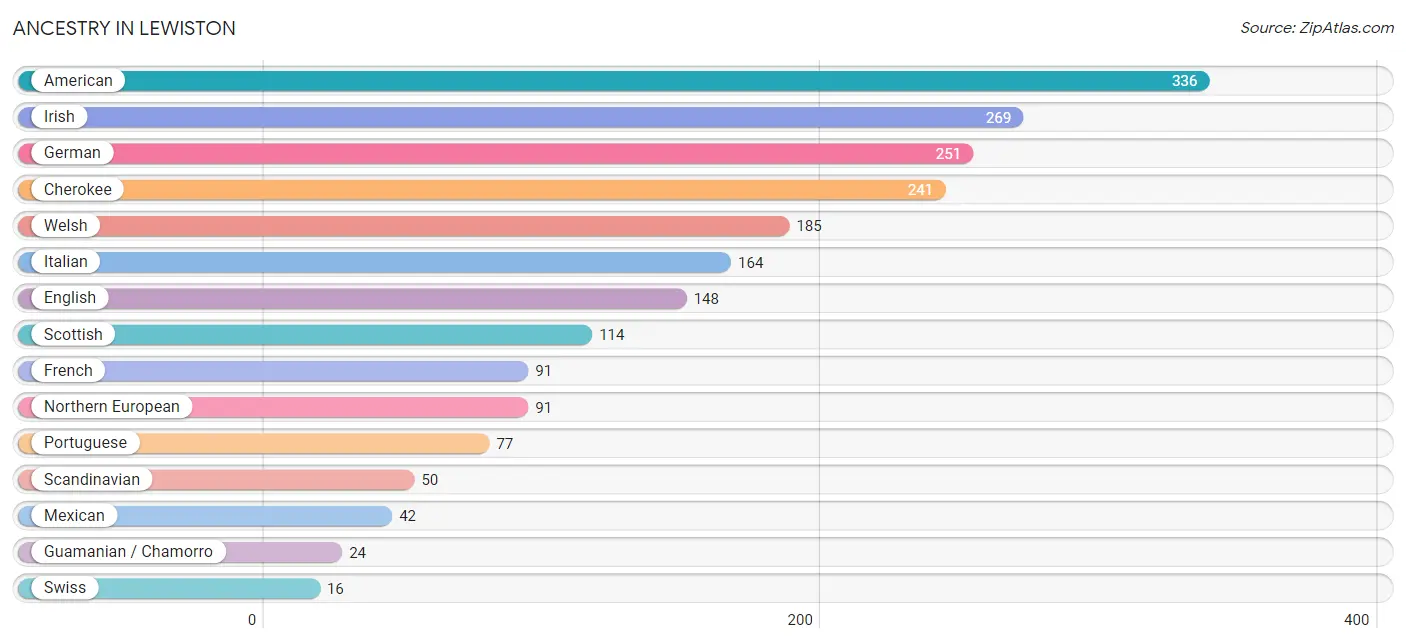
| Ancestry | # Population | % Population |
| American | 336 | 15.1% |
| Burmese | 12 | 0.5% |
| Canadian | 2 | 0.1% |
| Central American | 6 | 0.3% |
| Cherokee | 241 | 10.9% |
| Dutch | 7 | 0.3% |
| Eastern European | 14 | 0.6% |
| English | 148 | 6.7% |
| French | 91 | 4.1% |
| German | 251 | 11.3% |
| Guamanian / Chamorro | 24 | 1.1% |
| Irish | 269 | 12.1% |
| Italian | 164 | 7.4% |
| Mexican | 42 | 1.9% |
| Northern European | 91 | 4.1% |
| Norwegian | 6 | 0.3% |
| Polish | 3 | 0.1% |
| Portuguese | 77 | 3.5% |
| Salvadoran | 6 | 0.3% |
| Scandinavian | 50 | 2.2% |
| Scottish | 114 | 5.1% |
| Swedish | 6 | 0.3% |
| Swiss | 16 | 0.7% |
| Welsh | 185 | 8.3% | View All 24 Rows |
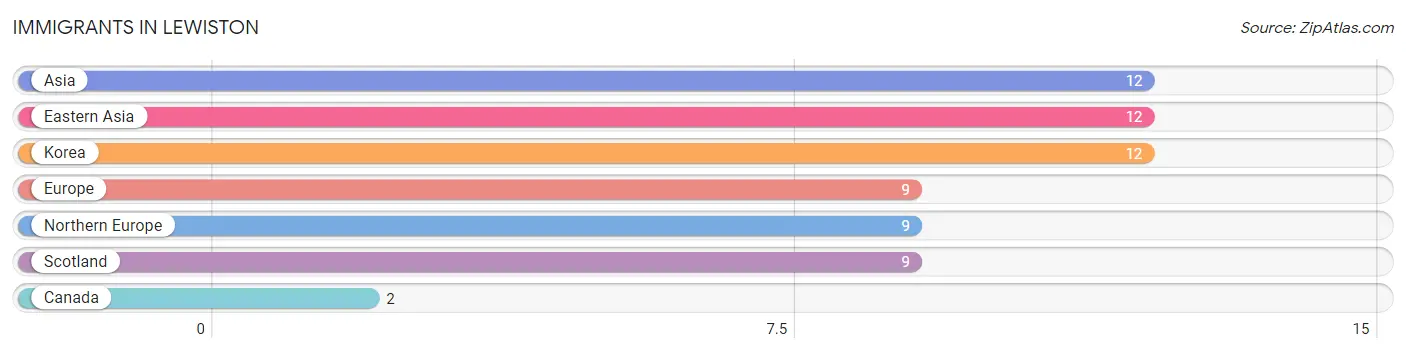
Immigrants in Lewiston
The most numerous immigrant groups reported in Lewiston came from Asia (12 | 0.5%), Eastern Asia (12 | 0.5%), Korea (12 | 0.5%), Europe (9 | 0.4%), and Northern Europe (9 | 0.4%), together accounting for 2.4% of all Lewiston residents.
| Immigration Origin | # Population | % Population |
| Asia | 12 | 0.5% |
| Canada | 2 | 0.1% |
| Eastern Asia | 12 | 0.5% |
| Europe | 9 | 0.4% |
| Korea | 12 | 0.5% |
| Northern Europe | 9 | 0.4% |
| Scotland | 9 | 0.4% | View All 7 Rows |
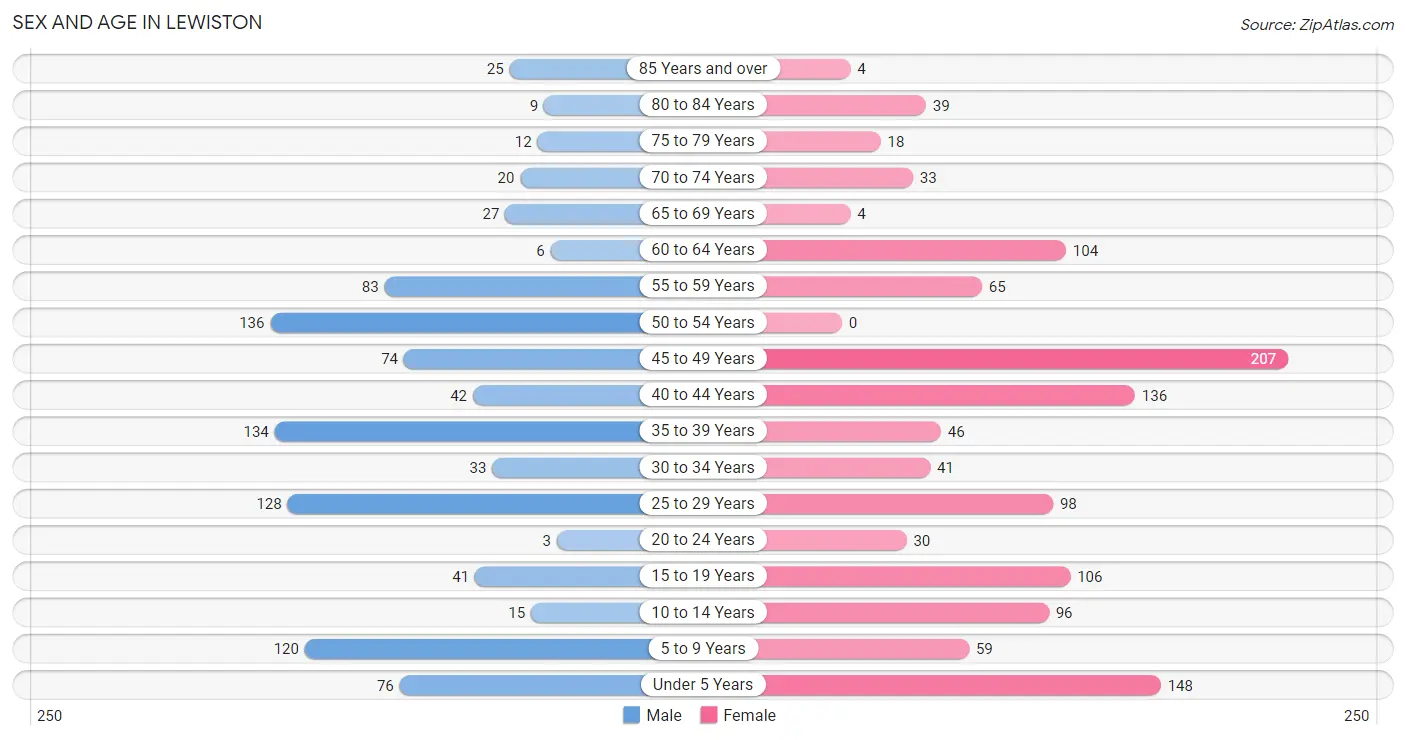
Sex and Age in Lewiston
Sex and Age in Lewiston
The most populous age groups in Lewiston are 50 to 54 Years (136 | 13.8%) for men and 45 to 49 Years (207 | 16.8%) for women.
| Age Bracket | Male | Female |
| Under 5 Years | 76 (7.7%) | 148 (12.0%) |
| 5 to 9 Years | 120 (12.2%) | 59 (4.8%) |
| 10 to 14 Years | 15 (1.5%) | 96 (7.8%) |
| 15 to 19 Years | 41 (4.2%) | 106 (8.6%) |
| 20 to 24 Years | 3 (0.3%) | 30 (2.4%) |
| 25 to 29 Years | 128 (13.0%) | 98 (7.9%) |
| 30 to 34 Years | 33 (3.4%) | 41 (3.3%) |
| 35 to 39 Years | 134 (13.6%) | 46 (3.7%) |
| 40 to 44 Years | 42 (4.3%) | 136 (11.0%) |
| 45 to 49 Years | 74 (7.5%) | 207 (16.8%) |
| 50 to 54 Years | 136 (13.8%) | 0 (0.0%) |
| 55 to 59 Years | 83 (8.4%) | 65 (5.3%) |
| 60 to 64 Years | 6 (0.6%) | 104 (8.4%) |
| 65 to 69 Years | 27 (2.7%) | 4 (0.3%) |
| 70 to 74 Years | 20 (2.0%) | 33 (2.7%) |
| 75 to 79 Years | 12 (1.2%) | 18 (1.5%) |
| 80 to 84 Years | 9 (0.9%) | 39 (3.2%) |
| 85 Years and over | 25 (2.5%) | 4 (0.3%) |
| Total | 984 (100.0%) | 1,234 (100.0%) |
Families and Households in Lewiston
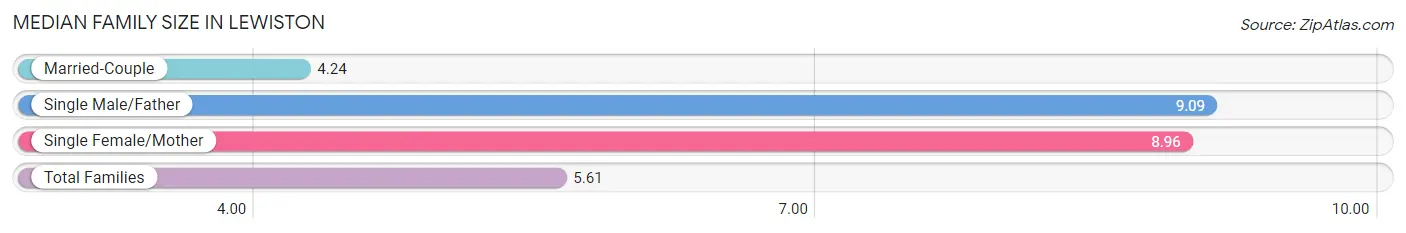
Median Family Size in Lewiston
The median family size in Lewiston is 5.61 persons per family, with single male/father families (22 | 6.5%) accounting for the largest median family size of 9.09 persons per family. On the other hand, married-couple families (241 | 71.3%) represent the smallest median family size with 4.24 persons per family.
| Family Type | # Families | Family Size |
| Married-Couple | 241 (71.3%) | 4.24 |
| Single Male/Father | 22 (6.5%) | 9.09 |
| Single Female/Mother | 75 (22.2%) | 8.96 |
| Total Families | 338 (100.0%) | 5.61 |
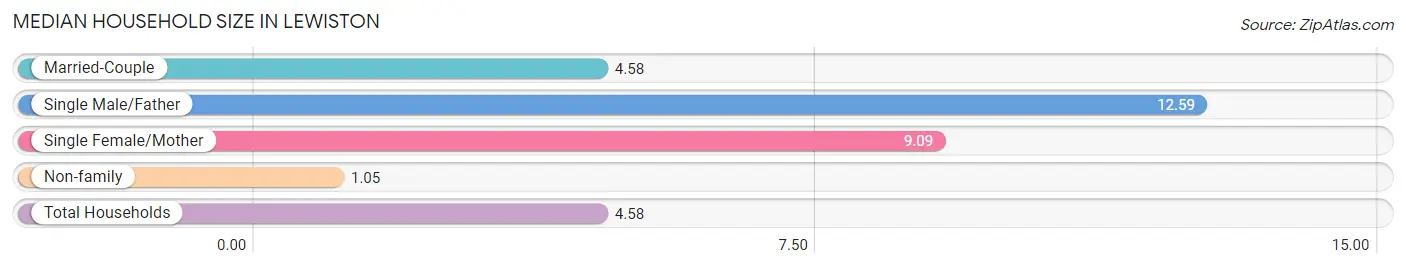
Median Household Size in Lewiston
The median household size in Lewiston is 4.58 persons per household, with single male/father households (22 | 4.5%) accounting for the largest median household size of 12.59 persons per household. non-family households (146 | 30.2%) represent the smallest median household size with 1.05 persons per household.
| Household Type | # Households | Household Size |
| Married-Couple | 241 (49.8%) | 4.58 |
| Single Male/Father | 22 (4.5%) | 12.59 |
| Single Female/Mother | 75 (15.5%) | 9.09 |
| Non-family | 146 (30.2%) | 1.05 |
| Total Households | 484 (100.0%) | 4.58 |
Household Size by Marriage Status in Lewiston
Out of a total of 484 households in Lewiston, 338 (69.8%) are family households, while 146 (30.2%) are nonfamily households. The most numerous type of family households are 2-person households, comprising 93, and the most common type of nonfamily households are 1-person households, comprising 122.
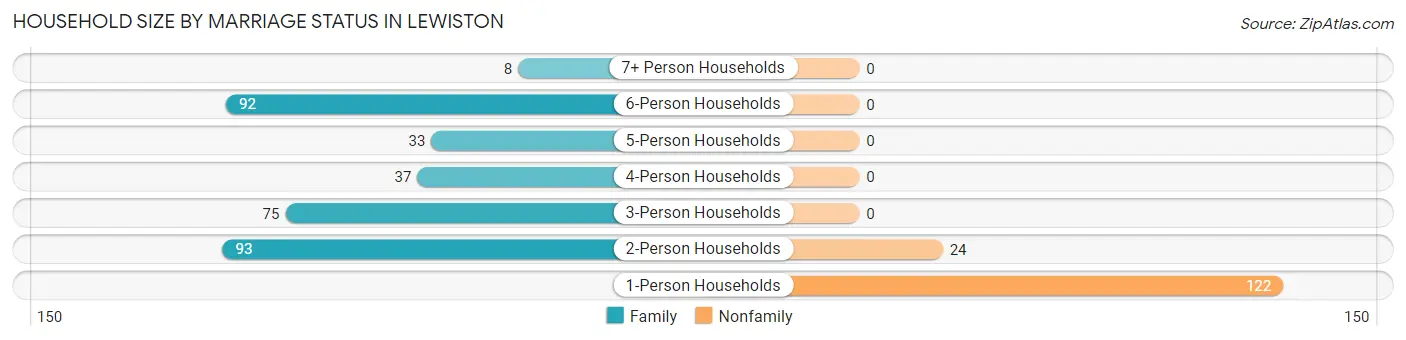
| Household Size | Family Households | Nonfamily Households |
| 1-Person Households | - | 122 (25.2%) |
| 2-Person Households | 93 (19.2%) | 24 (5.0%) |
| 3-Person Households | 75 (15.5%) | 0 (0.0%) |
| 4-Person Households | 37 (7.6%) | 0 (0.0%) |
| 5-Person Households | 33 (6.8%) | 0 (0.0%) |
| 6-Person Households | 92 (19.0%) | 0 (0.0%) |
| 7+ Person Households | 8 (1.7%) | 0 (0.0%) |
| Total | 338 (69.8%) | 146 (30.2%) |
Female Fertility in Lewiston
Fertility by Age in Lewiston
Average fertility rate in Lewiston is 5.0 births per 1,000 women. Women in the age bracket of 20 to 34 years have the highest fertility rate with 18.0 births per 1,000 women. Women in the age bracket of 20 to 34 years acount for 100.0% of all women with births.
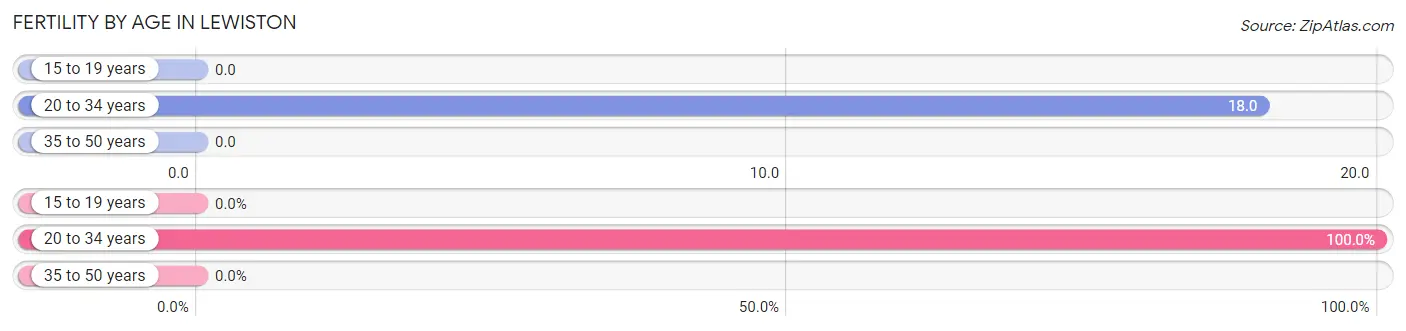
| Age Bracket | Women with Births | Births / 1,000 Women |
| 15 to 19 years | 0 (0.0%) | 0.0 |
| 20 to 34 years | 3 (100.0%) | 18.0 |
| 35 to 50 years | 0 (0.0%) | 0.0 |
| Total | 3 (100.0%) | 5.0 |
Fertility by Age by Marriage Status in Lewiston
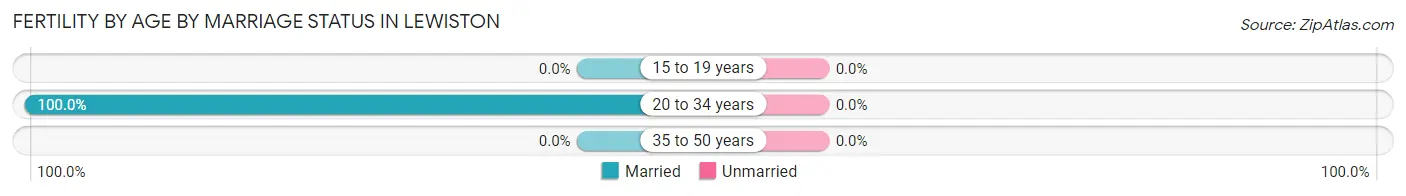
| Age Bracket | Married | Unmarried |
| 15 to 19 years | 0 (0.0%) | 0 (0.0%) |
| 20 to 34 years | 3 (100.0%) | 0 (0.0%) |
| 35 to 50 years | 0 (0.0%) | 0 (0.0%) |
| Total | 3 (100.0%) | 0 (0.0%) |
Fertility by Education in Lewiston
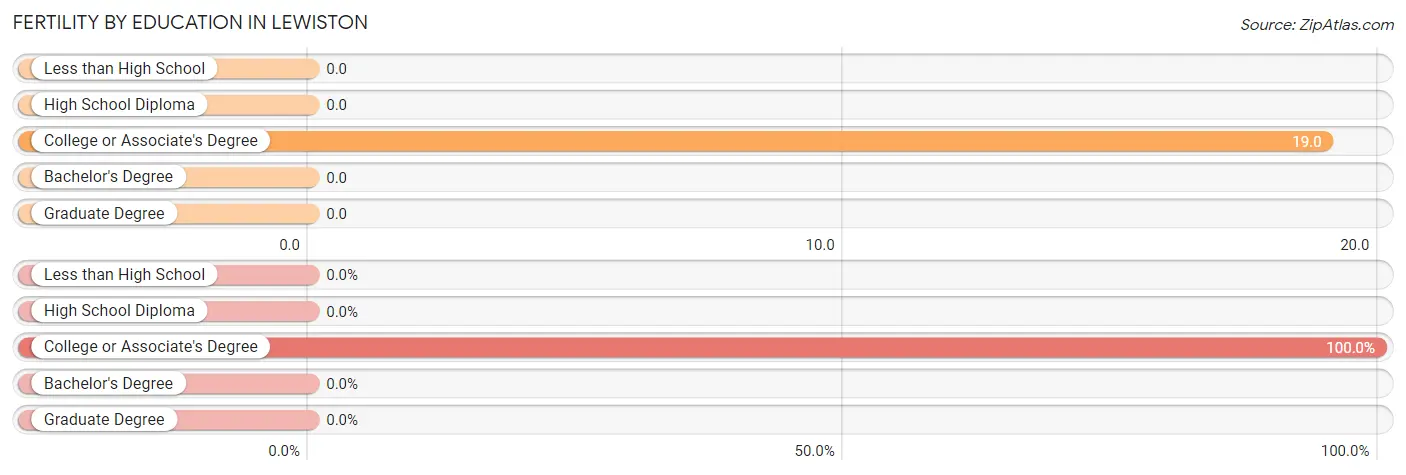
| Educational Attainment | Women with Births | Births / 1,000 Women |
| Less than High School | 0 (0.0%) | 0.0 |
| High School Diploma | 0 (0.0%) | 0.0 |
| College or Associate's Degree | 3 (100.0%) | 19.0 |
| Bachelor's Degree | 0 (0.0%) | 0.0 |
| Graduate Degree | 0 (0.0%) | 0.0 |
| Total | 3 (100.0%) | 5.0 |
Fertility by Education by Marriage Status in Lewiston
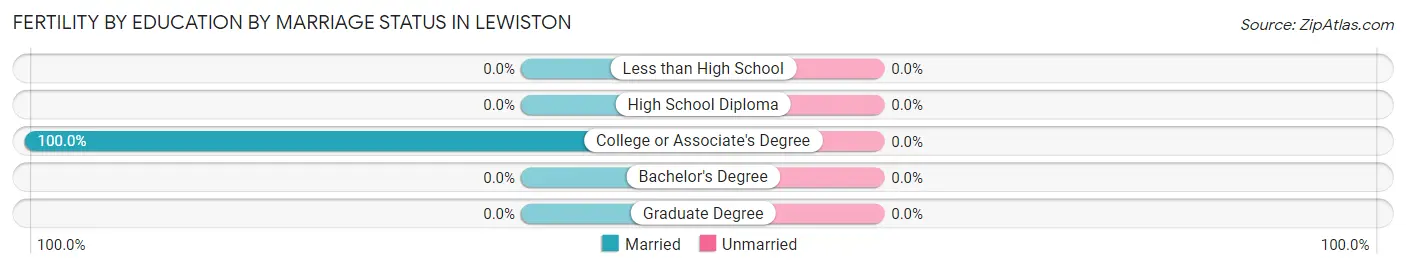
| Educational Attainment | Married | Unmarried |
| Less than High School | 0 (0.0%) | 0 (0.0%) |
| High School Diploma | 0 (0.0%) | 0 (0.0%) |
| College or Associate's Degree | 3 (100.0%) | 0 (0.0%) |
| Bachelor's Degree | 0 (0.0%) | 0 (0.0%) |
| Graduate Degree | 0 (0.0%) | 0 (0.0%) |
| Total | 3 (100.0%) | 0 (0.0%) |
Employment Characteristics in Lewiston
Employment by Class of Employer in Lewiston
Among the 821 employed individuals in Lewiston, private company employees (443 | 54.0%), local government employees (157 | 19.1%), and state government employees (95 | 11.6%) make up the most common classes of employment.
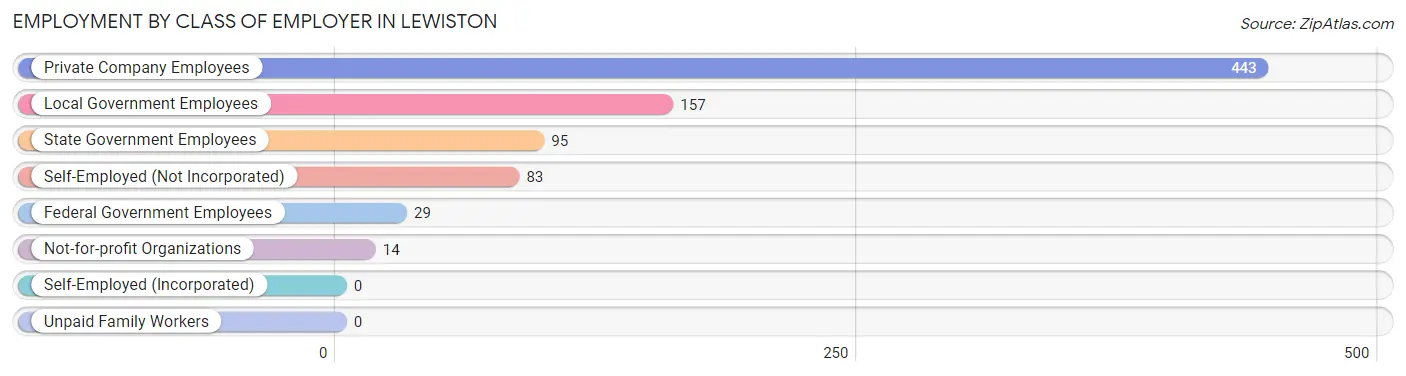
| Employer Class | # Employees | % Employees |
| Private Company Employees | 443 | 54.0% |
| Self-Employed (Incorporated) | 0 | 0.0% |
| Self-Employed (Not Incorporated) | 83 | 10.1% |
| Not-for-profit Organizations | 14 | 1.7% |
| Local Government Employees | 157 | 19.1% |
| State Government Employees | 95 | 11.6% |
| Federal Government Employees | 29 | 3.5% |
| Unpaid Family Workers | 0 | 0.0% |
| Total | 821 | 100.0% |
Employment Status by Age in Lewiston
According to the labor force statistics for Lewiston, out of the total population over 16 years of age (1,648), 52.3% or 862 individuals are in the labor force, with 3.9% or 34 of them unemployed. The age group with the highest labor force participation rate is 55 to 59 years, with 90.5% or 134 individuals in the labor force. Within the labor force, the 20 to 24 years age range has the highest percentage of unemployed individuals, with 50.0% or 3 of them being unemployed.
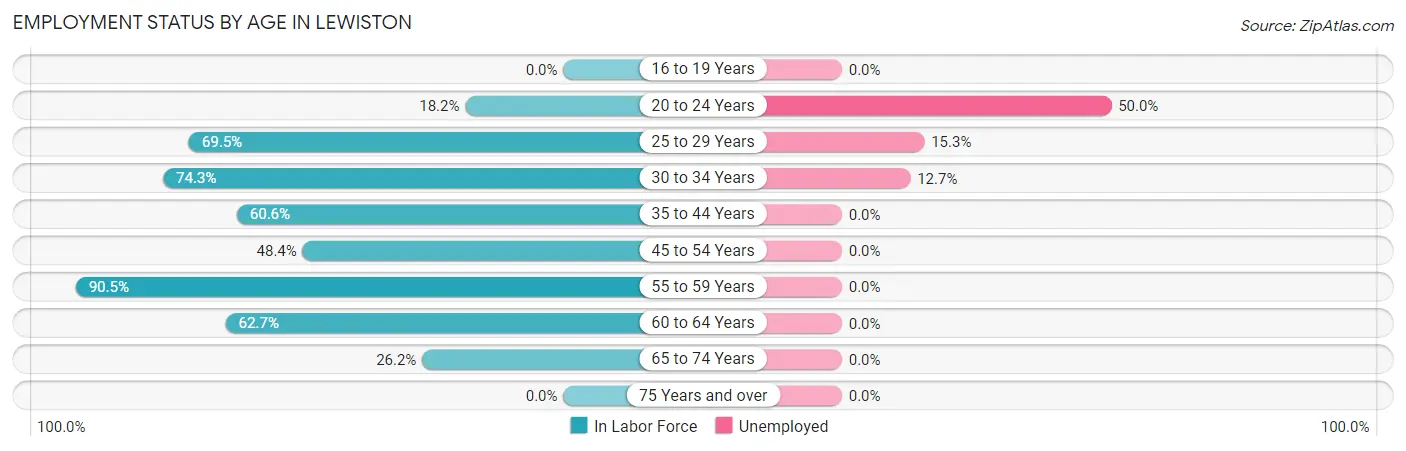
| Age Bracket | In Labor Force | Unemployed |
| 16 to 19 Years | 0 (0.0%) | 0 (0.0%) |
| 20 to 24 Years | 6 (18.2%) | 3 (50.0%) |
| 25 to 29 Years | 157 (69.5%) | 24 (15.3%) |
| 30 to 34 Years | 55 (74.3%) | 7 (12.7%) |
| 35 to 44 Years | 217 (60.6%) | 0 (0.0%) |
| 45 to 54 Years | 202 (48.4%) | 0 (0.0%) |
| 55 to 59 Years | 134 (90.5%) | 0 (0.0%) |
| 60 to 64 Years | 69 (62.7%) | 0 (0.0%) |
| 65 to 74 Years | 22 (26.2%) | 0 (0.0%) |
| 75 Years and over | 0 (0.0%) | 0 (0.0%) |
| Total | 862 (52.3%) | 34 (3.9%) |
Employment Status by Educational Attainment in Lewiston
According to labor force statistics for Lewiston, 62.6% of individuals (834) out of the total population between 25 and 64 years of age (1,333) are in the labor force, with 3.7% or 31 of them being unemployed. The group with the highest labor force participation rate are those with the educational attainment of less than high school, with 100.0% or 86 individuals in the labor force. Within the labor force, individuals with high school diploma education have the highest percentage of unemployment, with 6.3% or 31 of them being unemployed.
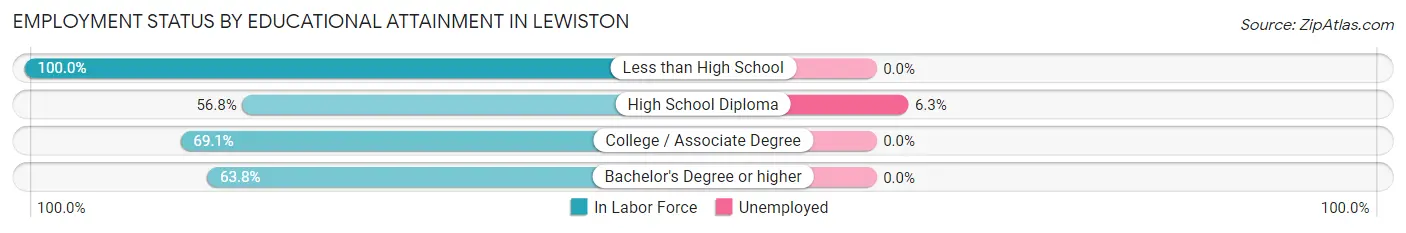
| Educational Attainment | In Labor Force | Unemployed |
| Less than High School | 86 (100.0%) | 0 (0.0%) |
| High School Diploma | 493 (56.8%) | 55 (6.3%) |
| College / Associate Degree | 172 (69.1%) | 0 (0.0%) |
| Bachelor's Degree or higher | 83 (63.8%) | 0 (0.0%) |
| Total | 834 (62.6%) | 49 (3.7%) |
Employment Occupations by Sex in Lewiston
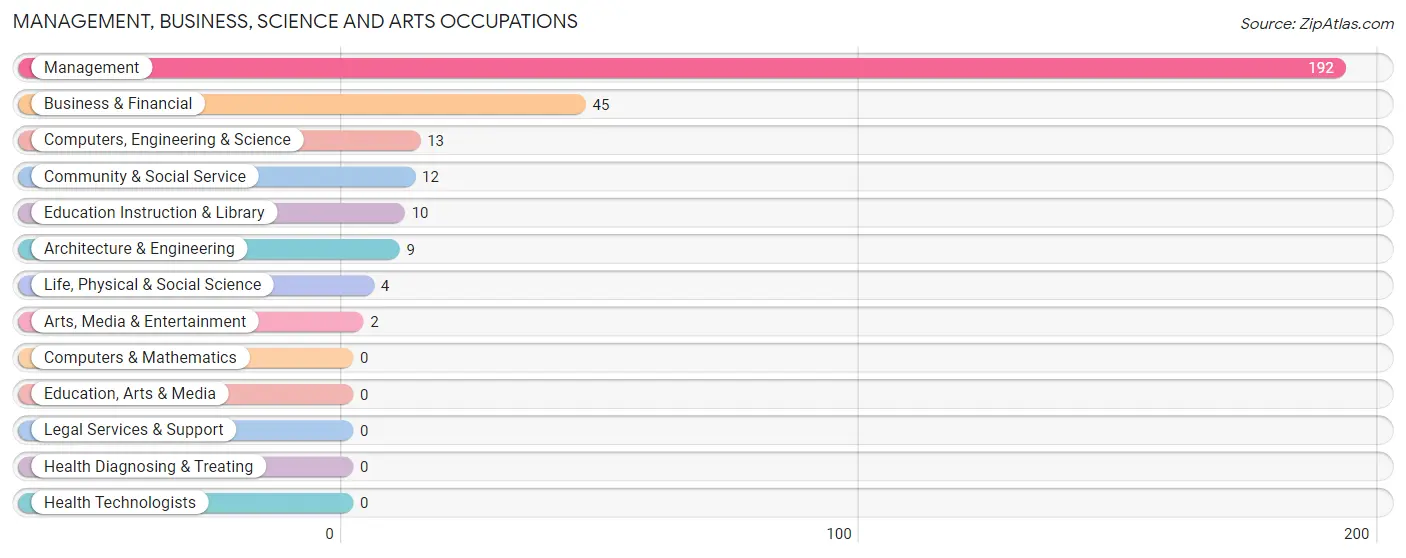
Management, Business, Science and Arts Occupations
The most common Management, Business, Science and Arts occupations in Lewiston are Management (192 | 23.2%), Business & Financial (45 | 5.4%), Computers, Engineering & Science (13 | 1.6%), Community & Social Service (12 | 1.5%), and Education Instruction & Library (10 | 1.2%).
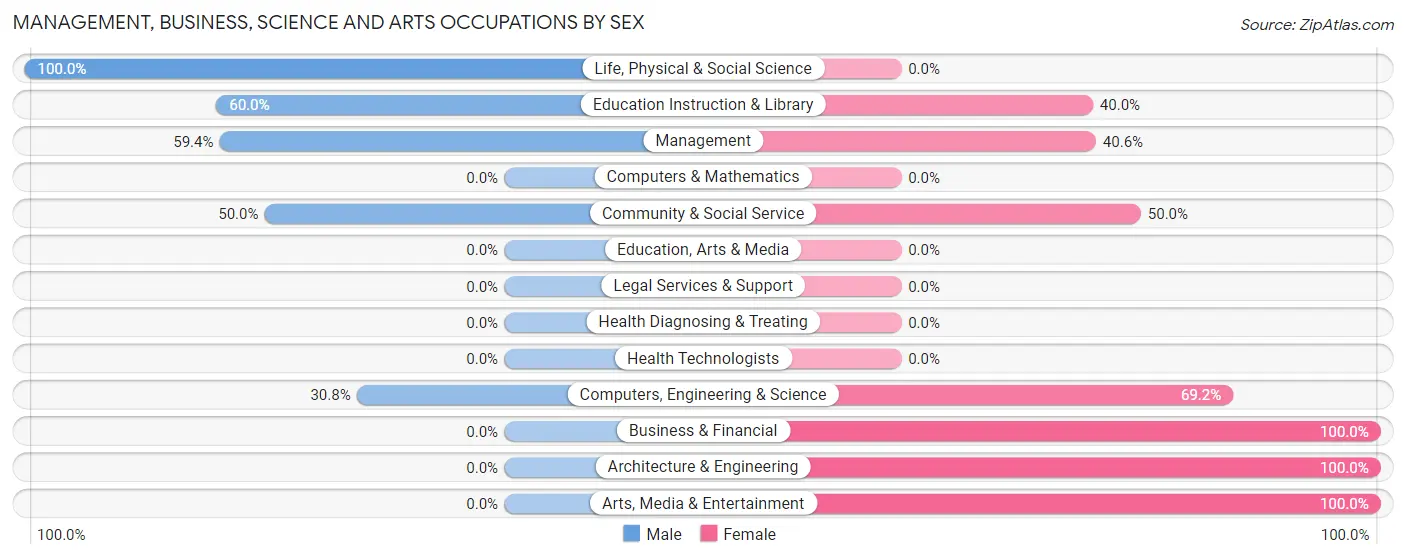
Management, Business, Science and Arts Occupations by Sex
Within the Management, Business, Science and Arts occupations in Lewiston, the most male-oriented occupations are Life, Physical & Social Science (100.0%), Education Instruction & Library (60.0%), and Management (59.4%), while the most female-oriented occupations are Business & Financial (100.0%), Architecture & Engineering (100.0%), and Arts, Media & Entertainment (100.0%).
| Occupation | Male | Female |
| Management | 114 (59.4%) | 78 (40.6%) |
| Business & Financial | 0 (0.0%) | 45 (100.0%) |
| Computers, Engineering & Science | 4 (30.8%) | 9 (69.2%) |
| Computers & Mathematics | 0 (0.0%) | 0 (0.0%) |
| Architecture & Engineering | 0 (0.0%) | 9 (100.0%) |
| Life, Physical & Social Science | 4 (100.0%) | 0 (0.0%) |
| Community & Social Service | 6 (50.0%) | 6 (50.0%) |
| Education, Arts & Media | 0 (0.0%) | 0 (0.0%) |
| Legal Services & Support | 0 (0.0%) | 0 (0.0%) |
| Education Instruction & Library | 6 (60.0%) | 4 (40.0%) |
| Arts, Media & Entertainment | 0 (0.0%) | 2 (100.0%) |
| Health Diagnosing & Treating | 0 (0.0%) | 0 (0.0%) |
| Health Technologists | 0 (0.0%) | 0 (0.0%) |
| Total (Category) | 124 (47.3%) | 138 (52.7%) |
| Total (Overall) | 507 (61.2%) | 321 (38.8%) |
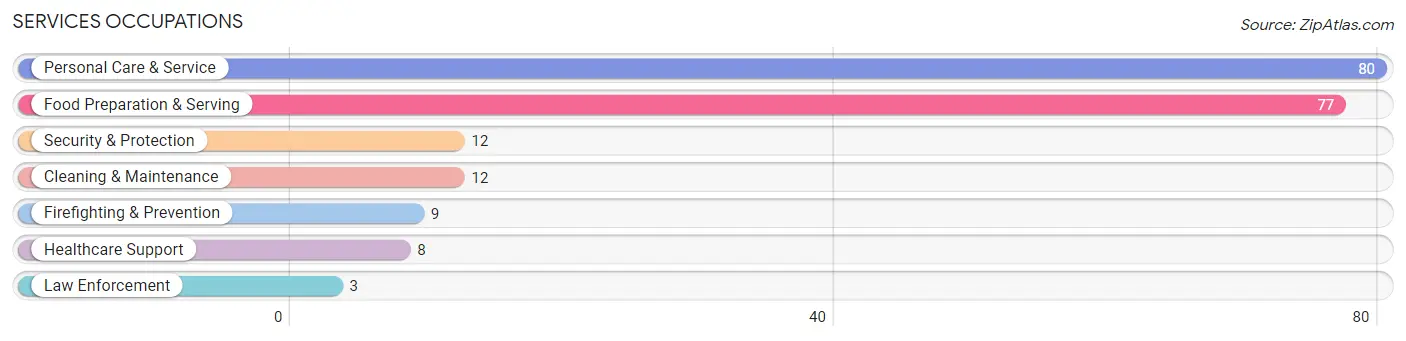
Services Occupations
The most common Services occupations in Lewiston are Personal Care & Service (80 | 9.7%), Food Preparation & Serving (77 | 9.3%), Security & Protection (12 | 1.5%), Cleaning & Maintenance (12 | 1.5%), and Firefighting & Prevention (9 | 1.1%).
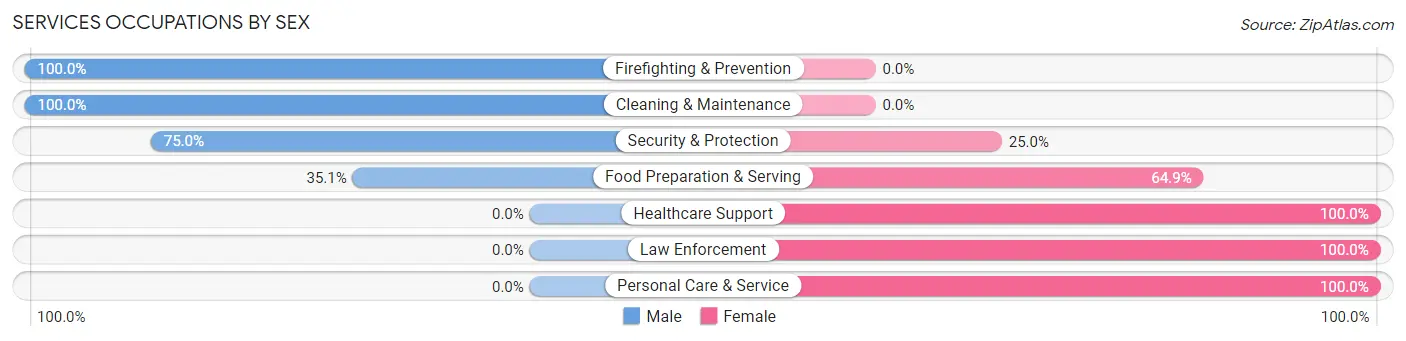
Services Occupations by Sex
Within the Services occupations in Lewiston, the most male-oriented occupations are Firefighting & Prevention (100.0%), Cleaning & Maintenance (100.0%), and Security & Protection (75.0%), while the most female-oriented occupations are Healthcare Support (100.0%), Law Enforcement (100.0%), and Personal Care & Service (100.0%).
| Occupation | Male | Female |
| Healthcare Support | 0 (0.0%) | 8 (100.0%) |
| Security & Protection | 9 (75.0%) | 3 (25.0%) |
| Firefighting & Prevention | 9 (100.0%) | 0 (0.0%) |
| Law Enforcement | 0 (0.0%) | 3 (100.0%) |
| Food Preparation & Serving | 27 (35.1%) | 50 (64.9%) |
| Cleaning & Maintenance | 12 (100.0%) | 0 (0.0%) |
| Personal Care & Service | 0 (0.0%) | 80 (100.0%) |
| Total (Category) | 48 (25.4%) | 141 (74.6%) |
| Total (Overall) | 507 (61.2%) | 321 (38.8%) |
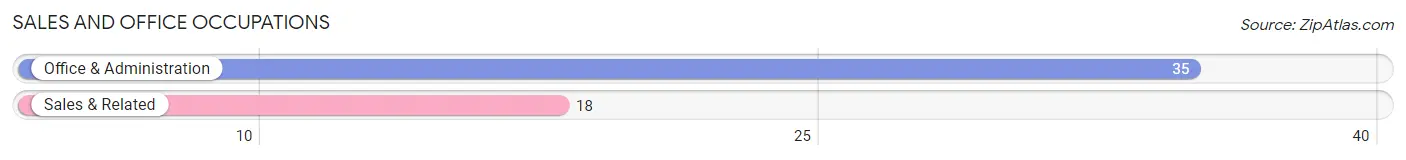
Sales and Office Occupations
The most common Sales and Office occupations in Lewiston are Office & Administration (35 | 4.2%), and Sales & Related (18 | 2.2%).
Sales and Office Occupations by Sex
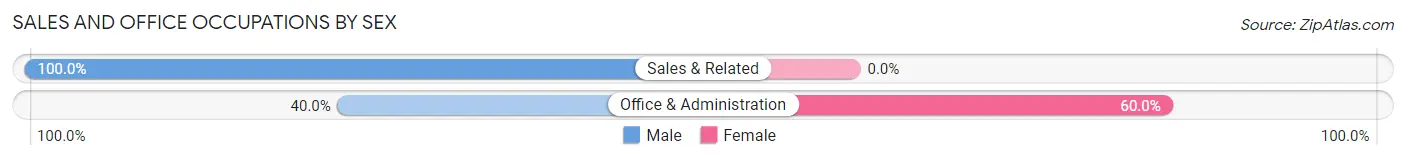
| Occupation | Male | Female |
| Sales & Related | 18 (100.0%) | 0 (0.0%) |
| Office & Administration | 14 (40.0%) | 21 (60.0%) |
| Total (Category) | 32 (60.4%) | 21 (39.6%) |
| Total (Overall) | 507 (61.2%) | 321 (38.8%) |
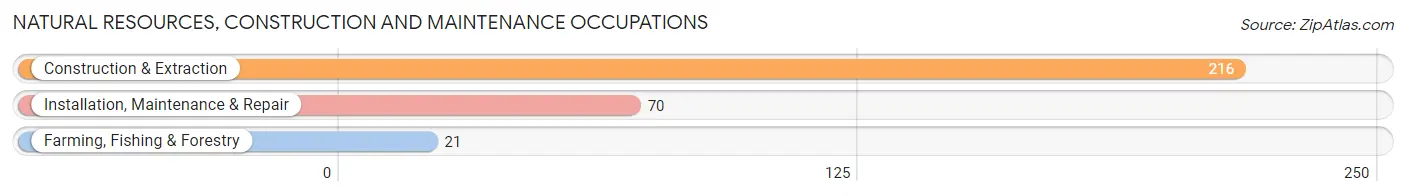
Natural Resources, Construction and Maintenance Occupations
The most common Natural Resources, Construction and Maintenance occupations in Lewiston are Construction & Extraction (216 | 26.1%), Installation, Maintenance & Repair (70 | 8.5%), and Farming, Fishing & Forestry (21 | 2.5%).
Natural Resources, Construction and Maintenance Occupations by Sex
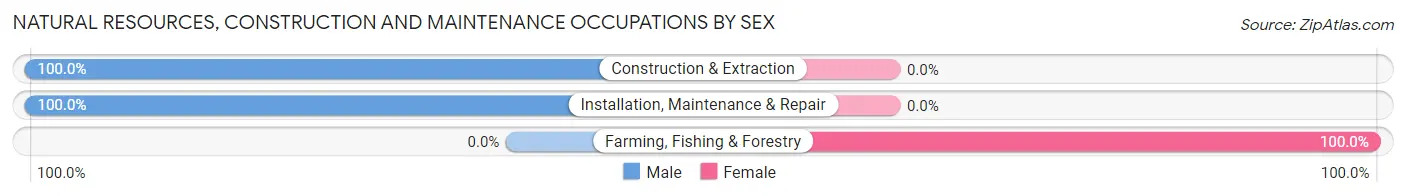
| Occupation | Male | Female |
| Farming, Fishing & Forestry | 0 (0.0%) | 21 (100.0%) |
| Construction & Extraction | 216 (100.0%) | 0 (0.0%) |
| Installation, Maintenance & Repair | 70 (100.0%) | 0 (0.0%) |
| Total (Category) | 286 (93.2%) | 21 (6.8%) |
| Total (Overall) | 507 (61.2%) | 321 (38.8%) |
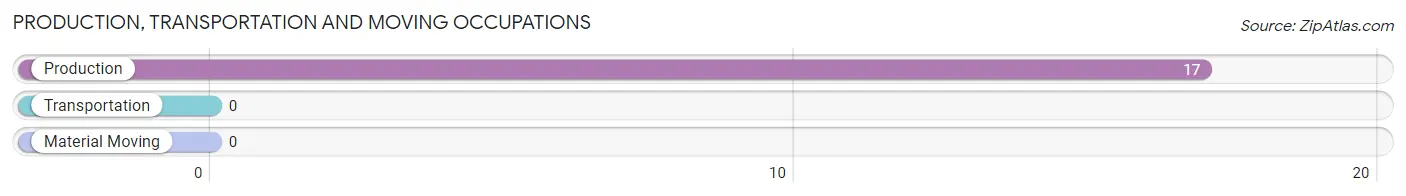
Production, Transportation and Moving Occupations
The most common Production, Transportation and Moving occupations in Lewiston are , and Production (17 | 2.1%).
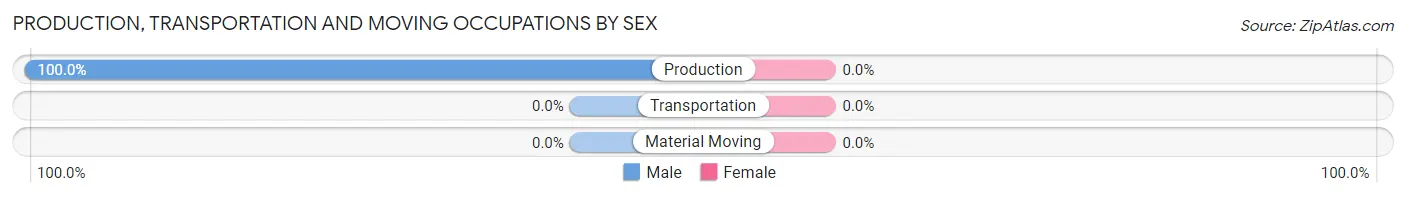
Production, Transportation and Moving Occupations by Sex
| Occupation | Male | Female |
| Production | 17 (100.0%) | 0 (0.0%) |
| Transportation | 0 (0.0%) | 0 (0.0%) |
| Material Moving | 0 (0.0%) | 0 (0.0%) |
| Total (Category) | 17 (100.0%) | 0 (0.0%) |
| Total (Overall) | 507 (61.2%) | 321 (38.8%) |
Employment Industries by Sex in Lewiston
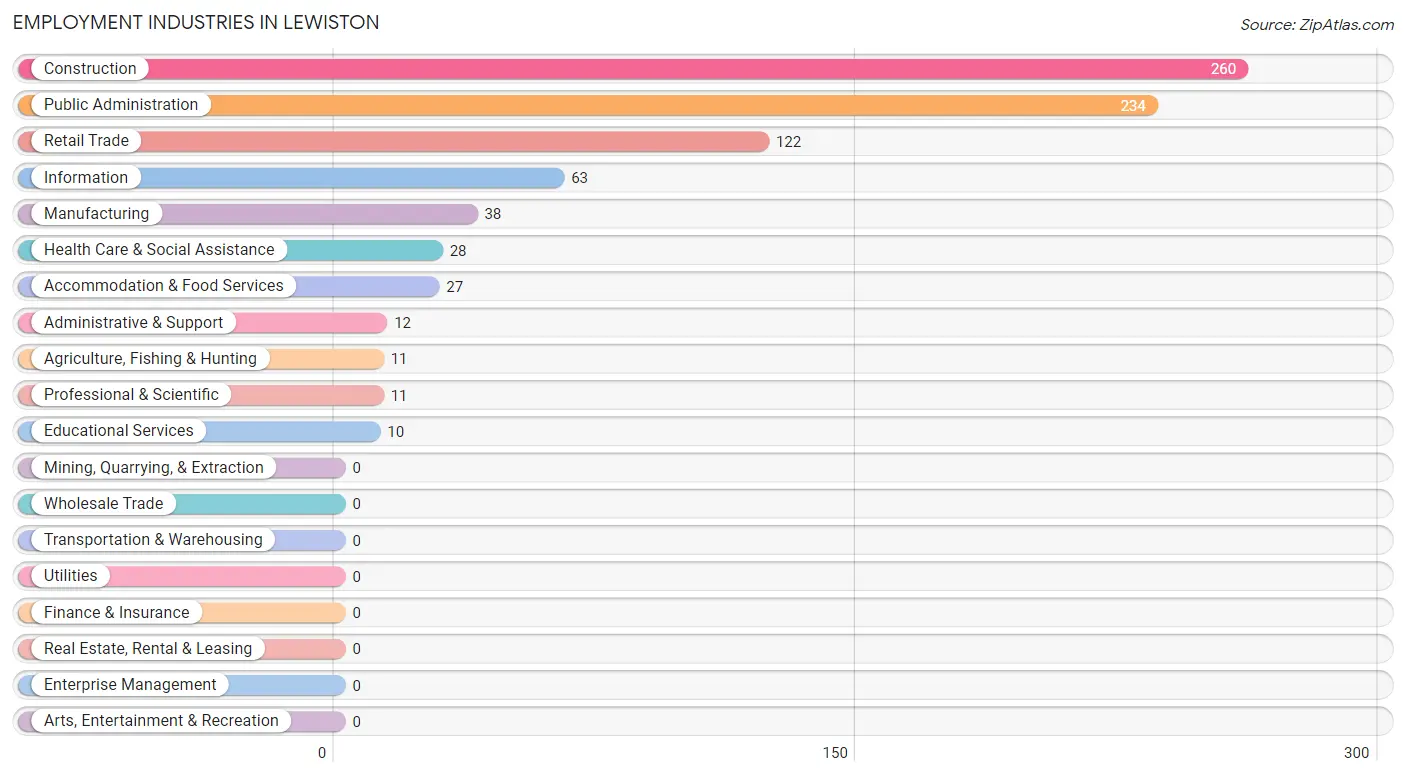
Employment Industries in Lewiston
The major employment industries in Lewiston include Construction (260 | 31.4%), Public Administration (234 | 28.3%), Retail Trade (122 | 14.7%), Information (63 | 7.6%), and Manufacturing (38 | 4.6%).
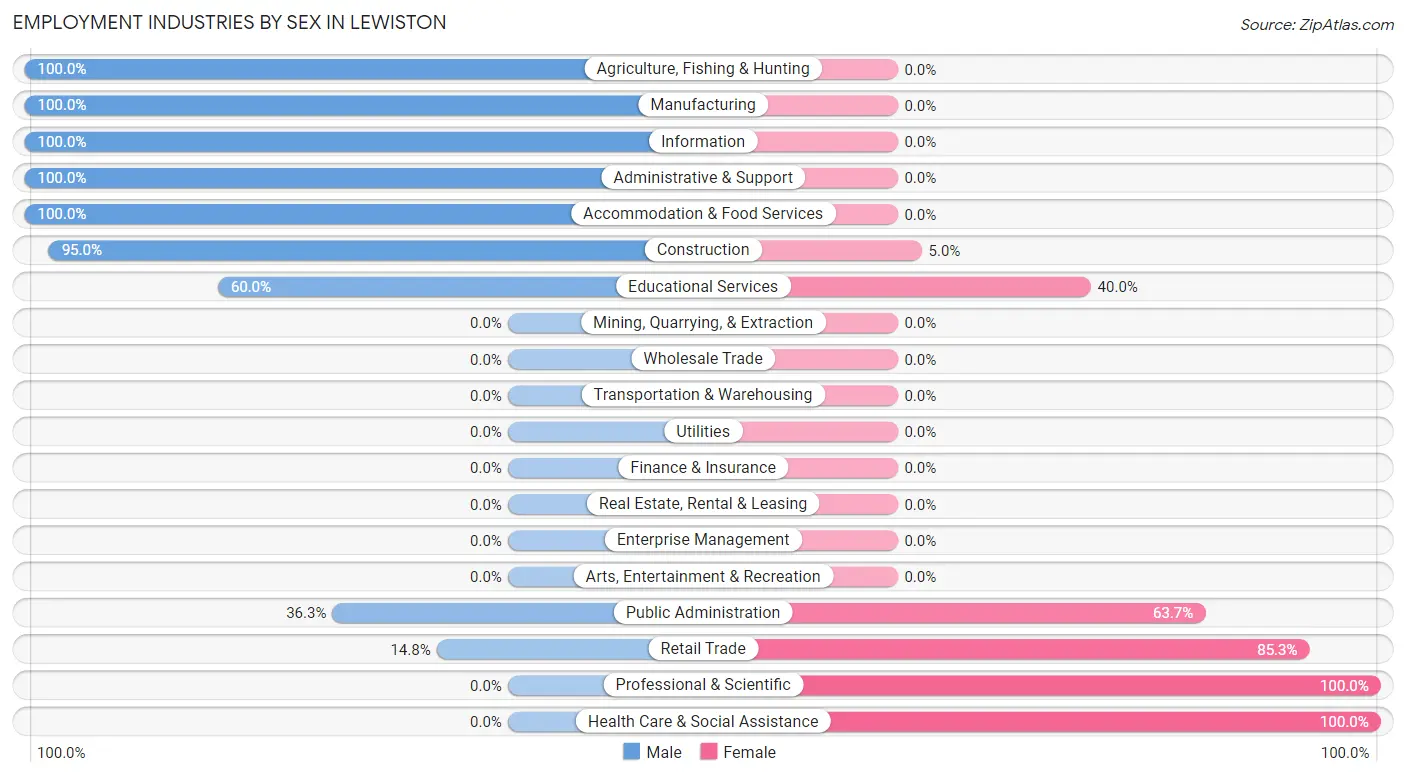
Employment Industries by Sex in Lewiston
The Lewiston industries that see more men than women are Agriculture, Fishing & Hunting (100.0%), Manufacturing (100.0%), and Information (100.0%), whereas the industries that tend to have a higher number of women are Professional & Scientific (100.0%), Health Care & Social Assistance (100.0%), and Retail Trade (85.3%).
| Industry | Male | Female |
| Agriculture, Fishing & Hunting | 11 (100.0%) | 0 (0.0%) |
| Mining, Quarrying, & Extraction | 0 (0.0%) | 0 (0.0%) |
| Construction | 247 (95.0%) | 13 (5.0%) |
| Manufacturing | 38 (100.0%) | 0 (0.0%) |
| Wholesale Trade | 0 (0.0%) | 0 (0.0%) |
| Retail Trade | 18 (14.7%) | 104 (85.3%) |
| Transportation & Warehousing | 0 (0.0%) | 0 (0.0%) |
| Utilities | 0 (0.0%) | 0 (0.0%) |
| Information | 63 (100.0%) | 0 (0.0%) |
| Finance & Insurance | 0 (0.0%) | 0 (0.0%) |
| Real Estate, Rental & Leasing | 0 (0.0%) | 0 (0.0%) |
| Professional & Scientific | 0 (0.0%) | 11 (100.0%) |
| Enterprise Management | 0 (0.0%) | 0 (0.0%) |
| Administrative & Support | 12 (100.0%) | 0 (0.0%) |
| Educational Services | 6 (60.0%) | 4 (40.0%) |
| Health Care & Social Assistance | 0 (0.0%) | 28 (100.0%) |
| Arts, Entertainment & Recreation | 0 (0.0%) | 0 (0.0%) |
| Accommodation & Food Services | 27 (100.0%) | 0 (0.0%) |
| Public Administration | 85 (36.3%) | 149 (63.7%) |
| Total | 507 (61.2%) | 321 (38.8%) |
Education in Lewiston
School Enrollment in Lewiston
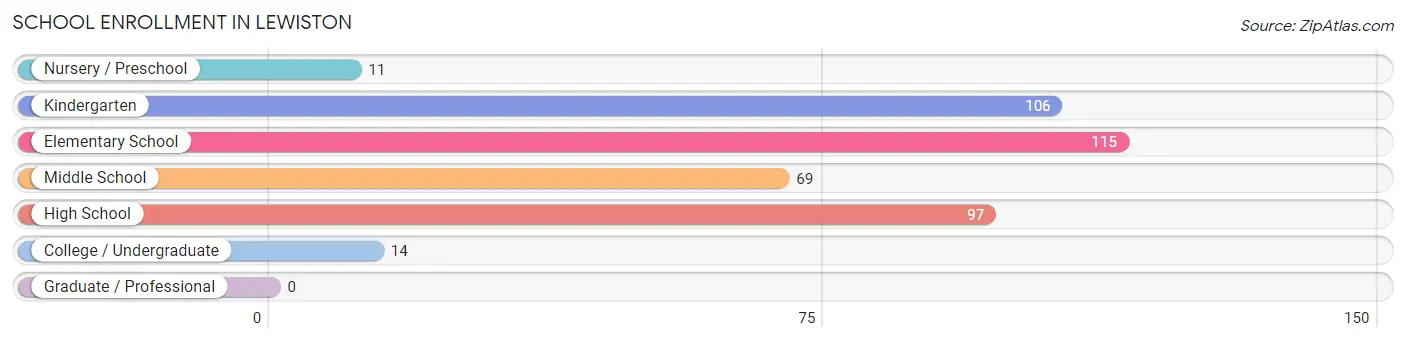
The most common levels of schooling among the 412 students in Lewiston are elementary school (115 | 27.9%), kindergarten (106 | 25.7%), and high school (97 | 23.5%).
| School Level | # Students | % Students |
| Nursery / Preschool | 11 | 2.7% |
| Kindergarten | 106 | 25.7% |
| Elementary School | 115 | 27.9% |
| Middle School | 69 | 16.8% |
| High School | 97 | 23.5% |
| College / Undergraduate | 14 | 3.4% |
| Graduate / Professional | 0 | 0.0% |
| Total | 412 | 100.0% |
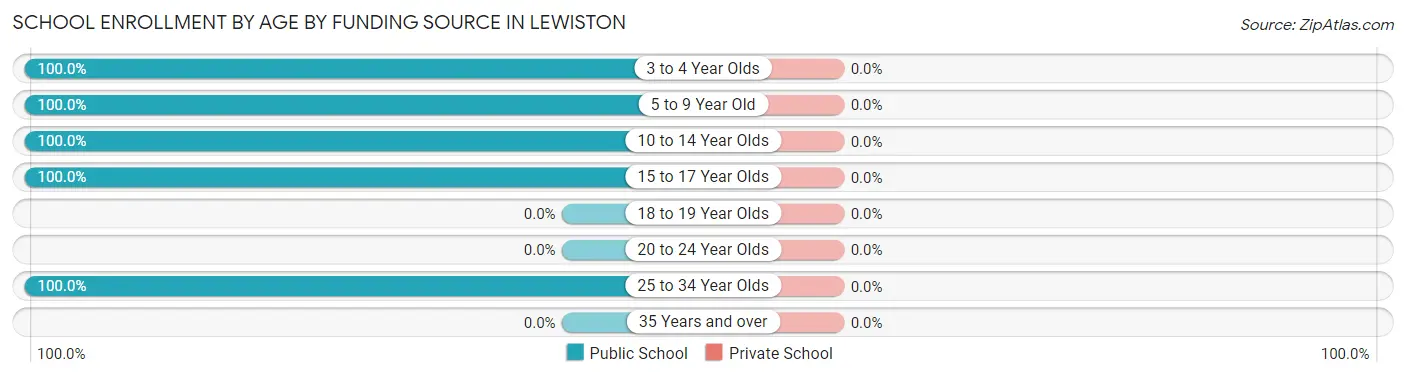
School Enrollment by Age by Funding Source in Lewiston
| Age Bracket | Public School | Private School |
| 3 to 4 Year Olds | 11 (100.0%) | 0 (0.0%) |
| 5 to 9 Year Old | 179 (100.0%) | 0 (0.0%) |
| 10 to 14 Year Olds | 111 (100.0%) | 0 (0.0%) |
| 15 to 17 Year Olds | 97 (100.0%) | 0 (0.0%) |
| 18 to 19 Year Olds | 0 (0.0%) | 0 (0.0%) |
| 20 to 24 Year Olds | 0 (0.0%) | 0 (0.0%) |
| 25 to 34 Year Olds | 14 (100.0%) | 0 (0.0%) |
| 35 Years and over | 0 (0.0%) | 0 (0.0%) |
| Total | 412 (100.0%) | 0 (0.0%) |
Educational Attainment by Field of Study in Lewiston
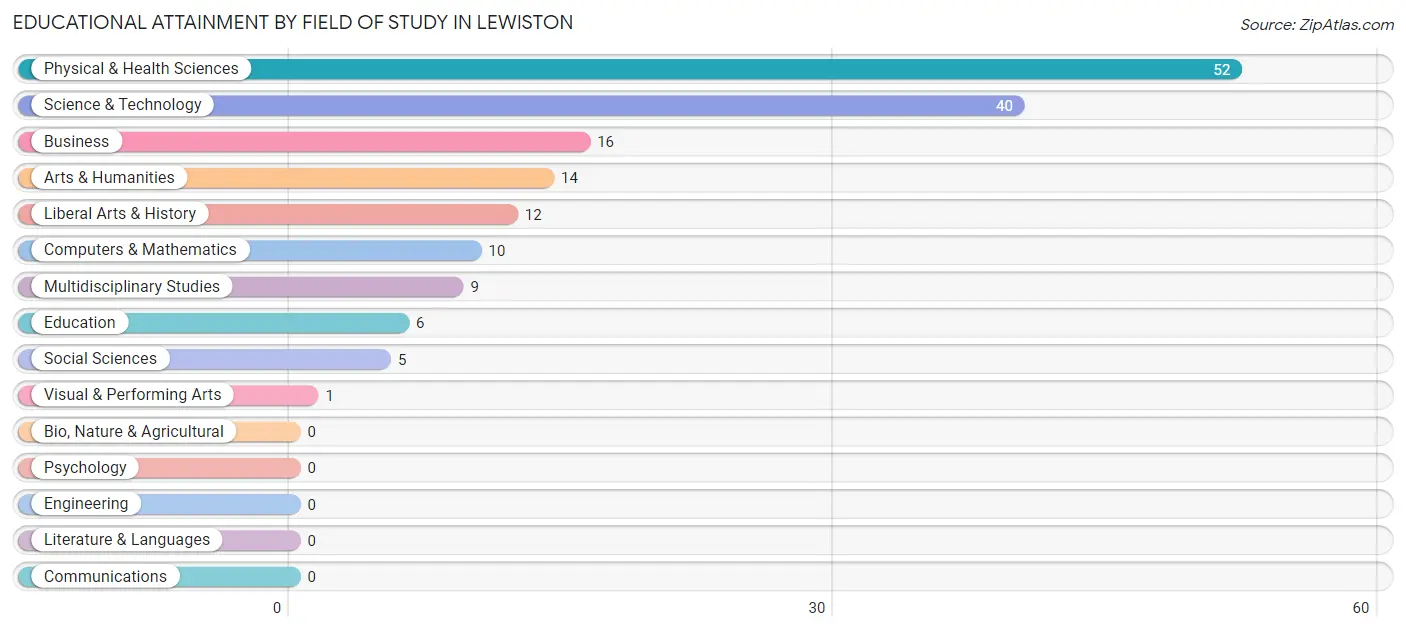
Physical & health sciences (52 | 31.5%), science & technology (40 | 24.2%), business (16 | 9.7%), arts & humanities (14 | 8.5%), and liberal arts & history (12 | 7.3%) are the most common fields of study among 165 individuals in Lewiston who have obtained a bachelor's degree or higher.
| Field of Study | # Graduates | % Graduates |
| Computers & Mathematics | 10 | 6.1% |
| Bio, Nature & Agricultural | 0 | 0.0% |
| Physical & Health Sciences | 52 | 31.5% |
| Psychology | 0 | 0.0% |
| Social Sciences | 5 | 3.0% |
| Engineering | 0 | 0.0% |
| Multidisciplinary Studies | 9 | 5.4% |
| Science & Technology | 40 | 24.2% |
| Business | 16 | 9.7% |
| Education | 6 | 3.6% |
| Literature & Languages | 0 | 0.0% |
| Liberal Arts & History | 12 | 7.3% |
| Visual & Performing Arts | 1 | 0.6% |
| Communications | 0 | 0.0% |
| Arts & Humanities | 14 | 8.5% |
| Total | 165 | 100.0% |
Transportation & Commute in Lewiston
Vehicle Availability by Sex in Lewiston
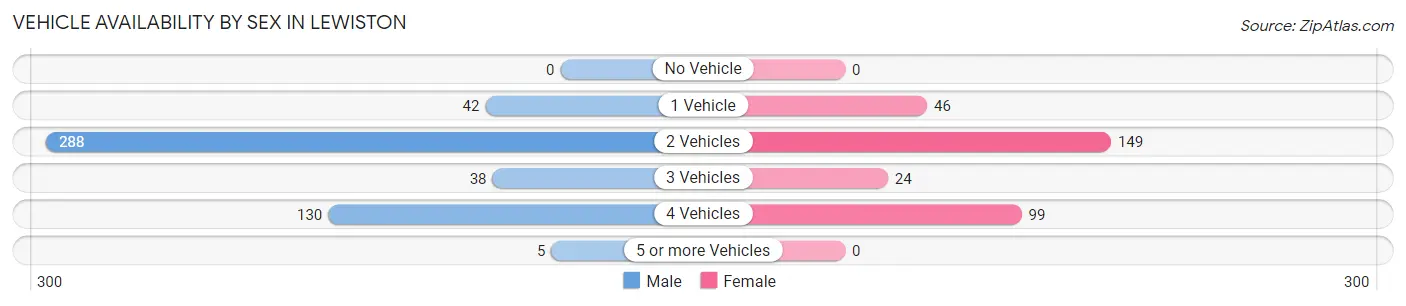
The most prevalent vehicle ownership categories in Lewiston are males with 2 vehicles (288, accounting for 57.3%) and females with 2 vehicles (149, making up 90.6%).
| Vehicles Available | Male | Female |
| No Vehicle | 0 (0.0%) | 0 (0.0%) |
| 1 Vehicle | 42 (8.4%) | 46 (14.5%) |
| 2 Vehicles | 288 (57.3%) | 149 (46.9%) |
| 3 Vehicles | 38 (7.5%) | 24 (7.5%) |
| 4 Vehicles | 130 (25.8%) | 99 (31.1%) |
| 5 or more Vehicles | 5 (1.0%) | 0 (0.0%) |
| Total | 503 (100.0%) | 318 (100.0%) |
Commute Time in Lewiston
The most frequently occuring commute durations in Lewiston are 40 to 44 minutes (174 commuters, 22.5%), 90 or more minutes (165 commuters, 21.4%), and 30 to 34 minutes (146 commuters, 18.9%).
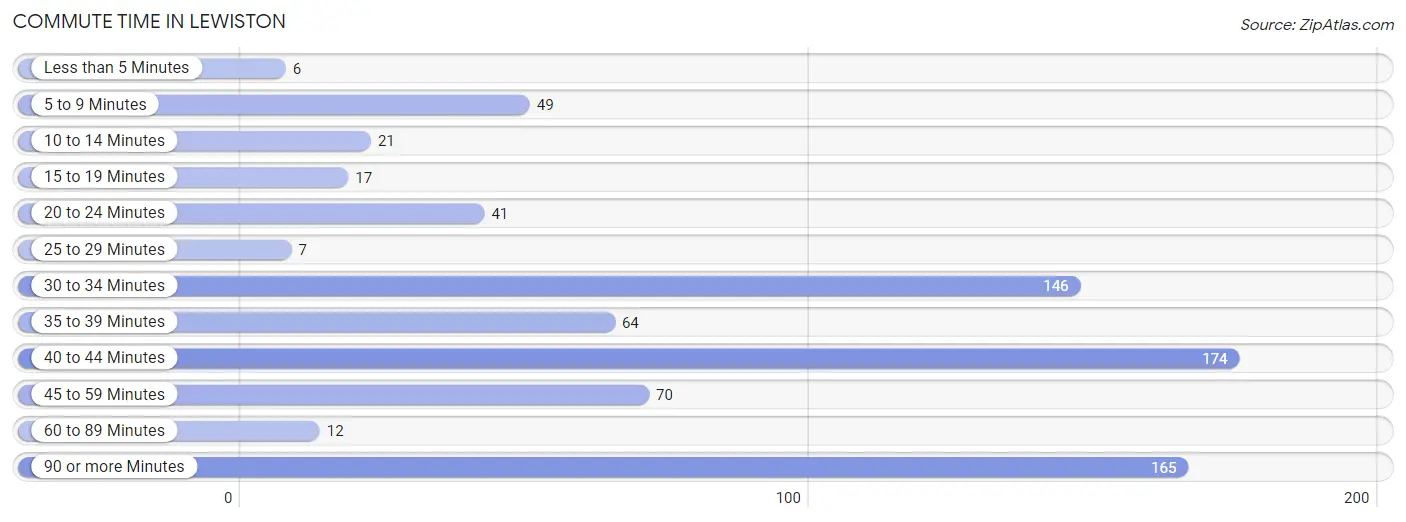
| Commute Time | # Commuters | % Commuters |
| Less than 5 Minutes | 6 | 0.8% |
| 5 to 9 Minutes | 49 | 6.4% |
| 10 to 14 Minutes | 21 | 2.7% |
| 15 to 19 Minutes | 17 | 2.2% |
| 20 to 24 Minutes | 41 | 5.3% |
| 25 to 29 Minutes | 7 | 0.9% |
| 30 to 34 Minutes | 146 | 18.9% |
| 35 to 39 Minutes | 64 | 8.3% |
| 40 to 44 Minutes | 174 | 22.5% |
| 45 to 59 Minutes | 70 | 9.1% |
| 60 to 89 Minutes | 12 | 1.5% |
| 90 or more Minutes | 165 | 21.4% |
Commute Time by Sex in Lewiston
The most common commute times in Lewiston are 90 or more minutes (165 commuters, 34.9%) for males and 30 to 34 minutes (136 commuters, 45.5%) for females.
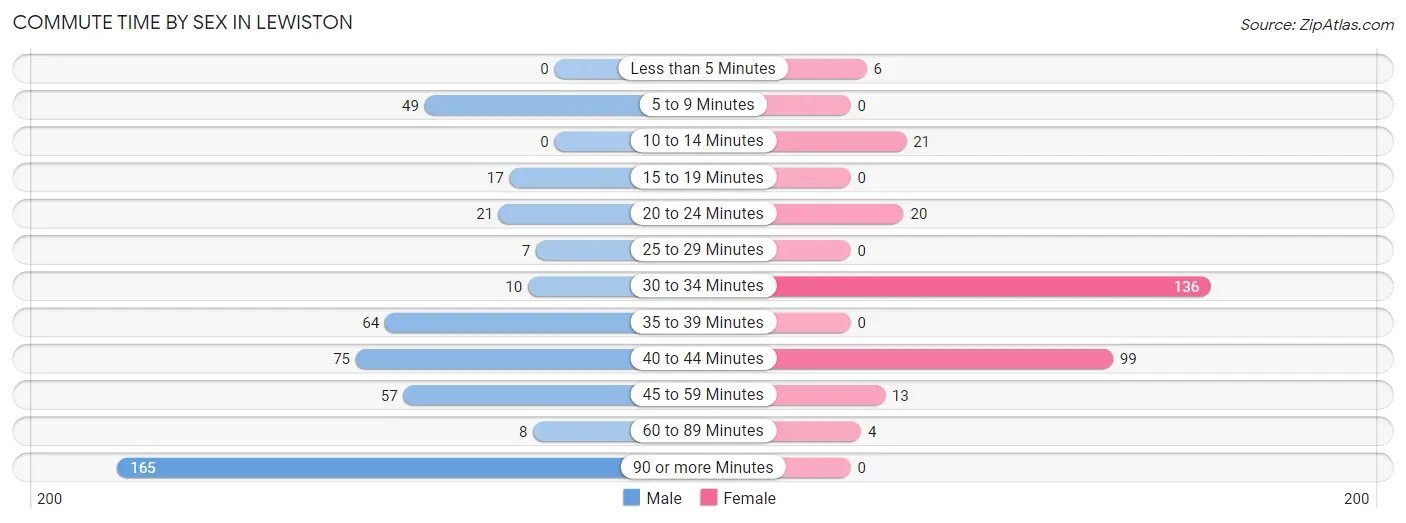
| Commute Time | Male | Female |
| Less than 5 Minutes | 0 (0.0%) | 6 (2.0%) |
| 5 to 9 Minutes | 49 (10.4%) | 0 (0.0%) |
| 10 to 14 Minutes | 0 (0.0%) | 21 (7.0%) |
| 15 to 19 Minutes | 17 (3.6%) | 0 (0.0%) |
| 20 to 24 Minutes | 21 (4.4%) | 20 (6.7%) |
| 25 to 29 Minutes | 7 (1.5%) | 0 (0.0%) |
| 30 to 34 Minutes | 10 (2.1%) | 136 (45.5%) |
| 35 to 39 Minutes | 64 (13.5%) | 0 (0.0%) |
| 40 to 44 Minutes | 75 (15.9%) | 99 (33.1%) |
| 45 to 59 Minutes | 57 (12.0%) | 13 (4.3%) |
| 60 to 89 Minutes | 8 (1.7%) | 4 (1.3%) |
| 90 or more Minutes | 165 (34.9%) | 0 (0.0%) |
Time of Departure to Work by Sex in Lewiston
The most frequent times of departure to work in Lewiston are 12:00 AM to 4:59 AM (174, 36.8%) for males and 7:30 AM to 7:59 AM (66, 22.1%) for females.
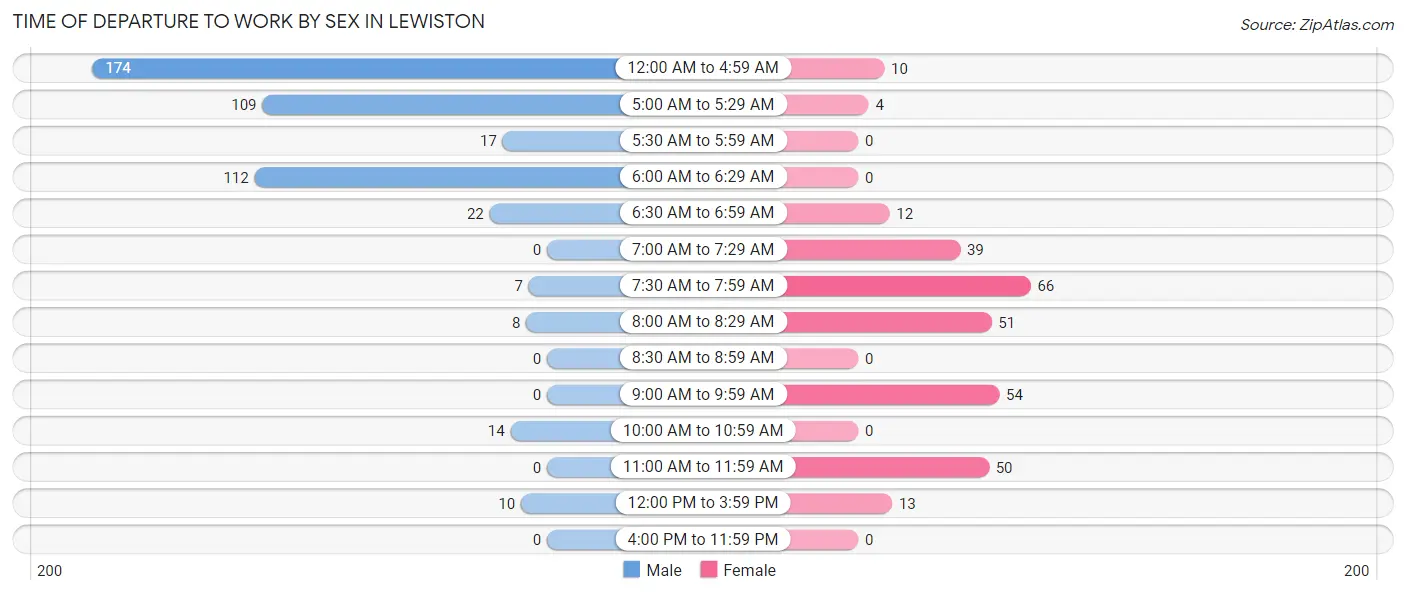
| Time of Departure | Male | Female |
| 12:00 AM to 4:59 AM | 174 (36.8%) | 10 (3.3%) |
| 5:00 AM to 5:29 AM | 109 (23.0%) | 4 (1.3%) |
| 5:30 AM to 5:59 AM | 17 (3.6%) | 0 (0.0%) |
| 6:00 AM to 6:29 AM | 112 (23.7%) | 0 (0.0%) |
| 6:30 AM to 6:59 AM | 22 (4.6%) | 12 (4.0%) |
| 7:00 AM to 7:29 AM | 0 (0.0%) | 39 (13.0%) |
| 7:30 AM to 7:59 AM | 7 (1.5%) | 66 (22.1%) |
| 8:00 AM to 8:29 AM | 8 (1.7%) | 51 (17.1%) |
| 8:30 AM to 8:59 AM | 0 (0.0%) | 0 (0.0%) |
| 9:00 AM to 9:59 AM | 0 (0.0%) | 54 (18.1%) |
| 10:00 AM to 10:59 AM | 14 (3.0%) | 0 (0.0%) |
| 11:00 AM to 11:59 AM | 0 (0.0%) | 50 (16.7%) |
| 12:00 PM to 3:59 PM | 10 (2.1%) | 13 (4.3%) |
| 4:00 PM to 11:59 PM | 0 (0.0%) | 0 (0.0%) |
| Total | 473 (100.0%) | 299 (100.0%) |
Housing Occupancy in Lewiston
Occupancy by Ownership in Lewiston
Of the total 484 dwellings in Lewiston, owner-occupied units account for 358 (74.0%), while renter-occupied units make up 126 (26.0%).
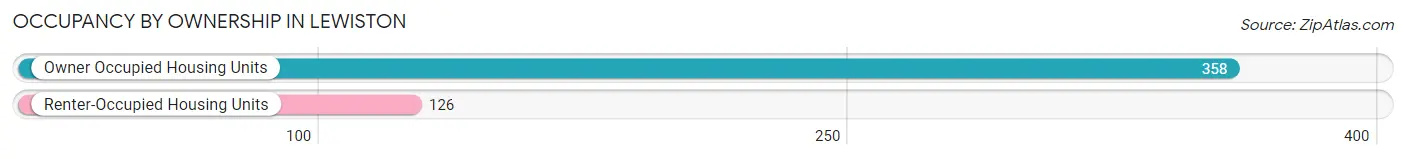
| Occupancy | # Housing Units | % Housing Units |
| Owner Occupied Housing Units | 358 | 74.0% |
| Renter-Occupied Housing Units | 126 | 26.0% |
| Total Occupied Housing Units | 484 | 100.0% |
Occupancy by Household Size in Lewiston
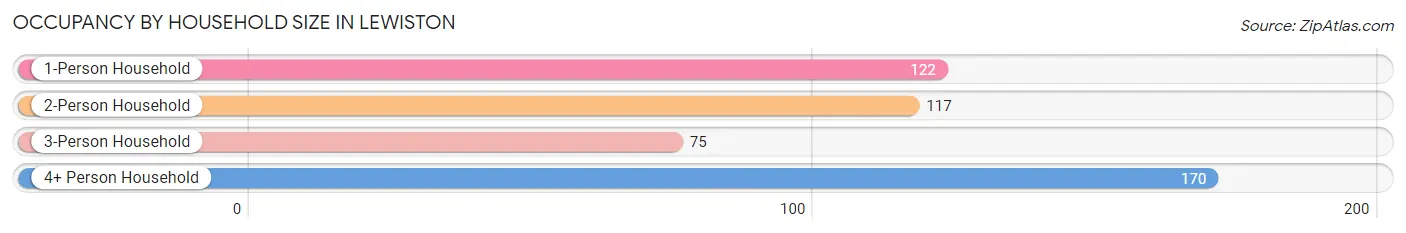
| Household Size | # Housing Units | % Housing Units |
| 1-Person Household | 122 | 25.2% |
| 2-Person Household | 117 | 24.2% |
| 3-Person Household | 75 | 15.5% |
| 4+ Person Household | 170 | 35.1% |
| Total Housing Units | 484 | 100.0% |
Occupancy by Ownership by Household Size in Lewiston
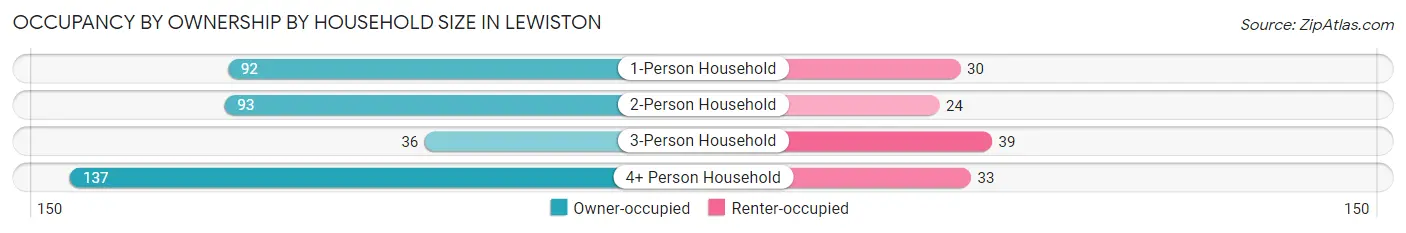
| Household Size | Owner-occupied | Renter-occupied |
| 1-Person Household | 92 (75.4%) | 30 (24.6%) |
| 2-Person Household | 93 (79.5%) | 24 (20.5%) |
| 3-Person Household | 36 (48.0%) | 39 (52.0%) |
| 4+ Person Household | 137 (80.6%) | 33 (19.4%) |
| Total Housing Units | 358 (74.0%) | 126 (26.0%) |
Occupancy by Educational Attainment in Lewiston
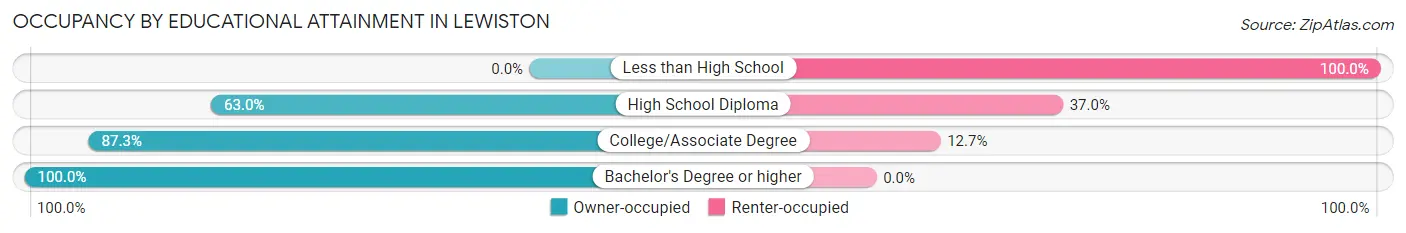
| Household Size | Owner-occupied | Renter-occupied |
| Less than High School | 0 (0.0%) | 11 (100.0%) |
| High School Diploma | 155 (63.0%) | 91 (37.0%) |
| College/Associate Degree | 165 (87.3%) | 24 (12.7%) |
| Bachelor's Degree or higher | 38 (100.0%) | 0 (0.0%) |
Occupancy by Age of Householder in Lewiston
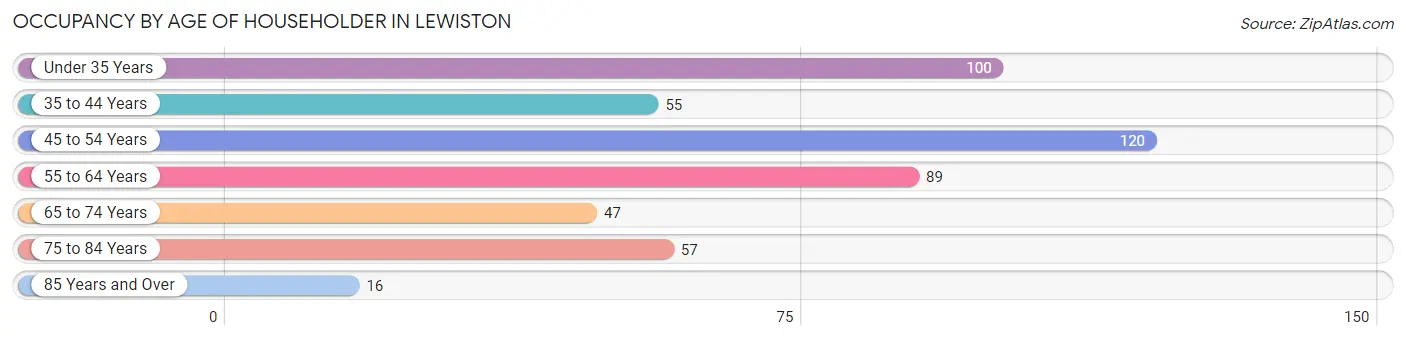
| Age Bracket | # Households | % Households |
| Under 35 Years | 100 | 20.7% |
| 35 to 44 Years | 55 | 11.4% |
| 45 to 54 Years | 120 | 24.8% |
| 55 to 64 Years | 89 | 18.4% |
| 65 to 74 Years | 47 | 9.7% |
| 75 to 84 Years | 57 | 11.8% |
| 85 Years and Over | 16 | 3.3% |
| Total | 484 | 100.0% |
Housing Finances in Lewiston
Median Income by Occupancy in Lewiston
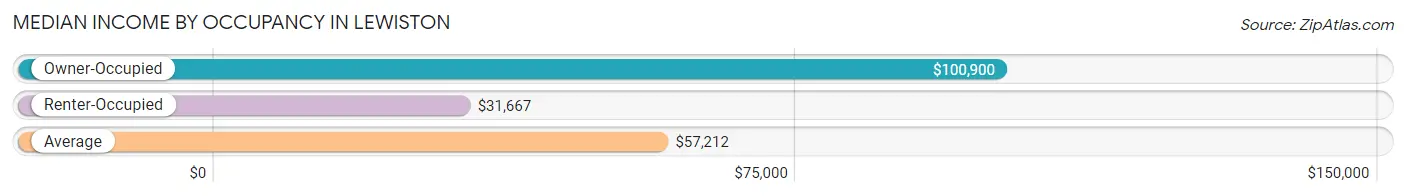
| Occupancy Type | # Households | Median Income |
| Owner-Occupied | 358 (74.0%) | $100,900 |
| Renter-Occupied | 126 (26.0%) | $31,667 |
| Average | 484 (100.0%) | $57,212 |
Occupancy by Householder Income Bracket in Lewiston
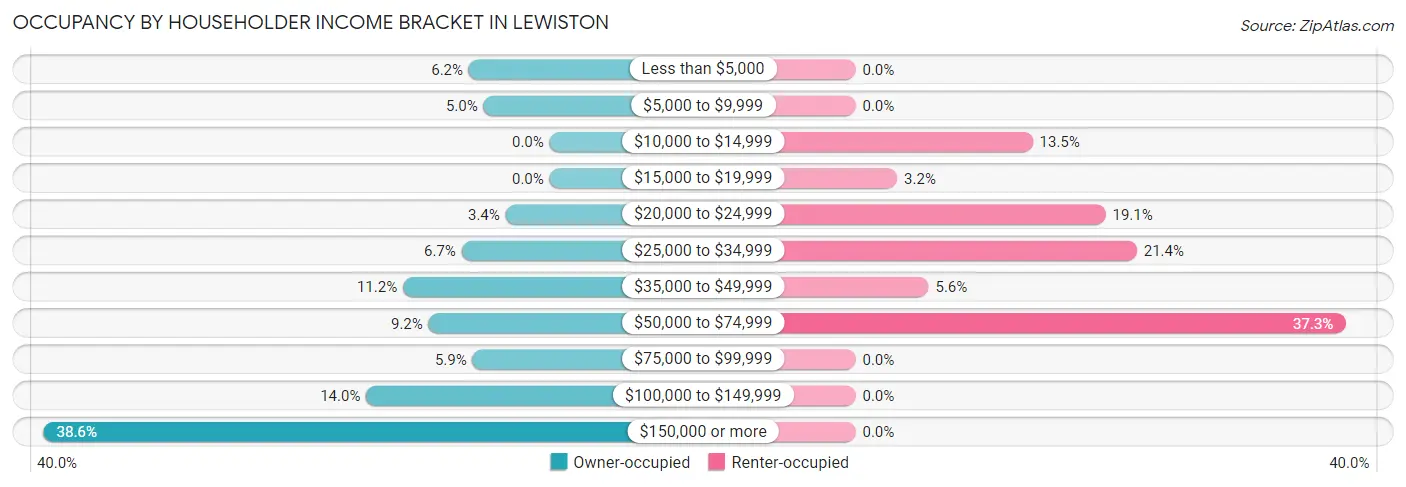
| Income Bracket | Owner-occupied | Renter-occupied |
| Less than $5,000 | 22 (6.1%) | 0 (0.0%) |
| $5,000 to $9,999 | 18 (5.0%) | 0 (0.0%) |
| $10,000 to $14,999 | 0 (0.0%) | 17 (13.5%) |
| $15,000 to $19,999 | 0 (0.0%) | 4 (3.2%) |
| $20,000 to $24,999 | 12 (3.4%) | 24 (19.1%) |
| $25,000 to $34,999 | 24 (6.7%) | 27 (21.4%) |
| $35,000 to $49,999 | 40 (11.2%) | 7 (5.6%) |
| $50,000 to $74,999 | 33 (9.2%) | 47 (37.3%) |
| $75,000 to $99,999 | 21 (5.9%) | 0 (0.0%) |
| $100,000 to $149,999 | 50 (14.0%) | 0 (0.0%) |
| $150,000 or more | 138 (38.6%) | 0 (0.0%) |
| Total | 358 (100.0%) | 126 (100.0%) |
Monthly Housing Cost Tiers in Lewiston
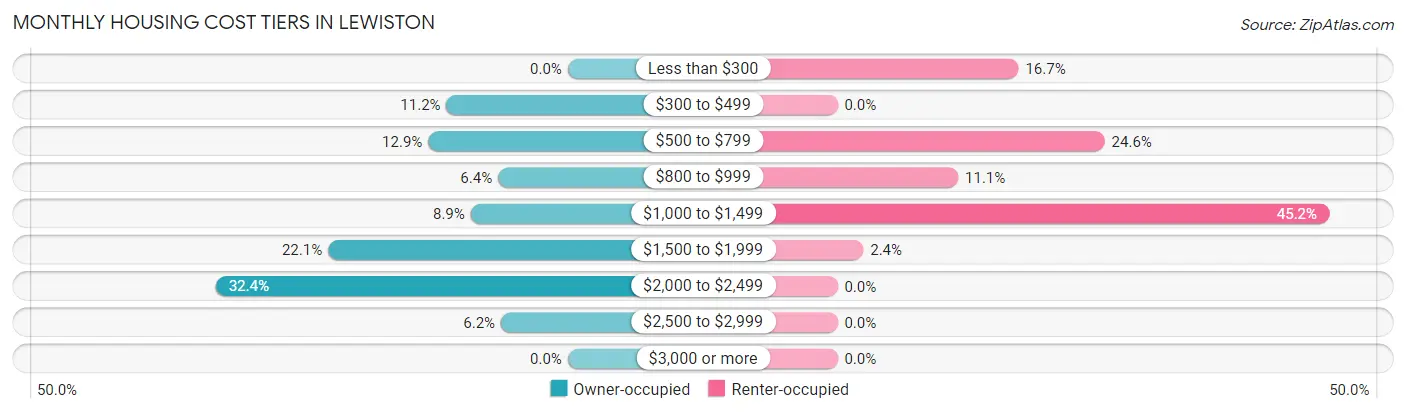
| Monthly Cost | Owner-occupied | Renter-occupied |
| Less than $300 | 0 (0.0%) | 21 (16.7%) |
| $300 to $499 | 40 (11.2%) | 0 (0.0%) |
| $500 to $799 | 46 (12.9%) | 31 (24.6%) |
| $800 to $999 | 23 (6.4%) | 14 (11.1%) |
| $1,000 to $1,499 | 32 (8.9%) | 57 (45.2%) |
| $1,500 to $1,999 | 79 (22.1%) | 3 (2.4%) |
| $2,000 to $2,499 | 116 (32.4%) | 0 (0.0%) |
| $2,500 to $2,999 | 22 (6.1%) | 0 (0.0%) |
| $3,000 or more | 0 (0.0%) | 0 (0.0%) |
| Total | 358 (100.0%) | 126 (100.0%) |
Physical Housing Characteristics in Lewiston
Housing Structures in Lewiston
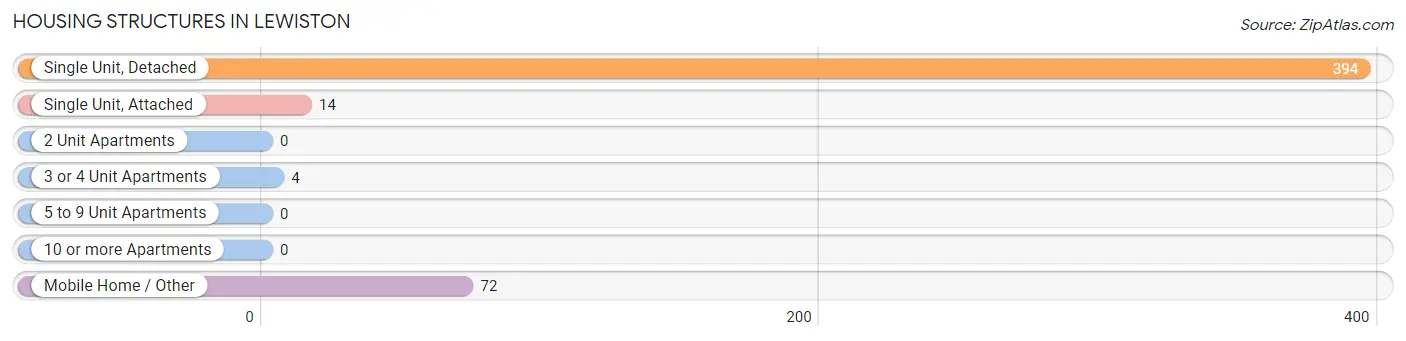
| Structure Type | # Housing Units | % Housing Units |
| Single Unit, Detached | 394 | 81.4% |
| Single Unit, Attached | 14 | 2.9% |
| 2 Unit Apartments | 0 | 0.0% |
| 3 or 4 Unit Apartments | 4 | 0.8% |
| 5 to 9 Unit Apartments | 0 | 0.0% |
| 10 or more Apartments | 0 | 0.0% |
| Mobile Home / Other | 72 | 14.9% |
| Total | 484 | 100.0% |
Housing Structures by Occupancy in Lewiston
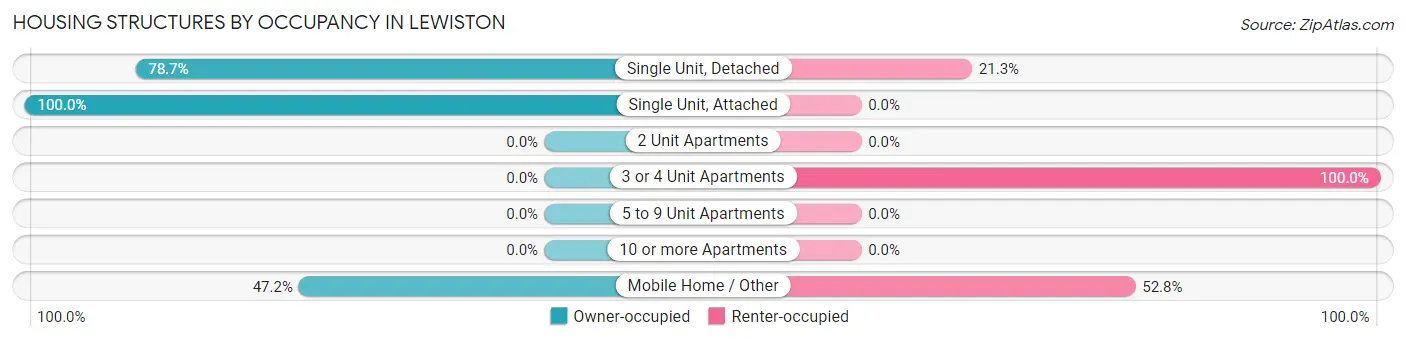
| Structure Type | Owner-occupied | Renter-occupied |
| Single Unit, Detached | 310 (78.7%) | 84 (21.3%) |
| Single Unit, Attached | 14 (100.0%) | 0 (0.0%) |
| 2 Unit Apartments | 0 (0.0%) | 0 (0.0%) |
| 3 or 4 Unit Apartments | 0 (0.0%) | 4 (100.0%) |
| 5 to 9 Unit Apartments | 0 (0.0%) | 0 (0.0%) |
| 10 or more Apartments | 0 (0.0%) | 0 (0.0%) |
| Mobile Home / Other | 34 (47.2%) | 38 (52.8%) |
| Total | 358 (74.0%) | 126 (26.0%) |
Housing Structures by Number of Rooms in Lewiston
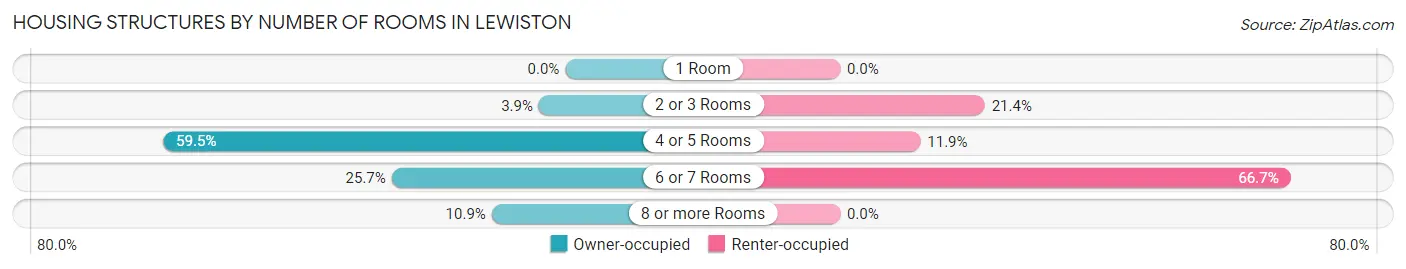
| Number of Rooms | Owner-occupied | Renter-occupied |
| 1 Room | 0 (0.0%) | 0 (0.0%) |
| 2 or 3 Rooms | 14 (3.9%) | 27 (21.4%) |
| 4 or 5 Rooms | 213 (59.5%) | 15 (11.9%) |
| 6 or 7 Rooms | 92 (25.7%) | 84 (66.7%) |
| 8 or more Rooms | 39 (10.9%) | 0 (0.0%) |
| Total | 358 (100.0%) | 126 (100.0%) |
Housing Structure by Heating Type in Lewiston
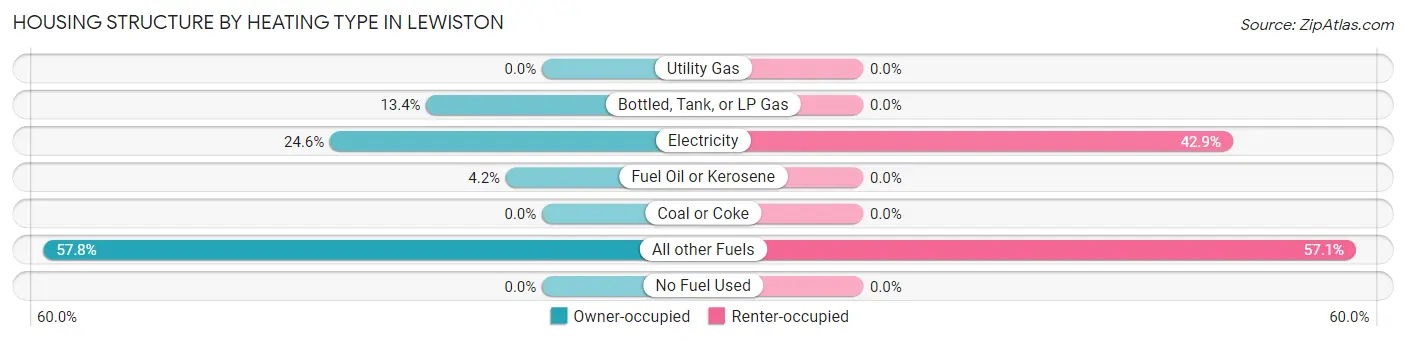
| Heating Type | Owner-occupied | Renter-occupied |
| Utility Gas | 0 (0.0%) | 0 (0.0%) |
| Bottled, Tank, or LP Gas | 48 (13.4%) | 0 (0.0%) |
| Electricity | 88 (24.6%) | 54 (42.9%) |
| Fuel Oil or Kerosene | 15 (4.2%) | 0 (0.0%) |
| Coal or Coke | 0 (0.0%) | 0 (0.0%) |
| All other Fuels | 207 (57.8%) | 72 (57.1%) |
| No Fuel Used | 0 (0.0%) | 0 (0.0%) |
| Total | 358 (100.0%) | 126 (100.0%) |
Household Vehicle Usage in Lewiston
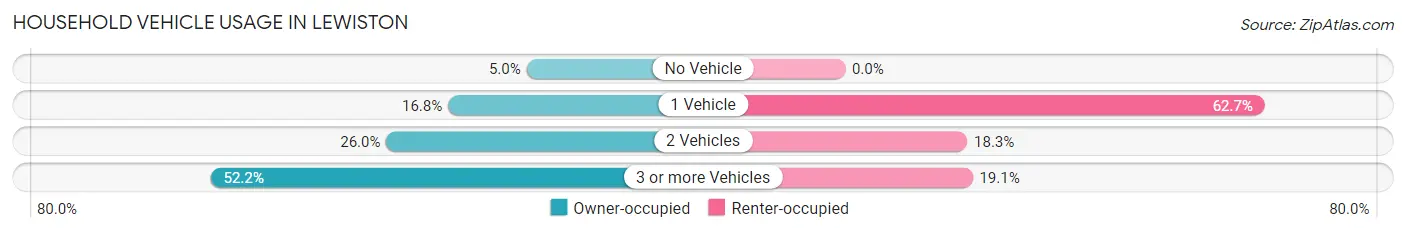
| Vehicles per Household | Owner-occupied | Renter-occupied |
| No Vehicle | 18 (5.0%) | 0 (0.0%) |
| 1 Vehicle | 60 (16.8%) | 79 (62.7%) |
| 2 Vehicles | 93 (26.0%) | 23 (18.2%) |
| 3 or more Vehicles | 187 (52.2%) | 24 (19.1%) |
| Total | 358 (100.0%) | 126 (100.0%) |
Real Estate & Mortgages in Lewiston
Real Estate and Mortgage Overview in Lewiston
| Characteristic | Without Mortgage | With Mortgage |
| Housing Units | 89 | 269 |
| Median Property Value | $337,500 | $342,700 |
| Median Household Income | $44,844 | $138 |
| Monthly Housing Costs | $524 | $0 |
| Real Estate Taxes | $1,886 | $0 |
Property Value by Mortgage Status in Lewiston
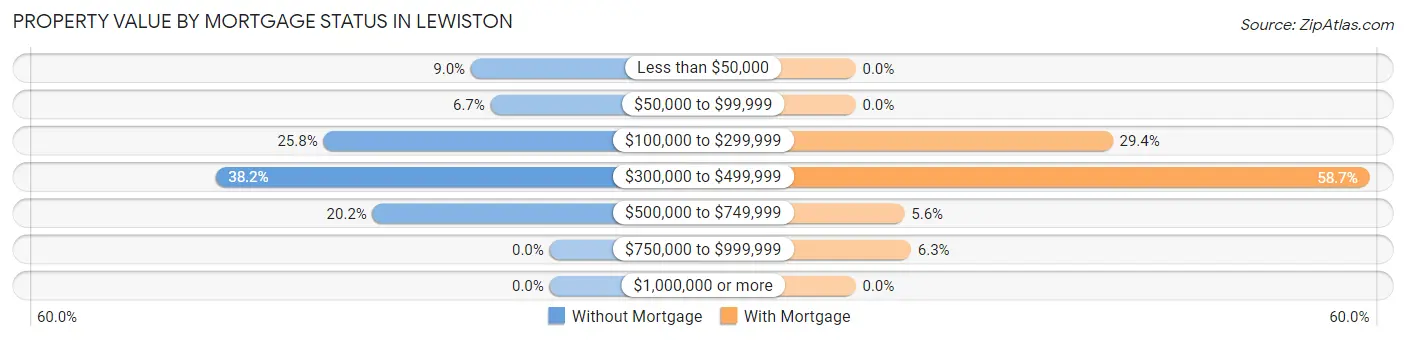
| Property Value | Without Mortgage | With Mortgage |
| Less than $50,000 | 8 (9.0%) | 0 (0.0%) |
| $50,000 to $99,999 | 6 (6.7%) | 0 (0.0%) |
| $100,000 to $299,999 | 23 (25.8%) | 79 (29.4%) |
| $300,000 to $499,999 | 34 (38.2%) | 158 (58.7%) |
| $500,000 to $749,999 | 18 (20.2%) | 15 (5.6%) |
| $750,000 to $999,999 | 0 (0.0%) | 17 (6.3%) |
| $1,000,000 or more | 0 (0.0%) | 0 (0.0%) |
| Total | 89 (100.0%) | 269 (100.0%) |
Household Income by Mortgage Status in Lewiston
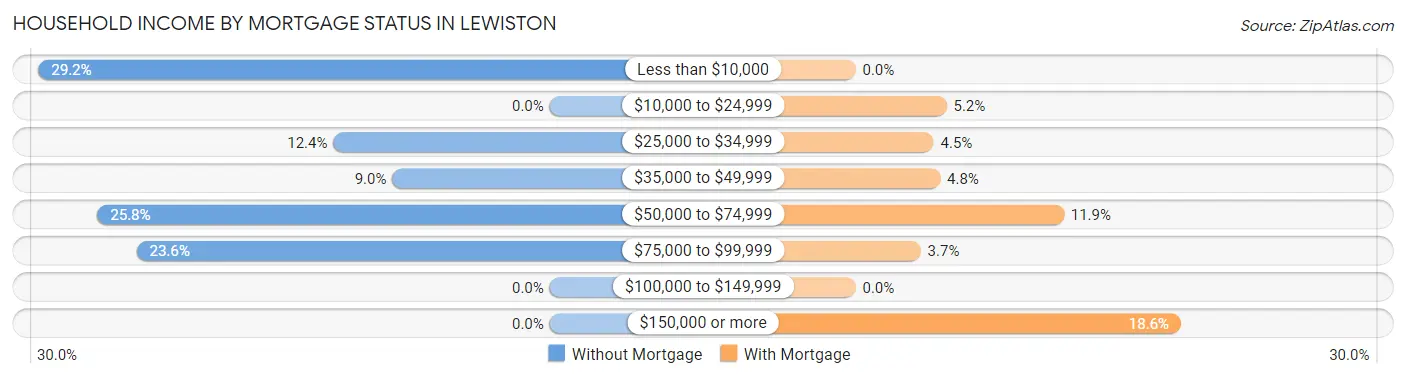
| Household Income | Without Mortgage | With Mortgage |
| Less than $10,000 | 26 (29.2%) | 0 (0.0%) |
| $10,000 to $24,999 | 0 (0.0%) | 14 (5.2%) |
| $25,000 to $34,999 | 11 (12.4%) | 12 (4.5%) |
| $35,000 to $49,999 | 8 (9.0%) | 13 (4.8%) |
| $50,000 to $74,999 | 23 (25.8%) | 32 (11.9%) |
| $75,000 to $99,999 | 21 (23.6%) | 10 (3.7%) |
| $100,000 to $149,999 | 0 (0.0%) | 0 (0.0%) |
| $150,000 or more | 0 (0.0%) | 50 (18.6%) |
| Total | 89 (100.0%) | 269 (100.0%) |
Property Value to Household Income Ratio in Lewiston
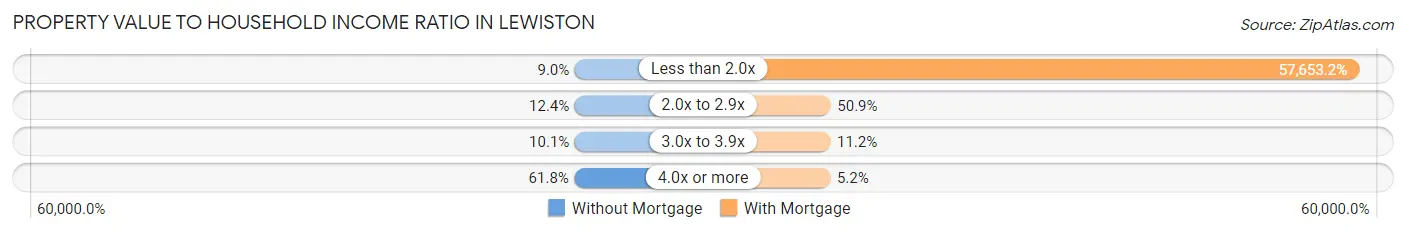
| Value-to-Income Ratio | Without Mortgage | With Mortgage |
| Less than 2.0x | 8 (9.0%) | 155,087 (57,653.2%) |
| 2.0x to 2.9x | 11 (12.4%) | 137 (50.9%) |
| 3.0x to 3.9x | 9 (10.1%) | 30 (11.2%) |
| 4.0x or more | 55 (61.8%) | 14 (5.2%) |
| Total | 89 (100.0%) | 269 (100.0%) |
Real Estate Taxes by Mortgage Status in Lewiston
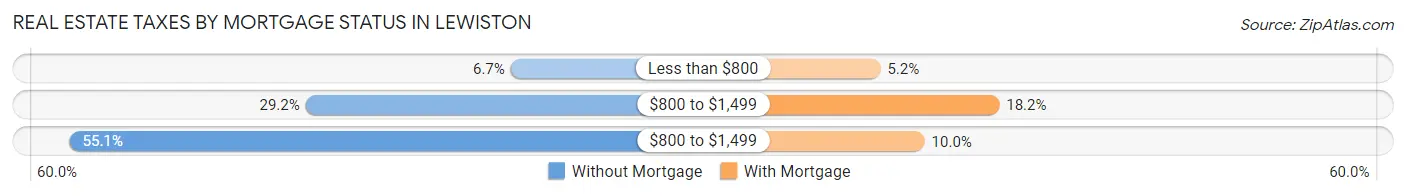
| Property Taxes | Without Mortgage | With Mortgage |
| Less than $800 | 6 (6.7%) | 14 (5.2%) |
| $800 to $1,499 | 26 (29.2%) | 49 (18.2%) |
| $800 to $1,499 | 49 (55.1%) | 27 (10.0%) |
| Total | 89 (100.0%) | 269 (100.0%) |
Health & Disability in Lewiston
Health Insurance Coverage by Age in Lewiston
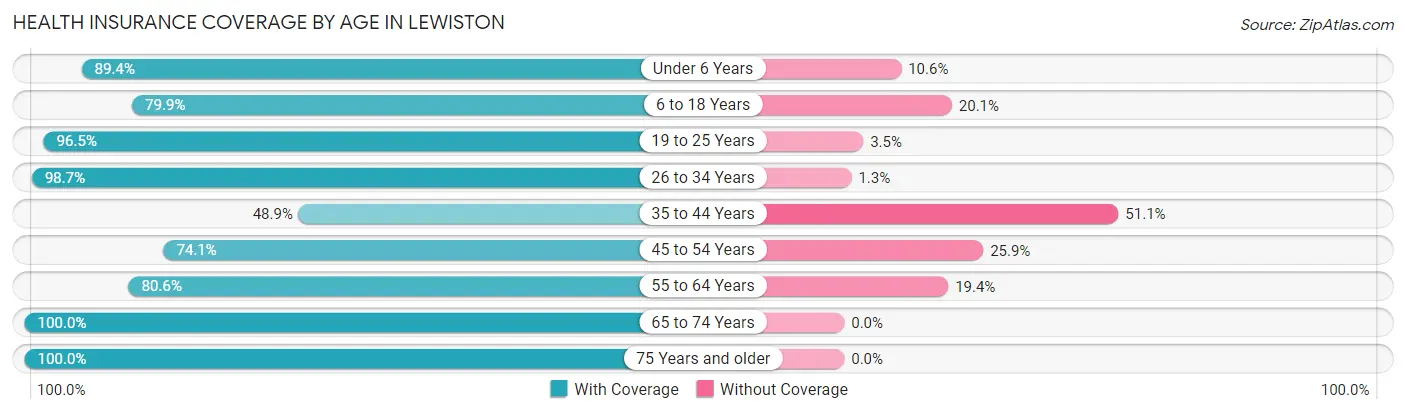
| Age Bracket | With Coverage | Without Coverage |
| Under 6 Years | 261 (89.4%) | 31 (10.6%) |
| 6 to 18 Years | 255 (79.9%) | 64 (20.1%) |
| 19 to 25 Years | 82 (96.5%) | 3 (3.5%) |
| 26 to 34 Years | 294 (98.7%) | 4 (1.3%) |
| 35 to 44 Years | 175 (48.9%) | 183 (51.1%) |
| 45 to 54 Years | 309 (74.1%) | 108 (25.9%) |
| 55 to 64 Years | 208 (80.6%) | 50 (19.4%) |
| 65 to 74 Years | 84 (100.0%) | 0 (0.0%) |
| 75 Years and older | 107 (100.0%) | 0 (0.0%) |
| Total | 1,775 (80.0%) | 443 (20.0%) |
Health Insurance Coverage by Citizenship Status in Lewiston
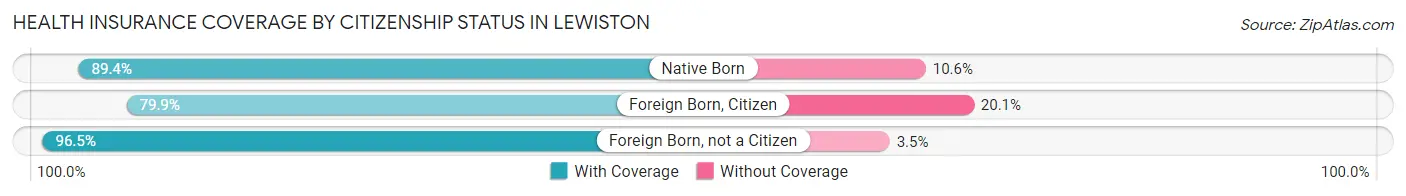
| Citizenship Status | With Coverage | Without Coverage |
| Native Born | 261 (89.4%) | 31 (10.6%) |
| Foreign Born, Citizen | 255 (79.9%) | 64 (20.1%) |
| Foreign Born, not a Citizen | 82 (96.5%) | 3 (3.5%) |
Health Insurance Coverage by Household Income in Lewiston
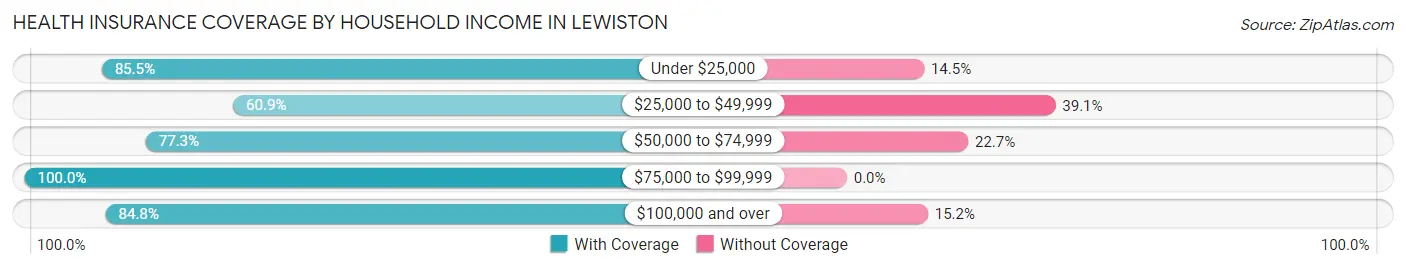
| Household Income | With Coverage | Without Coverage |
| Under $25,000 | 142 (85.5%) | 24 (14.5%) |
| $25,000 to $49,999 | 212 (60.9%) | 136 (39.1%) |
| $50,000 to $74,999 | 534 (77.3%) | 157 (22.7%) |
| $75,000 to $99,999 | 181 (100.0%) | 0 (0.0%) |
| $100,000 and over | 704 (84.8%) | 126 (15.2%) |
Public vs Private Health Insurance Coverage by Age in Lewiston
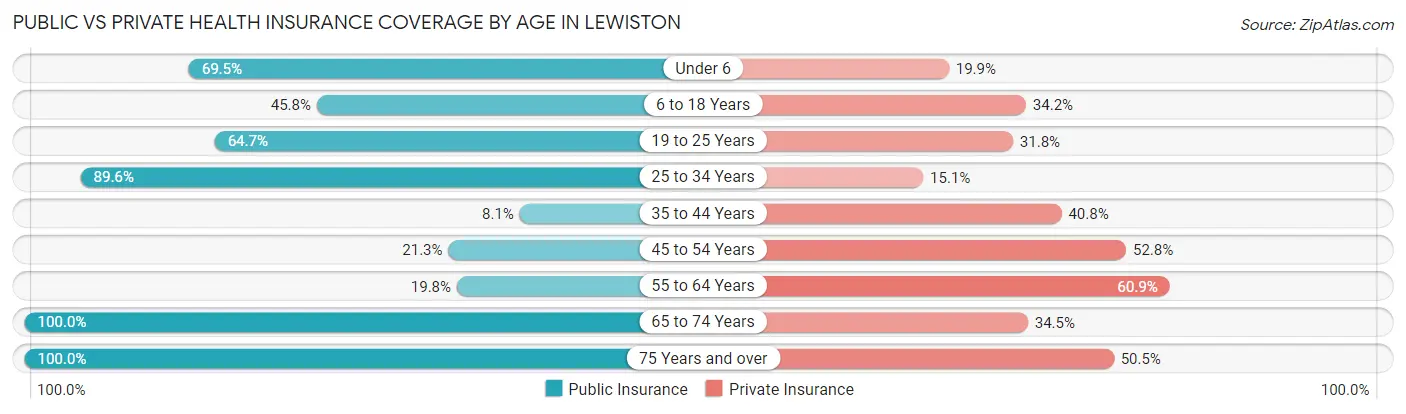
| Age Bracket | Public Insurance | Private Insurance |
| Under 6 | 203 (69.5%) | 58 (19.9%) |
| 6 to 18 Years | 146 (45.8%) | 109 (34.2%) |
| 19 to 25 Years | 55 (64.7%) | 27 (31.8%) |
| 25 to 34 Years | 267 (89.6%) | 45 (15.1%) |
| 35 to 44 Years | 29 (8.1%) | 146 (40.8%) |
| 45 to 54 Years | 89 (21.3%) | 220 (52.8%) |
| 55 to 64 Years | 51 (19.8%) | 157 (60.9%) |
| 65 to 74 Years | 84 (100.0%) | 29 (34.5%) |
| 75 Years and over | 107 (100.0%) | 54 (50.5%) |
| Total | 1,031 (46.5%) | 845 (38.1%) |
Disability Status by Sex by Age in Lewiston
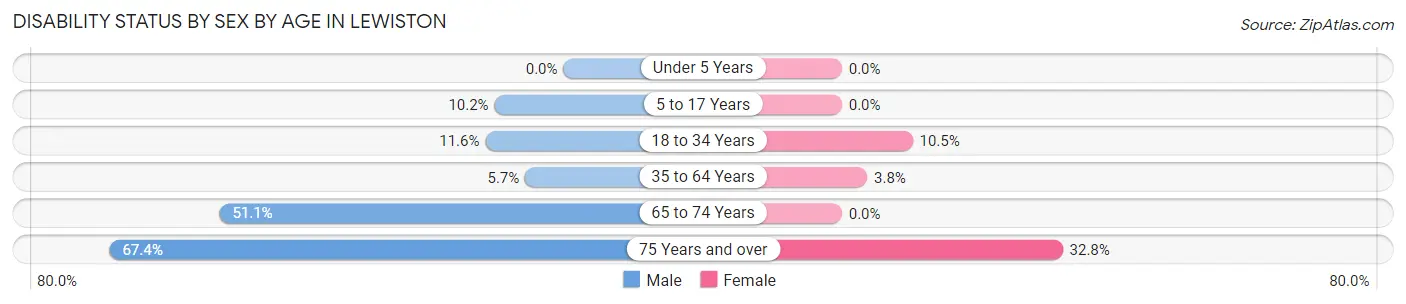
| Age Bracket | Male | Female |
| Under 5 Years | 0 (0.0%) | 0 (0.0%) |
| 5 to 17 Years | 18 (10.2%) | 0 (0.0%) |
| 18 to 34 Years | 19 (11.6%) | 23 (10.5%) |
| 35 to 64 Years | 27 (5.7%) | 21 (3.8%) |
| 65 to 74 Years | 24 (51.1%) | 0 (0.0%) |
| 75 Years and over | 31 (67.4%) | 20 (32.8%) |
Disability Class by Sex by Age in Lewiston
Disability Class: Hearing Difficulty
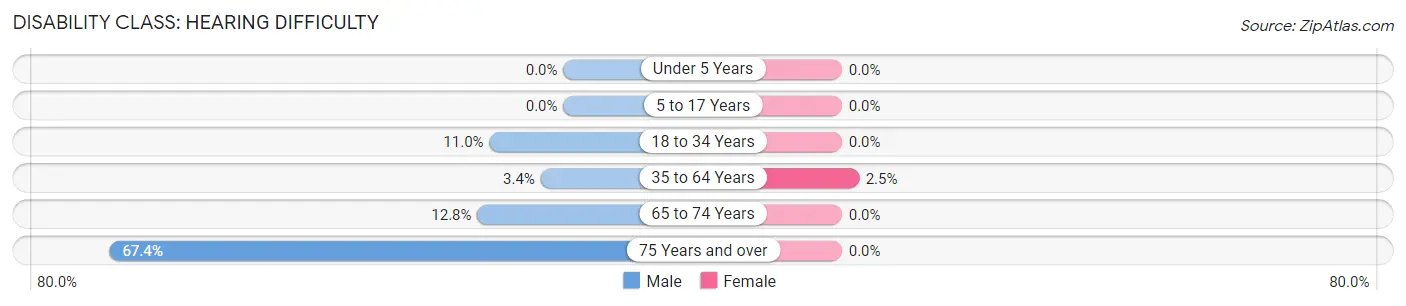
| Age Bracket | Male | Female |
| Under 5 Years | 0 (0.0%) | 0 (0.0%) |
| 5 to 17 Years | 0 (0.0%) | 0 (0.0%) |
| 18 to 34 Years | 18 (11.0%) | 0 (0.0%) |
| 35 to 64 Years | 16 (3.4%) | 14 (2.5%) |
| 65 to 74 Years | 6 (12.8%) | 0 (0.0%) |
| 75 Years and over | 31 (67.4%) | 0 (0.0%) |
Disability Class: Vision Difficulty
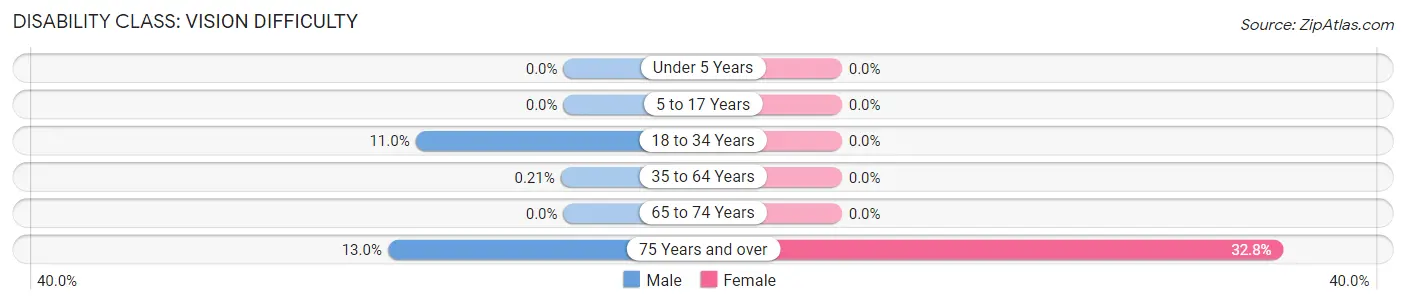
| Age Bracket | Male | Female |
| Under 5 Years | 0 (0.0%) | 0 (0.0%) |
| 5 to 17 Years | 0 (0.0%) | 0 (0.0%) |
| 18 to 34 Years | 18 (11.0%) | 0 (0.0%) |
| 35 to 64 Years | 1 (0.2%) | 0 (0.0%) |
| 65 to 74 Years | 0 (0.0%) | 0 (0.0%) |
| 75 Years and over | 6 (13.0%) | 20 (32.8%) |
Disability Class: Cognitive Difficulty
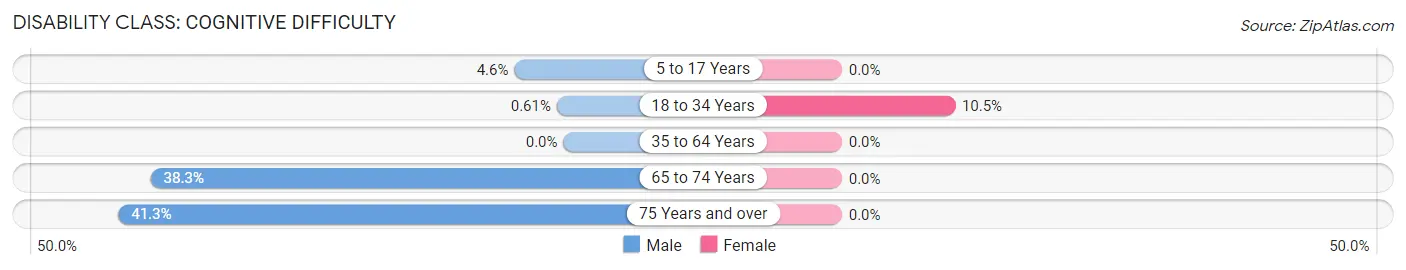
| Age Bracket | Male | Female |
| 5 to 17 Years | 8 (4.5%) | 0 (0.0%) |
| 18 to 34 Years | 1 (0.6%) | 23 (10.5%) |
| 35 to 64 Years | 0 (0.0%) | 0 (0.0%) |
| 65 to 74 Years | 18 (38.3%) | 0 (0.0%) |
| 75 Years and over | 19 (41.3%) | 0 (0.0%) |
Disability Class: Ambulatory Difficulty
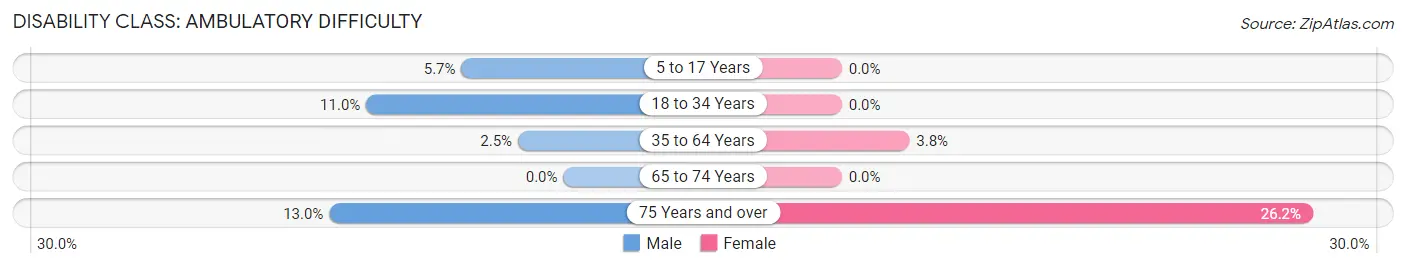
| Age Bracket | Male | Female |
| 5 to 17 Years | 10 (5.7%) | 0 (0.0%) |
| 18 to 34 Years | 18 (11.0%) | 0 (0.0%) |
| 35 to 64 Years | 12 (2.5%) | 21 (3.8%) |
| 65 to 74 Years | 0 (0.0%) | 0 (0.0%) |
| 75 Years and over | 6 (13.0%) | 16 (26.2%) |
Disability Class: Self-Care Difficulty
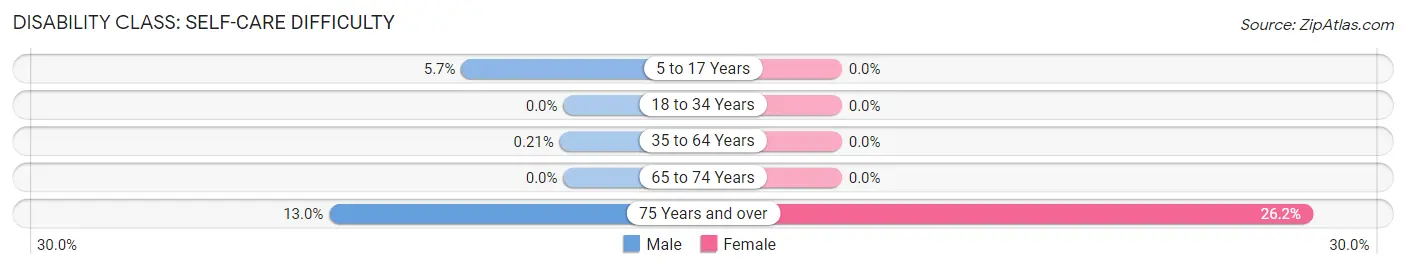
| Age Bracket | Male | Female |
| 5 to 17 Years | 10 (5.7%) | 0 (0.0%) |
| 18 to 34 Years | 0 (0.0%) | 0 (0.0%) |
| 35 to 64 Years | 1 (0.2%) | 0 (0.0%) |
| 65 to 74 Years | 0 (0.0%) | 0 (0.0%) |
| 75 Years and over | 6 (13.0%) | 16 (26.2%) |
Technology Access in Lewiston
Computing Device Access in Lewiston
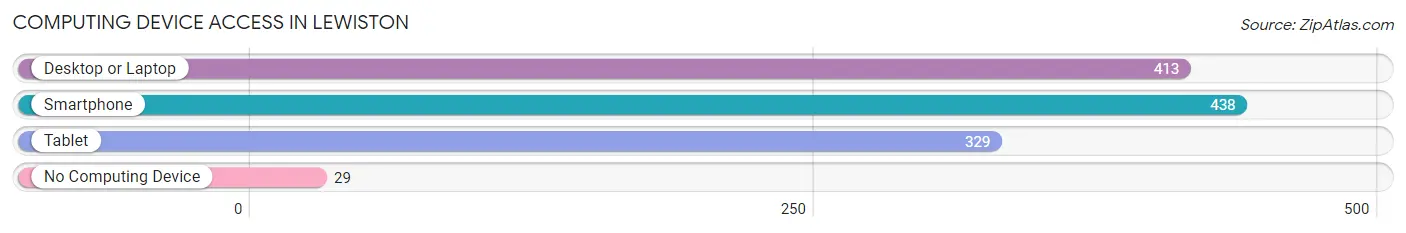
| Device Type | # Households | % Households |
| Desktop or Laptop | 413 | 85.3% |
| Smartphone | 438 | 90.5% |
| Tablet | 329 | 68.0% |
| No Computing Device | 29 | 6.0% |
| Total | 484 | 100.0% |
Internet Access in Lewiston
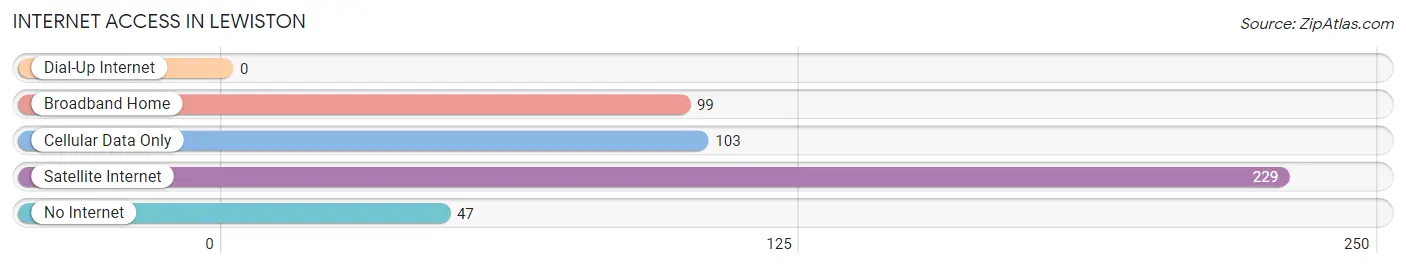
| Internet Type | # Households | % Households |
| Dial-Up Internet | 0 | 0.0% |
| Broadband Home | 99 | 20.4% |
| Cellular Data Only | 103 | 21.3% |
| Satellite Internet | 229 | 47.3% |
| No Internet | 47 | 9.7% |
| Total | 484 | 100.0% |
Lewiston Summary
Lewiston, California is a small unincorporated community located in Trinity County, California. It is situated in the foothills of the Trinity Alps, approximately 20 miles east of Weaverville and 40 miles west of Redding. The population of Lewiston was estimated to be around 1,000 in 2020.
History
The area that is now Lewiston was originally inhabited by the Wintu Native American tribe. The first European settlers arrived in the area in the 1850s, and the town of Lewiston was established in 1858. The town was named after Lewis Linn, a local rancher and miner.
In the late 19th century, Lewiston was a bustling mining town, with several gold and silver mines in the area. The town also had a number of saloons, hotels, and stores. The town was also home to a number of Chinese immigrants who worked in the mines.
In the early 20th century, the mining industry in Lewiston began to decline, and the town’s population began to dwindle. In the 1950s, the town was almost completely abandoned. In the 1970s, the town began to experience a resurgence, as people began to move to the area to take advantage of the area’s natural beauty and recreational opportunities.
Geography
Lewiston is located in the foothills of the Trinity Alps, approximately 20 miles east of Weaverville and 40 miles west of Redding. The town is situated at an elevation of 1,890 feet above sea level. The climate in Lewiston is mild, with hot summers and cool winters.
The town is surrounded by the Trinity National Forest, which provides a variety of recreational opportunities, including camping, hiking, fishing, and hunting. The nearby Trinity River is a popular destination for kayaking and rafting.
Economy
The economy of Lewiston is largely based on tourism and recreation. The town is home to a number of bed and breakfasts, restaurants, and shops. The nearby Trinity River is a popular destination for kayaking and rafting, and the nearby Trinity National Forest provides a variety of recreational opportunities.
The town is also home to a number of small businesses, including a lumber mill, a sawmill, and a general store. The town is also home to a number of artists and craftspeople, who sell their wares at local galleries and shops.
Demographics
The population of Lewiston was estimated to be around 1,000 in 2020. The town is predominantly white, with a small Hispanic population. The median household income in Lewiston is $45,000, and the median home value is $250,000. The town has a low unemployment rate, and the poverty rate is below the national average.
Common Questions
What is Per Capita Income in Lewiston?
Per Capita income in Lewiston is $24,361.
What is the Median Family Income in Lewiston?
Median Family Income in Lewiston is $101,000.
What is the Median Household income in Lewiston?
Median Household Income in Lewiston is $57,212.
What is Inequality or Gini Index in Lewiston?
Inequality or Gini Index in Lewiston is 0.42.
What is the Total Population of Lewiston?
Total Population of Lewiston is 2,218.
What is the Total Male Population of Lewiston?
Total Male Population of Lewiston is 984.
What is the Total Female Population of Lewiston?
Total Female Population of Lewiston is 1,234.
What is the Ratio of Males per 100 Females in Lewiston?
There are 79.74 Males per 100 Females in Lewiston.
What is the Ratio of Females per 100 Males in Lewiston?
There are 125.41 Females per 100 Males in Lewiston.
What is the Median Population Age in Lewiston?
Median Population Age in Lewiston is 38.6 Years.
What is the Average Family Size in Lewiston
Average Family Size in Lewiston is 5.6 People.
What is the Average Household Size in Lewiston
Average Household Size in Lewiston is 4.6 People.
How Large is the Labor Force in Lewiston?
There are 862 People in the Labor Forcein in Lewiston.
What is the Percentage of People in the Labor Force in Lewiston?
52.3% of People are in the Labor Force in Lewiston.
What is the Unemployment Rate in Lewiston?
Unemployment Rate in Lewiston is 3.9%.