Cities with the Highest Percentage of Samoan Population in California
RELATED REPORTS & OPTIONS
Samoan
California
Compare Cities
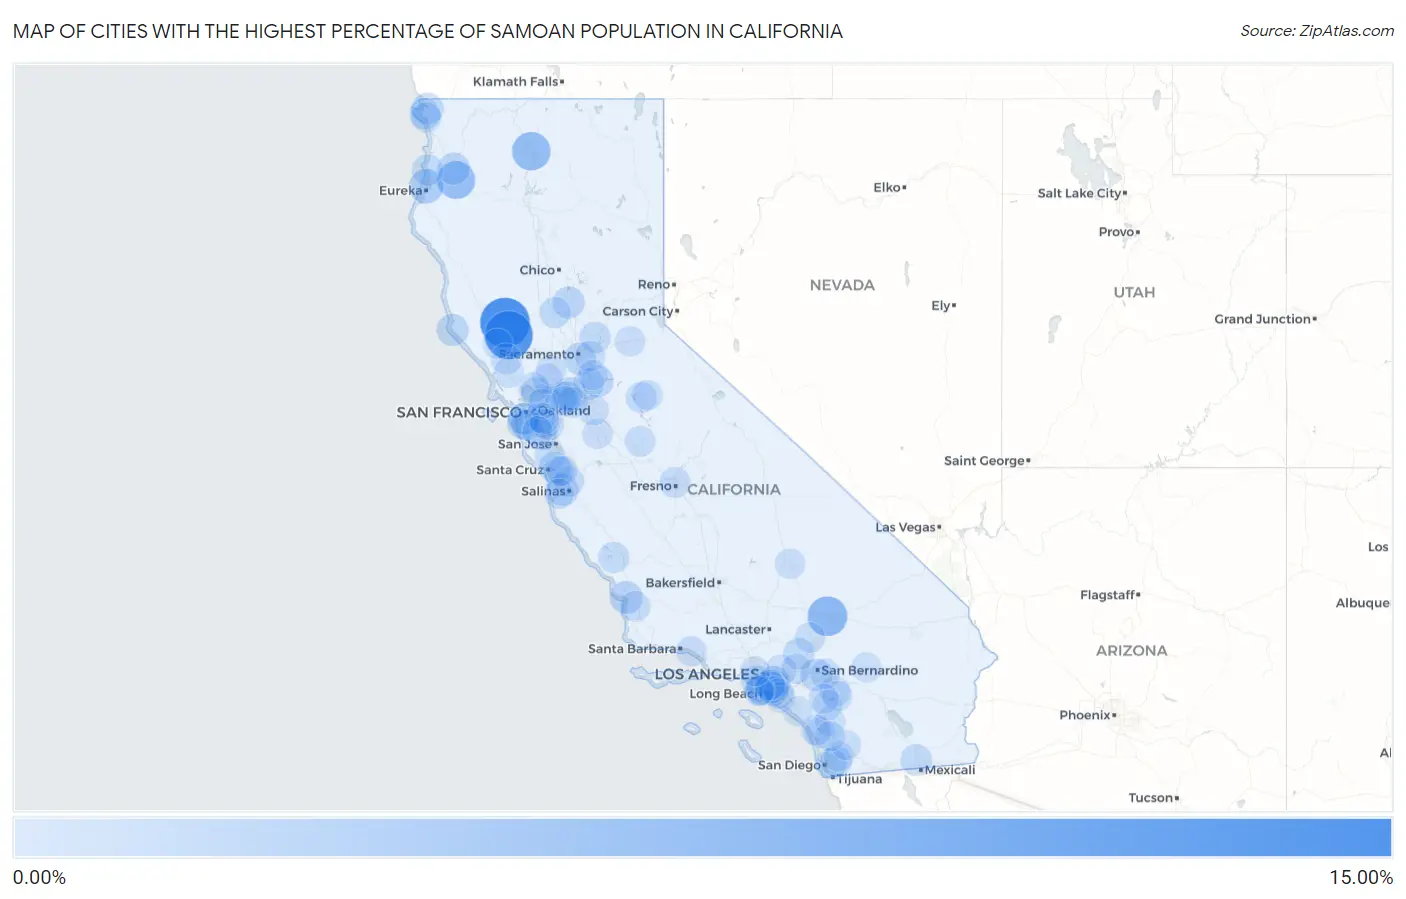
Map of Cities with the Highest Percentage of Samoan Population in California
0.00%
15.00%
Cities with the Highest Percentage of Samoan Population in California
| City | Samoan | vs State | vs National | |
| 1. | Soda Bay | 11.46% | 0.16%(+11.3)#1 | 0.069%(+11.4)#11 |
| 2. | Cobb | 10.66% | 0.16%(+10.5)#2 | 0.069%(+10.6)#16 |
| 3. | Lenwood | 5.68% | 0.16%(+5.52)#3 | 0.069%(+5.61)#37 |
| 4. | Mount Shasta | 5.04% | 0.16%(+4.88)#4 | 0.069%(+4.97)#47 |
| 5. | Willow Creek | 4.74% | 0.16%(+4.58)#5 | 0.069%(+4.67)#54 |
| 6. | Woody | 3.12% | 0.16%(+2.96)#6 | 0.069%(+3.06)#83 |
| 7. | Manila | 2.71% | 0.16%(+2.55)#7 | 0.069%(+2.65)#97 |
| 8. | Artesia | 2.28% | 0.16%(+2.12)#8 | 0.069%(+2.22)#119 |
| 9. | Bethel Island | 1.96% | 0.16%(+1.80)#9 | 0.069%(+1.89)#144 |
| 10. | Santa Fe Springs | 1.89% | 0.16%(+1.73)#10 | 0.069%(+1.82)#150 |
| 11. | Pismo Beach | 1.83% | 0.16%(+1.67)#11 | 0.069%(+1.76)#154 |
| 12. | Grand Terrace | 1.61% | 0.16%(+1.45)#12 | 0.069%(+1.54)#177 |
| 13. | Carson | 1.59% | 0.16%(+1.43)#13 | 0.069%(+1.52)#179 |
| 14. | Hoopa | 1.57% | 0.16%(+1.41)#14 | 0.069%(+1.50)#181 |
| 15. | Lemon Hill | 1.57% | 0.16%(+1.40)#15 | 0.069%(+1.50)#182 |
| 16. | Point Arena | 1.51% | 0.16%(+1.35)#16 | 0.069%(+1.44)#188 |
| 17. | Marina | 1.44% | 0.16%(+1.28)#17 | 0.069%(+1.37)#195 |
| 18. | Dogtown | 1.44% | 0.16%(+1.28)#18 | 0.069%(+1.37)#196 |
| 19. | Live Oak | 1.44% | 0.16%(+1.28)#19 | 0.069%(+1.37)#197 |
| 20. | Fort Dick | 1.39% | 0.16%(+1.23)#20 | 0.069%(+1.32)#203 |
| 21. | El Sobrante Cdp Contra Costa County | 1.39% | 0.16%(+1.23)#21 | 0.069%(+1.32)#205 |
| 22. | Aptos | 1.30% | 0.16%(+1.14)#22 | 0.069%(+1.23)#221 |
| 23. | Menlo Park | 1.28% | 0.16%(+1.12)#23 | 0.069%(+1.21)#228 |
| 24. | Wrightwood | 1.17% | 0.16%(+1.01)#24 | 0.069%(+1.10)#245 |
| 25. | El Centro | 1.15% | 0.16%(+0.994)#25 | 0.069%(+1.09)#249 |
| 26. | Loomis | 1.13% | 0.16%(+0.967)#26 | 0.069%(+1.06)#254 |
| 27. | Trinidad | 1.11% | 0.16%(+0.953)#27 | 0.069%(+1.04)#257 |
| 28. | Antioch | 1.10% | 0.16%(+0.943)#28 | 0.069%(+1.03)#262 |
| 29. | Colma | 1.09% | 0.16%(+0.930)#29 | 0.069%(+1.02)#265 |
| 30. | Meridian | 1.06% | 0.16%(+0.903)#30 | 0.069%(+0.995)#273 |
| 31. | Woodbridge | 1.03% | 0.16%(+0.873)#31 | 0.069%(+0.965)#279 |
| 32. | Crockett | 1.01% | 0.16%(+0.847)#32 | 0.069%(+0.938)#283 |
| 33. | Casa De Oro Mount Helix | 1.00% | 0.16%(+0.842)#33 | 0.069%(+0.933)#285 |
| 34. | Lemon Grove | 1.00% | 0.16%(+0.836)#34 | 0.069%(+0.928)#287 |
| 35. | Daly City | 0.99% | 0.16%(+0.829)#35 | 0.069%(+0.921)#290 |
| 36. | Lake Nacimiento | 0.97% | 0.16%(+0.807)#36 | 0.069%(+0.898)#297 |
| 37. | Crescent City | 0.96% | 0.16%(+0.796)#37 | 0.069%(+0.887)#301 |
| 38. | Pacifica | 0.93% | 0.16%(+0.772)#38 | 0.069%(+0.864)#308 |
| 39. | Lennox | 0.88% | 0.16%(+0.724)#39 | 0.069%(+0.816)#327 |
| 40. | Sonora | 0.87% | 0.16%(+0.706)#40 | 0.069%(+0.797)#333 |
| 41. | Old Fig Garden | 0.85% | 0.16%(+0.693)#41 | 0.069%(+0.784)#335 |
| 42. | Lexington Hills | 0.85% | 0.16%(+0.690)#42 | 0.069%(+0.781)#338 |
| 43. | Larkfield Wikiup | 0.82% | 0.16%(+0.659)#43 | 0.069%(+0.750)#345 |
| 44. | Prunedale | 0.81% | 0.16%(+0.650)#44 | 0.069%(+0.741)#350 |
| 45. | Vista | 0.80% | 0.16%(+0.644)#45 | 0.069%(+0.736)#354 |
| 46. | Millbrae | 0.79% | 0.16%(+0.628)#46 | 0.069%(+0.720)#359 |
| 47. | Union City | 0.78% | 0.16%(+0.621)#47 | 0.069%(+0.712)#362 |
| 48. | San Jacinto | 0.75% | 0.16%(+0.594)#48 | 0.069%(+0.685)#371 |
| 49. | University Of California Merced | 0.74% | 0.16%(+0.581)#49 | 0.069%(+0.672)#379 |
| 50. | Nipomo | 0.74% | 0.16%(+0.578)#50 | 0.069%(+0.670)#380 |
| 51. | San Leandro | 0.72% | 0.16%(+0.559)#51 | 0.069%(+0.651)#389 |
| 52. | Lakewood | 0.71% | 0.16%(+0.549)#52 | 0.069%(+0.640)#392 |
| 53. | Discovery Bay | 0.70% | 0.16%(+0.542)#53 | 0.069%(+0.634)#393 |
| 54. | Aptos Hills Larkin Valley | 0.69% | 0.16%(+0.527)#54 | 0.069%(+0.618)#399 |
| 55. | Vincent | 0.65% | 0.16%(+0.488)#55 | 0.069%(+0.580)#417 |
| 56. | Carpinteria | 0.64% | 0.16%(+0.484)#56 | 0.069%(+0.576)#419 |
| 57. | Patterson | 0.62% | 0.16%(+0.456)#57 | 0.069%(+0.548)#436 |
| 58. | Pala | 0.61% | 0.16%(+0.447)#58 | 0.069%(+0.538)#443 |
| 59. | Cherryland | 0.61% | 0.16%(+0.446)#59 | 0.069%(+0.538)#444 |
| 60. | Manteca | 0.61% | 0.16%(+0.445)#60 | 0.069%(+0.537)#446 |
| 61. | Pleasant Hill | 0.60% | 0.16%(+0.442)#61 | 0.069%(+0.534)#447 |
| 62. | Fountain Valley | 0.60% | 0.16%(+0.437)#62 | 0.069%(+0.528)#452 |
| 63. | Mather | 0.59% | 0.16%(+0.434)#63 | 0.069%(+0.525)#455 |
| 64. | Adelanto | 0.59% | 0.16%(+0.427)#64 | 0.069%(+0.518)#459 |
| 65. | Bertsch Oceanview | 0.59% | 0.16%(+0.425)#65 | 0.069%(+0.516)#461 |
| 66. | Pollock Pines | 0.57% | 0.16%(+0.414)#66 | 0.069%(+0.506)#469 |
| 67. | Fairfield | 0.55% | 0.16%(+0.388)#67 | 0.069%(+0.480)#487 |
| 68. | Oceanside | 0.53% | 0.16%(+0.371)#68 | 0.069%(+0.462)#494 |
| 69. | Oakley | 0.53% | 0.16%(+0.368)#69 | 0.069%(+0.459)#496 |
| 70. | Mono Vista | 0.52% | 0.16%(+0.364)#70 | 0.069%(+0.456)#498 |
| 71. | Winter Gardens | 0.52% | 0.16%(+0.360)#71 | 0.069%(+0.452)#500 |
| 72. | Upland | 0.52% | 0.16%(+0.359)#72 | 0.069%(+0.451)#501 |
| 73. | Redlands | 0.52% | 0.16%(+0.358)#73 | 0.069%(+0.450)#502 |
| 74. | Meyers | 0.51% | 0.16%(+0.353)#74 | 0.069%(+0.445)#504 |
| 75. | University Of California-Santa Barbara | 0.51% | 0.16%(+0.346)#75 | 0.069%(+0.438)#511 |
| 76. | China Lake Acres | 0.50% | 0.16%(+0.343)#76 | 0.069%(+0.434)#514 |
| 77. | Lafayette | 0.49% | 0.16%(+0.329)#77 | 0.069%(+0.421)#526 |
| 78. | Geyserville | 0.48% | 0.16%(+0.317)#78 | 0.069%(+0.409)#539 |
| 79. | French Valley | 0.48% | 0.16%(+0.317)#79 | 0.069%(+0.409)#540 |
| 80. | Cotati | 0.48% | 0.16%(+0.317)#80 | 0.069%(+0.408)#541 |
| 81. | Herald | 0.48% | 0.16%(+0.316)#81 | 0.069%(+0.407)#542 |
| 82. | Los Alamitos | 0.47% | 0.16%(+0.308)#82 | 0.069%(+0.400)#546 |
| 83. | San Diego Country Estates | 0.47% | 0.16%(+0.308)#83 | 0.069%(+0.400)#547 |
| 84. | Escondido | 0.47% | 0.16%(+0.305)#84 | 0.069%(+0.397)#549 |
| 85. | Amesti | 0.46% | 0.16%(+0.299)#85 | 0.069%(+0.390)#552 |
| 86. | East Hemet | 0.46% | 0.16%(+0.298)#86 | 0.069%(+0.390)#554 |
| 87. | Yucca Valley | 0.46% | 0.16%(+0.296)#87 | 0.069%(+0.387)#557 |
| 88. | San Juan Capistrano | 0.46% | 0.16%(+0.295)#88 | 0.069%(+0.387)#558 |
| 89. | Garden Grove | 0.45% | 0.16%(+0.290)#89 | 0.069%(+0.381)#563 |
| 90. | Vallejo | 0.45% | 0.16%(+0.289)#90 | 0.069%(+0.381)#564 |
| 91. | Bellflower | 0.44% | 0.16%(+0.284)#91 | 0.069%(+0.375)#570 |
| 92. | Hayward | 0.44% | 0.16%(+0.276)#92 | 0.069%(+0.368)#578 |
| 93. | Vacaville | 0.43% | 0.16%(+0.267)#93 | 0.069%(+0.359)#586 |
| 94. | Menifee | 0.43% | 0.16%(+0.267)#94 | 0.069%(+0.358)#588 |
| 95. | Brentwood | 0.43% | 0.16%(+0.265)#95 | 0.069%(+0.356)#592 |
| 96. | West Carson | 0.40% | 0.16%(+0.244)#96 | 0.069%(+0.336)#603 |
| 97. | Redwood City | 0.40% | 0.16%(+0.244)#97 | 0.069%(+0.335)#604 |
| 98. | Seaside | 0.40% | 0.16%(+0.242)#98 | 0.069%(+0.334)#605 |
| 99. | Lomita | 0.40% | 0.16%(+0.241)#99 | 0.069%(+0.333)#607 |
| 100. | Beverly Hills | 0.40% | 0.16%(+0.238)#100 | 0.069%(+0.329)#609 |
Common Questions
What are the Top 10 Cities with the Highest Percentage of Samoan Population in California?
Top 10 Cities with the Highest Percentage of Samoan Population in California are:
#1
11.46%
#2
10.66%
#3
5.68%
#4
5.04%
#5
4.74%
#6
2.71%
#7
2.28%
#8
1.96%
#9
1.89%
#10
1.83%
What city has the Highest Percentage of Samoan Population in California?
Soda Bay has the Highest Percentage of Samoan Population in California with 11.46%.
What is the Percentage of Samoan Population in the State of California?
Percentage of Samoan Population in California is 0.16%.
What is the Percentage of Samoan Population in the United States?
Percentage of Samoan Population in the United States is 0.069%.