Cities with the Highest Percentage of Immigrants from Oceania in California
RELATED REPORTS & OPTIONS
Oceania
California
Compare Cities
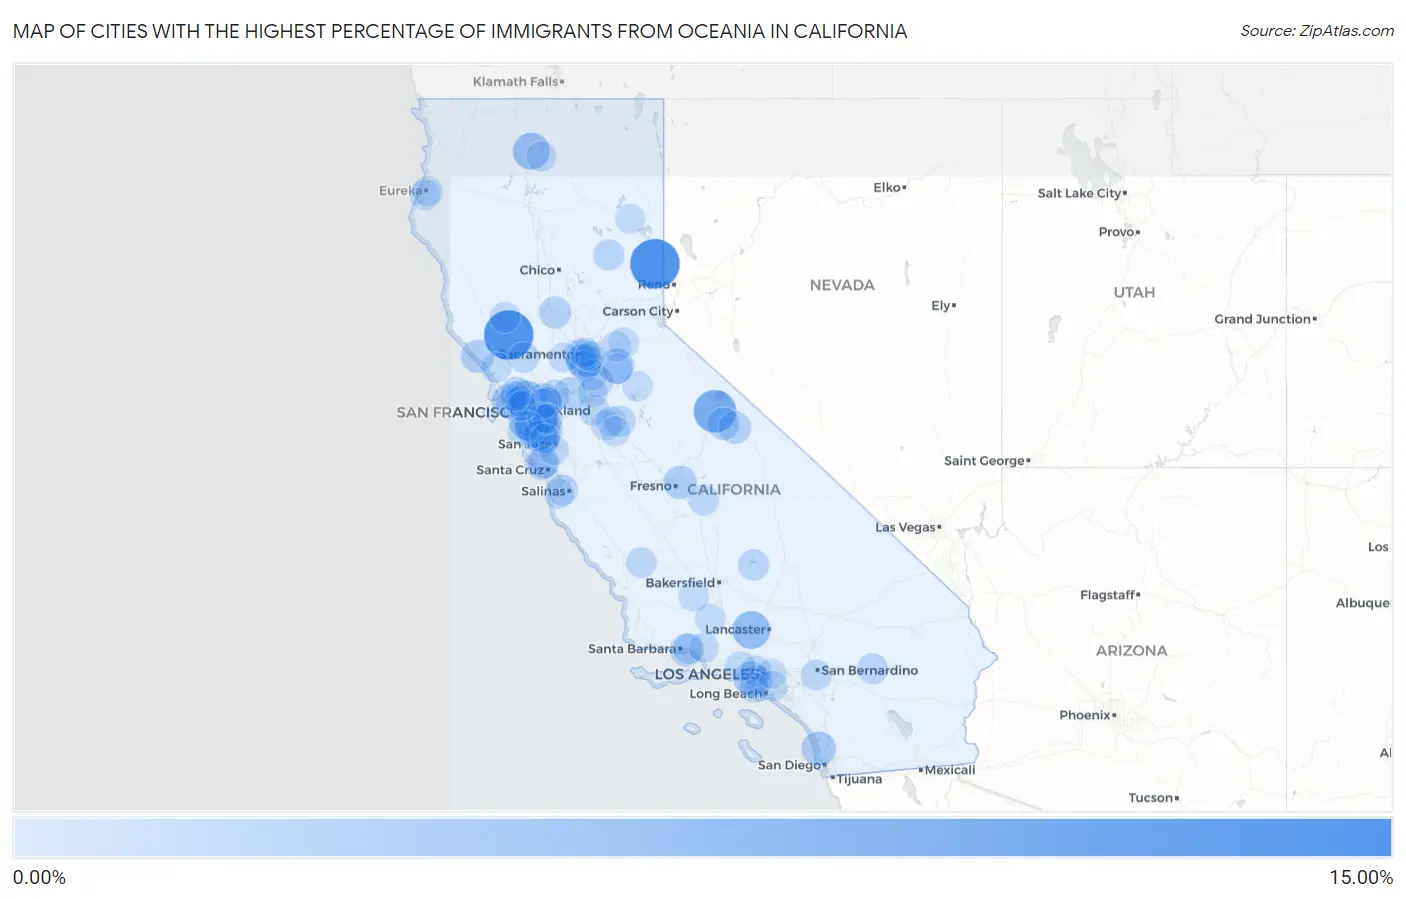
Map of Cities with the Highest Percentage of Immigrants from Oceania in California
0.00%
15.00%
Cities with the Highest Percentage of Immigrants from Oceania in California
| City | Oceania | vs State | vs National | |
| 1. | Chilcoot Vinton | 10.70% | 0.22%(+10.5)#-1 | 0.089%(+10.6)#0 |
| 2. | Cobb | 10.66% | 0.22%(+10.4)#0 | 0.089%(+10.6)#1 |
| 3. | June Lake | 6.95% | 0.22%(+6.73)#1 | 0.089%(+6.87)#2 |
| 4. | Lake Hughes | 4.50% | 0.22%(+4.28)#2 | 0.089%(+4.41)#3 |
| 5. | Mount Shasta | 4.02% | 0.22%(+3.80)#3 | 0.089%(+3.93)#4 |
| 6. | North Richmond | 3.56% | 0.22%(+3.34)#4 | 0.089%(+3.47)#5 |
| 7. | Amador City | 3.26% | 0.22%(+3.04)#5 | 0.089%(+3.17)#6 |
| 8. | East Palo Alto | 3.24% | 0.22%(+3.02)#6 | 0.089%(+3.15)#90 |
| 9. | Marina Del Rey | 2.92% | 0.22%(+2.70)#7 | 0.089%(+2.83)#91 |
| 10. | Del Mar | 2.76% | 0.22%(+2.54)#8 | 0.089%(+2.67)#92 |
| 11. | Bolinas | 2.58% | 0.22%(+2.36)#9 | 0.089%(+2.49)#93 |
| 12. | Florin | 2.44% | 0.22%(+2.22)#20 | 0.089%(+2.35)#270 |
| 13. | Reliez Valley | 2.38% | 0.22%(+2.16)#21 | 0.089%(+2.29)#271 |
| 14. | Tarpey Village | 2.14% | 0.22%(+1.92)#22 | 0.089%(+2.05)#272 |
| 15. | Timber Cove | 2.13% | 0.22%(+1.91)#23 | 0.089%(+2.04)#273 |
| 16. | Bethel Island | 1.96% | 0.22%(+1.74)#24 | 0.089%(+1.87)#274 |
| 17. | Stinson Beach | 1.89% | 0.22%(+1.67)#25 | 0.089%(+1.80)#275 |
| 18. | Summerland | 1.88% | 0.22%(+1.66)#26 | 0.089%(+1.80)#276 |
| 19. | San Bruno | 1.82% | 0.22%(+1.60)#27 | 0.089%(+1.73)#277 |
| 20. | Crowley Lake | 1.78% | 0.22%(+1.56)#28 | 0.089%(+1.69)#278 |
| 21. | Mammoth Lakes | 1.72% | 0.22%(+1.50)#29 | 0.089%(+1.63)#279 |
| 22. | Bonny Doon | 1.71% | 0.22%(+1.49)#30 | 0.089%(+1.63)#280 |
| 23. | Meridian | 1.60% | 0.22%(+1.38)#31 | 0.089%(+1.51)#281 |
| 24. | Hayward | 1.59% | 0.22%(+1.37)#32 | 0.089%(+1.50)#282 |
| 25. | Acalanes Ridge | 1.56% | 0.22%(+1.34)#33 | 0.089%(+1.47)#283 |
| 26. | Baywood Park | 1.48% | 0.22%(+1.26)#34 | 0.089%(+1.39)#284 |
| 27. | Los Altos Hills | 1.47% | 0.22%(+1.25)#35 | 0.089%(+1.38)#285 |
| 28. | Ben Lomond | 1.46% | 0.22%(+1.24)#36 | 0.089%(+1.37)#286 |
| 29. | Vineyard | 1.46% | 0.22%(+1.24)#37 | 0.089%(+1.37)#287 |
| 30. | Dogtown | 1.44% | 0.22%(+1.22)#38 | 0.089%(+1.35)#288 |
| 31. | Sacramento | 1.39% | 0.22%(+1.17)#39 | 0.089%(+1.30)#289 |
| 32. | Lennox | 1.38% | 0.22%(+1.16)#40 | 0.089%(+1.29)#290 |
| 33. | Menlo Park | 1.30% | 0.22%(+1.08)#41 | 0.089%(+1.21)#291 |
| 34. | Lucas Valley Marinwood | 1.26% | 0.22%(+1.04)#42 | 0.089%(+1.17)#292 |
| 35. | Parkway | 1.17% | 0.22%(+0.950)#43 | 0.089%(+1.08)#293 |
| 36. | San Mateo | 1.16% | 0.22%(+0.939)#44 | 0.089%(+1.07)#294 |
| 37. | Elk Grove | 1.13% | 0.22%(+0.912)#45 | 0.089%(+1.04)#295 |
| 38. | Squirrel Mountain Valley | 1.12% | 0.22%(+0.901)#46 | 0.089%(+1.03)#296 |
| 39. | Waterford | 1.07% | 0.22%(+0.849)#47 | 0.089%(+0.981)#297 |
| 40. | Santa Venetia | 1.06% | 0.22%(+0.837)#48 | 0.089%(+0.968)#298 |
| 41. | Quincy | 1.02% | 0.22%(+0.804)#49 | 0.089%(+0.935)#299 |
| 42. | Marina | 1.02% | 0.22%(+0.796)#50 | 0.089%(+0.927)#300 |
| 43. | South San Francisco | 1.02% | 0.22%(+0.795)#51 | 0.089%(+0.927)#301 |
| 44. | Joshua Tree | 0.99% | 0.22%(+0.773)#52 | 0.089%(+0.904)#302 |
| 45. | Manteca | 0.99% | 0.22%(+0.772)#53 | 0.089%(+0.903)#303 |
| 46. | Grand Terrace | 0.95% | 0.22%(+0.734)#54 | 0.089%(+0.865)#304 |
| 47. | Newark | 0.95% | 0.22%(+0.728)#55 | 0.089%(+0.859)#305 |
| 48. | Toro Canyon | 0.95% | 0.22%(+0.726)#56 | 0.089%(+0.857)#306 |
| 49. | Pittsburg | 0.94% | 0.22%(+0.722)#57 | 0.089%(+0.854)#307 |
| 50. | Lucerne | 0.94% | 0.22%(+0.720)#58 | 0.089%(+0.851)#308 |
| 51. | West Hollywood | 0.94% | 0.22%(+0.719)#59 | 0.089%(+0.850)#309 |
| 52. | San Carlos | 0.94% | 0.22%(+0.718)#60 | 0.089%(+0.849)#310 |
| 53. | Pinon Hills | 0.94% | 0.22%(+0.716)#61 | 0.089%(+0.848)#311 |
| 54. | St Helena | 0.90% | 0.22%(+0.683)#62 | 0.089%(+0.814)#312 |
| 55. | Shandon | 0.87% | 0.22%(+0.653)#63 | 0.089%(+0.784)#313 |
| 56. | Shell Ridge | 0.86% | 0.22%(+0.645)#64 | 0.089%(+0.776)#314 |
| 57. | Orosi | 0.86% | 0.22%(+0.637)#65 | 0.089%(+0.769)#315 |
| 58. | Herald | 0.86% | 0.22%(+0.637)#66 | 0.089%(+0.769)#316 |
| 59. | San Lorenzo | 0.86% | 0.22%(+0.637)#67 | 0.089%(+0.768)#317 |
| 60. | Millbrae | 0.85% | 0.22%(+0.634)#68 | 0.089%(+0.766)#318 |
| 61. | Cherryland | 0.84% | 0.22%(+0.619)#69 | 0.089%(+0.750)#319 |
| 62. | Tiburon | 0.83% | 0.22%(+0.614)#70 | 0.089%(+0.745)#320 |
| 63. | Corte Madera | 0.82% | 0.22%(+0.597)#71 | 0.089%(+0.729)#321 |
| 64. | Artesia | 0.81% | 0.22%(+0.587)#72 | 0.089%(+0.718)#322 |
| 65. | Modesto | 0.80% | 0.22%(+0.584)#73 | 0.089%(+0.715)#323 |
| 66. | Murphys | 0.79% | 0.22%(+0.571)#74 | 0.089%(+0.703)#324 |
| 67. | Humboldt Hill | 0.76% | 0.22%(+0.544)#75 | 0.089%(+0.675)#325 |
| 68. | El Granada | 0.76% | 0.22%(+0.541)#76 | 0.089%(+0.672)#326 |
| 69. | Hermosa Beach | 0.74% | 0.22%(+0.517)#77 | 0.089%(+0.648)#327 |
| 70. | Bakersfield Country Club | 0.73% | 0.22%(+0.513)#78 | 0.089%(+0.644)#328 |
| 71. | Ashland | 0.72% | 0.22%(+0.497)#79 | 0.089%(+0.628)#329 |
| 72. | La Riviera | 0.71% | 0.22%(+0.492)#80 | 0.089%(+0.624)#330 |
| 73. | Seaside | 0.71% | 0.22%(+0.489)#81 | 0.089%(+0.621)#331 |
| 74. | West Menlo Park | 0.71% | 0.22%(+0.486)#82 | 0.089%(+0.617)#332 |
| 75. | Mira Monte | 0.70% | 0.22%(+0.482)#83 | 0.089%(+0.613)#333 |
| 76. | Camino | 0.70% | 0.22%(+0.479)#84 | 0.089%(+0.611)#334 |
| 77. | Ford City | 0.69% | 0.22%(+0.469)#85 | 0.089%(+0.600)#335 |
| 78. | Diamond Springs | 0.68% | 0.22%(+0.461)#86 | 0.089%(+0.592)#336 |
| 79. | Lafayette | 0.68% | 0.22%(+0.460)#87 | 0.089%(+0.591)#337 |
| 80. | Hidden Hills | 0.66% | 0.22%(+0.445)#88 | 0.089%(+0.576)#338 |
| 81. | Burlingame | 0.66% | 0.22%(+0.442)#89 | 0.089%(+0.573)#339 |
| 82. | Occidental | 0.66% | 0.22%(+0.440)#90 | 0.089%(+0.571)#340 |
| 83. | Fairview | 0.65% | 0.22%(+0.432)#91 | 0.089%(+0.563)#341 |
| 84. | Cambrian Park | 0.65% | 0.22%(+0.428)#92 | 0.089%(+0.559)#342 |
| 85. | Empire | 0.64% | 0.22%(+0.424)#93 | 0.089%(+0.555)#343 |
| 86. | Arden Arcade | 0.64% | 0.22%(+0.423)#94 | 0.089%(+0.555)#344 |
| 87. | Pine Mountain Club | 0.64% | 0.22%(+0.418)#95 | 0.089%(+0.549)#345 |
| 88. | Eureka | 0.63% | 0.22%(+0.410)#96 | 0.089%(+0.541)#346 |
| 89. | Morada | 0.63% | 0.22%(+0.410)#97 | 0.089%(+0.541)#347 |
| 90. | Mccloud | 0.63% | 0.22%(+0.406)#98 | 0.089%(+0.537)#348 |
| 91. | Sausalito | 0.62% | 0.22%(+0.402)#99 | 0.089%(+0.534)#349 |
| 92. | University Of California Davis | 0.62% | 0.22%(+0.400)#100 | 0.089%(+0.531)#350 |
| 93. | Meyers | 0.61% | 0.22%(+0.388)#101 | 0.089%(+0.519)#351 |
| 94. | Turlock | 0.61% | 0.22%(+0.387)#102 | 0.089%(+0.518)#352 |
| 95. | South San Gabriel | 0.60% | 0.22%(+0.384)#103 | 0.089%(+0.515)#353 |
| 96. | Sutter Creek | 0.60% | 0.22%(+0.382)#104 | 0.089%(+0.513)#354 |
| 97. | Mountain View | 0.60% | 0.22%(+0.376)#105 | 0.089%(+0.507)#355 |
| 98. | Fairfax | 0.59% | 0.22%(+0.375)#106 | 0.089%(+0.506)#356 |
| 99. | Mather | 0.59% | 0.22%(+0.374)#107 | 0.089%(+0.506)#357 |
| 100. | Susanville | 0.58% | 0.22%(+0.365)#108 | 0.089%(+0.496)#358 |
Common Questions
What are the Top 10 Cities with the Highest Percentage of Immigrants from Oceania in California?
Top 10 Cities with the Highest Percentage of Immigrants from Oceania in California are:
#1
10.70%
#2
10.66%
#3
6.95%
#4
4.50%
#5
4.02%
#6
3.56%
#7
3.26%
#8
3.24%
#9
2.92%
#10
2.76%
What city has the Highest Percentage of Immigrants from Oceania in California?
Chilcoot Vinton has the Highest Percentage of Immigrants from Oceania in California with 10.70%.
What is the Percentage of Immigrants from Oceania in the State of California?
Percentage of Immigrants from Oceania in California is 0.22%.
What is the Percentage of Immigrants from Oceania in the United States?
Percentage of Immigrants from Oceania in the United States is 0.089%.