Cities with the Most Immigrants from Eastern Africa in California
RELATED REPORTS & OPTIONS
Eastern Africa
California
Compare Cities
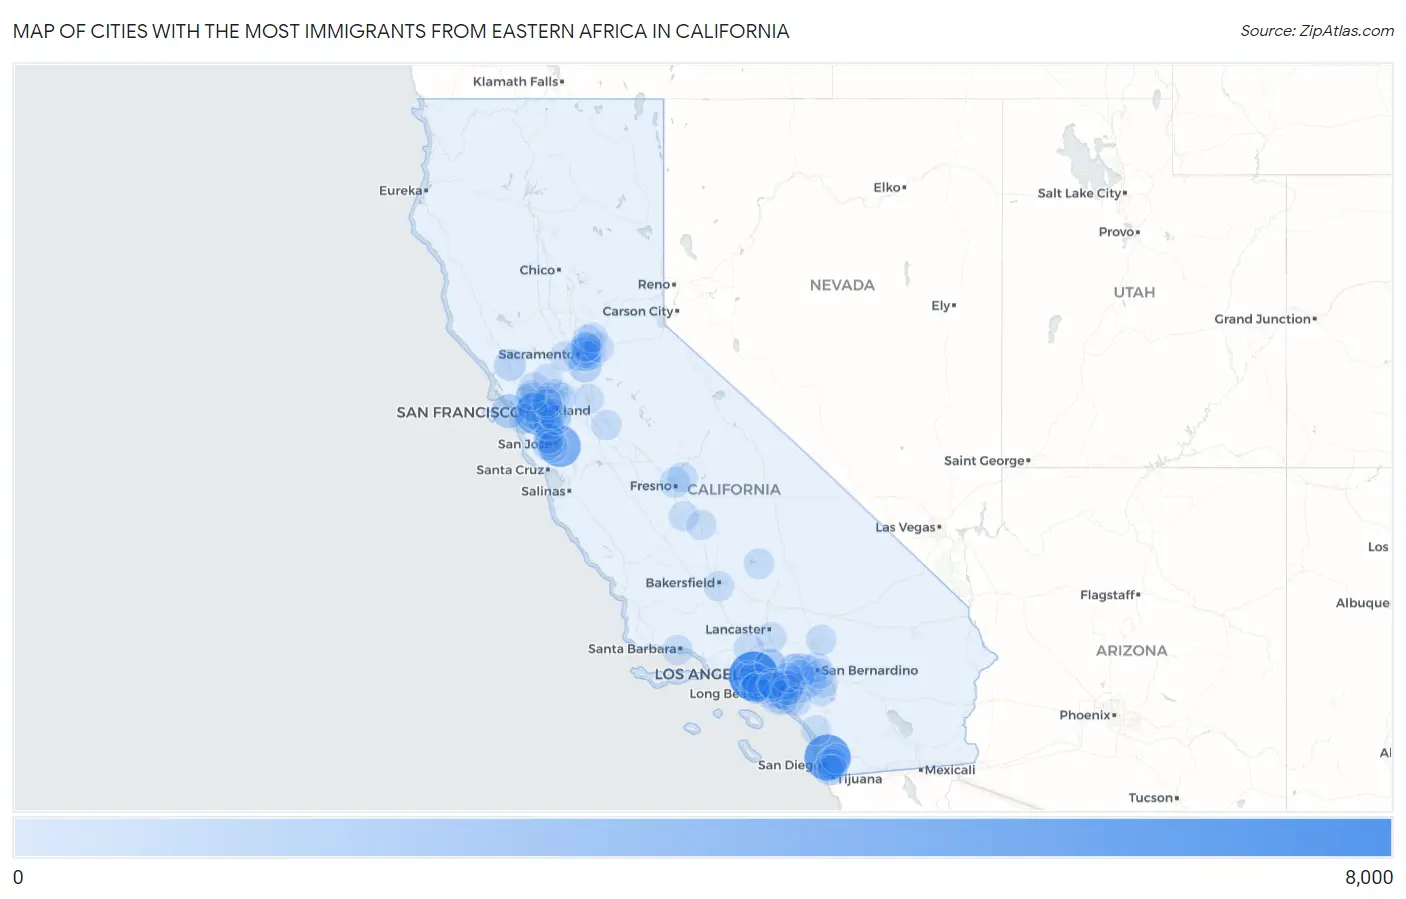
Map of Cities with the Most Immigrants from Eastern Africa in California
0
8,000
Cities with the Most Immigrants from Eastern Africa in California
| City | Eastern Africa | vs State | vs National | |
| 1. | Los Angeles | 7,915 | 61,212(12.93%)#1 | 752,337(1.05%)#10 |
| 2. | San Diego | 6,441 | 61,212(10.52%)#2 | 752,337(0.86%)#14 |
| 3. | Oakland | 4,718 | 61,212(7.71%)#3 | 752,337(0.63%)#18 |
| 4. | San Jose | 4,652 | 61,212(7.60%)#4 | 752,337(0.62%)#19 |
| 5. | San Francisco | 1,666 | 61,212(2.72%)#5 | 752,337(0.22%)#69 |
| 6. | Anaheim | 1,236 | 61,212(2.02%)#6 | 752,337(0.16%)#99 |
| 7. | Elk Grove | 1,135 | 61,212(1.85%)#7 | 752,337(0.15%)#105 |
| 8. | Sacramento | 1,058 | 61,212(1.73%)#8 | 752,337(0.14%)#118 |
| 9. | Santa Rosa | 778 | 61,212(1.27%)#9 | 752,337(0.10%)#162 |
| 10. | Fremont | 725 | 61,212(1.18%)#10 | 752,337(0.10%)#171 |
| 11. | Hawthorne | 716 | 61,212(1.17%)#11 | 752,337(0.10%)#172 |
| 12. | Santa Clara | 703 | 61,212(1.15%)#12 | 752,337(0.09%)#178 |
| 13. | Inglewood | 703 | 61,212(1.15%)#13 | 752,337(0.09%)#179 |
| 14. | Santa Monica | 566 | 61,212(0.92%)#14 | 752,337(0.08%)#223 |
| 15. | Pittsburg | 564 | 61,212(0.92%)#15 | 752,337(0.07%)#224 |
| 16. | Richmond | 496 | 61,212(0.81%)#16 | 752,337(0.07%)#246 |
| 17. | Arden Arcade | 490 | 61,212(0.80%)#17 | 752,337(0.07%)#247 |
| 18. | Long Beach | 482 | 61,212(0.79%)#18 | 752,337(0.06%)#249 |
| 19. | Carmichael | 451 | 61,212(0.74%)#19 | 752,337(0.06%)#258 |
| 20. | Spring Valley Cdp San Diego County | 411 | 61,212(0.67%)#20 | 752,337(0.05%)#279 |
| 21. | Fresno | 404 | 61,212(0.66%)#21 | 752,337(0.05%)#284 |
| 22. | Berkeley | 394 | 61,212(0.64%)#22 | 752,337(0.05%)#289 |
| 23. | Upland | 394 | 61,212(0.64%)#23 | 752,337(0.05%)#290 |
| 24. | Irvine | 391 | 61,212(0.64%)#24 | 752,337(0.05%)#292 |
| 25. | Hayward | 387 | 61,212(0.63%)#25 | 752,337(0.05%)#294 |
| 26. | Alameda | 336 | 61,212(0.55%)#26 | 752,337(0.04%)#337 |
| 27. | La Mesa | 336 | 61,212(0.55%)#27 | 752,337(0.04%)#338 |
| 28. | Dublin | 327 | 61,212(0.53%)#28 | 752,337(0.04%)#348 |
| 29. | Castro Valley | 324 | 61,212(0.53%)#29 | 752,337(0.04%)#352 |
| 30. | Rancho Cucamonga | 323 | 61,212(0.53%)#30 | 752,337(0.04%)#354 |
| 31. | Riverside | 315 | 61,212(0.51%)#31 | 752,337(0.04%)#359 |
| 32. | Huntington Beach | 311 | 61,212(0.51%)#32 | 752,337(0.04%)#367 |
| 33. | Campbell | 292 | 61,212(0.48%)#33 | 752,337(0.04%)#388 |
| 34. | Union City | 282 | 61,212(0.46%)#34 | 752,337(0.04%)#398 |
| 35. | Pasadena | 280 | 61,212(0.46%)#35 | 752,337(0.04%)#401 |
| 36. | Roseville | 276 | 61,212(0.45%)#36 | 752,337(0.04%)#407 |
| 37. | Altadena | 273 | 61,212(0.45%)#37 | 752,337(0.04%)#414 |
| 38. | Corona | 272 | 61,212(0.44%)#38 | 752,337(0.04%)#415 |
| 39. | Weldon | 271 | 61,212(0.44%)#39 | 752,337(0.04%)#417 |
| 40. | Bakersfield | 255 | 61,212(0.42%)#40 | 752,337(0.03%)#435 |
| 41. | Cupertino | 251 | 61,212(0.41%)#41 | 752,337(0.03%)#438 |
| 42. | Modesto | 250 | 61,212(0.41%)#42 | 752,337(0.03%)#439 |
| 43. | Lemon Grove | 250 | 61,212(0.41%)#43 | 752,337(0.03%)#440 |
| 44. | Palmdale | 241 | 61,212(0.39%)#44 | 752,337(0.03%)#453 |
| 45. | San Leandro | 239 | 61,212(0.39%)#45 | 752,337(0.03%)#457 |
| 46. | Apple Valley | 239 | 61,212(0.39%)#46 | 752,337(0.03%)#458 |
| 47. | Moreno Valley | 233 | 61,212(0.38%)#47 | 752,337(0.03%)#470 |
| 48. | Vallejo | 232 | 61,212(0.38%)#48 | 752,337(0.03%)#474 |
| 49. | National City | 231 | 61,212(0.38%)#49 | 752,337(0.03%)#476 |
| 50. | Fullerton | 222 | 61,212(0.36%)#50 | 752,337(0.03%)#490 |
| 51. | Buena Park | 217 | 61,212(0.35%)#51 | 752,337(0.03%)#503 |
| 52. | Clovis | 205 | 61,212(0.33%)#52 | 752,337(0.03%)#523 |
| 53. | Chino Hills | 203 | 61,212(0.33%)#53 | 752,337(0.03%)#526 |
| 54. | Santa Clarita | 199 | 61,212(0.33%)#54 | 752,337(0.03%)#537 |
| 55. | Fontana | 191 | 61,212(0.31%)#55 | 752,337(0.03%)#552 |
| 56. | Concord | 182 | 61,212(0.30%)#56 | 752,337(0.02%)#571 |
| 57. | Santa Barbara | 182 | 61,212(0.30%)#57 | 752,337(0.02%)#573 |
| 58. | Culver City | 182 | 61,212(0.30%)#58 | 752,337(0.02%)#574 |
| 59. | Hanford | 179 | 61,212(0.29%)#59 | 752,337(0.02%)#579 |
| 60. | Antioch | 178 | 61,212(0.29%)#60 | 752,337(0.02%)#582 |
| 61. | Rancho Cordova | 174 | 61,212(0.28%)#61 | 752,337(0.02%)#590 |
| 62. | Fairfield | 173 | 61,212(0.28%)#62 | 752,337(0.02%)#592 |
| 63. | North Highlands | 165 | 61,212(0.27%)#63 | 752,337(0.02%)#610 |
| 64. | Costa Mesa | 164 | 61,212(0.27%)#64 | 752,337(0.02%)#615 |
| 65. | Yorba Linda | 162 | 61,212(0.26%)#65 | 752,337(0.02%)#620 |
| 66. | Rosemont | 162 | 61,212(0.26%)#66 | 752,337(0.02%)#621 |
| 67. | Garden Grove | 161 | 61,212(0.26%)#67 | 752,337(0.02%)#623 |
| 68. | Folsom | 161 | 61,212(0.26%)#68 | 752,337(0.02%)#624 |
| 69. | Carson | 157 | 61,212(0.26%)#69 | 752,337(0.02%)#642 |
| 70. | Daly City | 152 | 61,212(0.25%)#70 | 752,337(0.02%)#661 |
| 71. | Sunnyvale | 151 | 61,212(0.25%)#71 | 752,337(0.02%)#663 |
| 72. | Claremont | 145 | 61,212(0.24%)#72 | 752,337(0.02%)#684 |
| 73. | Redondo Beach | 144 | 61,212(0.24%)#73 | 752,337(0.02%)#688 |
| 74. | Emeryville | 142 | 61,212(0.23%)#74 | 752,337(0.02%)#694 |
| 75. | Pleasanton | 138 | 61,212(0.23%)#75 | 752,337(0.02%)#706 |
| 76. | El Cajon | 137 | 61,212(0.22%)#76 | 752,337(0.02%)#710 |
| 77. | Lakewood | 136 | 61,212(0.22%)#77 | 752,337(0.02%)#715 |
| 78. | Chula Vista | 135 | 61,212(0.22%)#78 | 752,337(0.02%)#717 |
| 79. | Stockton | 134 | 61,212(0.22%)#79 | 752,337(0.02%)#721 |
| 80. | Oceanside | 133 | 61,212(0.22%)#80 | 752,337(0.02%)#726 |
| 81. | Placentia | 133 | 61,212(0.22%)#81 | 752,337(0.02%)#728 |
| 82. | Torrance | 132 | 61,212(0.22%)#82 | 752,337(0.02%)#735 |
| 83. | Orange | 131 | 61,212(0.21%)#83 | 752,337(0.02%)#742 |
| 84. | Cerritos | 131 | 61,212(0.21%)#84 | 752,337(0.02%)#745 |
| 85. | Santa Ana | 128 | 61,212(0.21%)#85 | 752,337(0.02%)#752 |
| 86. | San Bernardino | 127 | 61,212(0.21%)#86 | 752,337(0.02%)#758 |
| 87. | San Ramon | 117 | 61,212(0.19%)#87 | 752,337(0.02%)#797 |
| 88. | Perris | 117 | 61,212(0.19%)#88 | 752,337(0.02%)#798 |
| 89. | Davis | 116 | 61,212(0.19%)#89 | 752,337(0.02%)#803 |
| 90. | Loma Linda | 114 | 61,212(0.19%)#90 | 752,337(0.02%)#815 |
| 91. | Tulare | 113 | 61,212(0.18%)#91 | 752,337(0.02%)#819 |
| 92. | Rocklin | 112 | 61,212(0.18%)#92 | 752,337(0.01%)#826 |
| 93. | Lake Forest | 111 | 61,212(0.18%)#93 | 752,337(0.01%)#830 |
| 94. | Diamond Bar | 111 | 61,212(0.18%)#94 | 752,337(0.01%)#833 |
| 95. | Foothill Farms | 111 | 61,212(0.18%)#95 | 752,337(0.01%)#834 |
| 96. | Norwalk | 110 | 61,212(0.18%)#96 | 752,337(0.01%)#836 |
| 97. | Contra Costa Centre | 110 | 61,212(0.18%)#97 | 752,337(0.01%)#841 |
| 98. | Walnut Creek | 108 | 61,212(0.18%)#98 | 752,337(0.01%)#848 |
| 99. | Ontario | 106 | 61,212(0.17%)#99 | 752,337(0.01%)#864 |
| 100. | Pinole | 105 | 61,212(0.17%)#100 | 752,337(0.01%)#873 |
Common Questions
What are the Top 10 Cities with the Most Immigrants from Eastern Africa in California?
Top 10 Cities with the Most Immigrants from Eastern Africa in California are:
#1
7,915
#2
6,441
#3
4,718
#4
4,652
#5
1,666
#6
1,236
#7
1,135
#8
1,058
#9
778
#10
725
What city has the Most Immigrants from Eastern Africa in California?
Los Angeles has the Most Immigrants from Eastern Africa in California with 7,915.
What is the Total Immigrants from Eastern Africa in the State of California?
Total Immigrants from Eastern Africa in California is 61,212.
What is the Total Immigrants from Eastern Africa in the United States?
Total Immigrants from Eastern Africa in the United States is 752,337.