Cities with the Highest Percentage of Population Employed in Life, Physical & Social Science in California
RELATED REPORTS & OPTIONS
Life, Physical & Social Science
California
Compare Cities
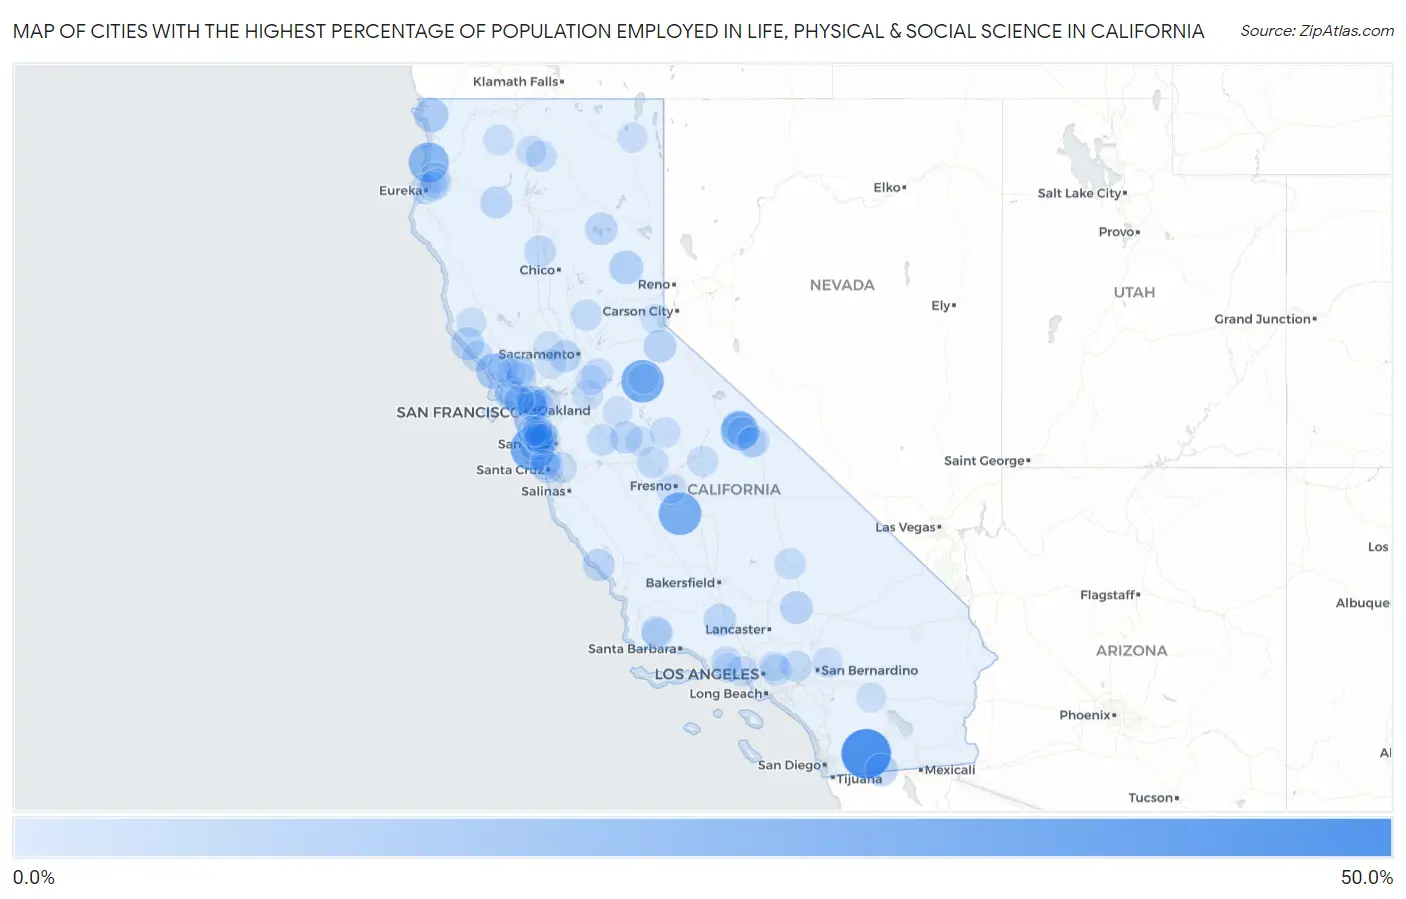
Map of Cities with the Highest Percentage of Population Employed in Life, Physical & Social Science in California
0.0%
50.0%
Cities with the Highest Percentage of Population Employed in Life, Physical & Social Science in California
| City | % Employed | vs State | vs National | |
| 1. | Mount Laguna | 50.0% | 1.3%(+48.7)#1 | 1.1%(+48.9)#16 |
| 2. | Loma Mar | 35.9% | 1.3%(+34.6)#2 | 1.1%(+34.8)#30 |
| 3. | Avery | 33.0% | 1.3%(+31.7)#3 | 1.1%(+31.9)#38 |
| 4. | Grangeville | 32.9% | 1.3%(+31.6)#4 | 1.1%(+31.9)#39 |
| 5. | Big Lagoon | 27.3% | 1.3%(+26.0)#5 | 1.1%(+26.2)#50 |
| 6. | Swall Meadows | 23.3% | 1.3%(+22.0)#6 | 1.1%(+22.2)#59 |
| 7. | Bodega | 16.5% | 1.3%(+15.2)#7 | 1.1%(+15.4)#100 |
| 8. | Hiouchi | 14.3% | 1.3%(+13.0)#8 | 1.1%(+13.2)#129 |
| 9. | Sunny Slopes | 13.3% | 1.3%(+12.0)#9 | 1.1%(+12.2)#149 |
| 10. | Bakersfield Country Club | 13.2% | 1.3%(+11.8)#10 | 1.1%(+12.1)#153 |
| 11. | Graeagle | 12.2% | 1.3%(+10.9)#11 | 1.1%(+11.1)#171 |
| 12. | Stanford | 10.9% | 1.3%(+9.61)#12 | 1.1%(+9.83)#203 |
| 13. | Sea Ranch | 10.7% | 1.3%(+9.35)#13 | 1.1%(+9.56)#209 |
| 14. | Brisbane | 10.6% | 1.3%(+9.28)#14 | 1.1%(+9.49)#211 |
| 15. | Petaluma Center | 10.6% | 1.3%(+9.27)#15 | 1.1%(+9.49)#212 |
| 16. | Boron | 10.0% | 1.3%(+8.74)#16 | 1.1%(+8.95)#225 |
| 17. | Jacumba | 9.9% | 1.3%(+8.60)#17 | 1.1%(+8.82)#232 |
| 18. | Kirkwood | 9.8% | 1.3%(+8.50)#18 | 1.1%(+8.71)#237 |
| 19. | Hamilton Branch | 9.8% | 1.3%(+8.45)#19 | 1.1%(+8.67)#240 |
| 20. | Lake Of The Woods | 9.2% | 1.3%(+7.90)#20 | 1.1%(+8.12)#272 |
| 21. | Cressey | 8.9% | 1.3%(+7.56)#21 | 1.1%(+7.78)#289 |
| 22. | San Simeon | 8.7% | 1.3%(+7.35)#22 | 1.1%(+7.57)#297 |
| 23. | Douglas City | 8.5% | 1.3%(+7.18)#23 | 1.1%(+7.40)#310 |
| 24. | Davis | 8.4% | 1.3%(+7.04)#24 | 1.1%(+7.26)#319 |
| 25. | Kensington | 8.1% | 1.3%(+6.79)#25 | 1.1%(+7.01)#332 |
| 26. | La Honda | 8.0% | 1.3%(+6.72)#26 | 1.1%(+6.93)#339 |
| 27. | Menlo Park | 7.7% | 1.3%(+6.43)#27 | 1.1%(+6.65)#362 |
| 28. | Fort Hunter Liggett | 7.7% | 1.3%(+6.38)#28 | 1.1%(+6.60)#364 |
| 29. | Paradise Park | 7.7% | 1.3%(+6.38)#29 | 1.1%(+6.60)#365 |
| 30. | Richfield | 7.7% | 1.3%(+6.38)#30 | 1.1%(+6.60)#367 |
| 31. | Fairmead | 7.5% | 1.3%(+6.15)#31 | 1.1%(+6.37)#380 |
| 32. | Elfin Forest | 7.3% | 1.3%(+6.00)#32 | 1.1%(+6.22)#392 |
| 33. | San Antonio Heights | 7.3% | 1.3%(+5.98)#33 | 1.1%(+6.20)#394 |
| 34. | West Menlo Park | 7.3% | 1.3%(+5.97)#34 | 1.1%(+6.18)#399 |
| 35. | Crows Landing | 7.1% | 1.3%(+5.76)#35 | 1.1%(+5.98)#424 |
| 36. | Paradise | 7.0% | 1.3%(+5.71)#36 | 1.1%(+5.93)#432 |
| 37. | Bishop | 6.8% | 1.3%(+5.54)#37 | 1.1%(+5.76)#451 |
| 38. | Highlands | 6.8% | 1.3%(+5.50)#38 | 1.1%(+5.72)#457 |
| 39. | Albany | 6.7% | 1.3%(+5.35)#39 | 1.1%(+5.56)#477 |
| 40. | Palo Alto | 6.6% | 1.3%(+5.29)#40 | 1.1%(+5.51)#485 |
| 41. | Clay | 6.4% | 1.3%(+5.12)#41 | 1.1%(+5.33)#510 |
| 42. | Mccloud | 6.4% | 1.3%(+5.08)#42 | 1.1%(+5.29)#517 |
| 43. | Foster City | 6.4% | 1.3%(+5.05)#43 | 1.1%(+5.27)#522 |
| 44. | China Lake Acres | 6.3% | 1.3%(+4.96)#44 | 1.1%(+5.18)#537 |
| 45. | Beale Afb | 6.1% | 1.3%(+4.83)#45 | 1.1%(+5.05)#556 |
| 46. | Ballard | 6.1% | 1.3%(+4.80)#46 | 1.1%(+5.02)#561 |
| 47. | North El Monte | 6.1% | 1.3%(+4.78)#47 | 1.1%(+5.00)#563 |
| 48. | Berkeley | 6.0% | 1.3%(+4.74)#48 | 1.1%(+4.96)#577 |
| 49. | Timber Cove | 6.0% | 1.3%(+4.73)#49 | 1.1%(+4.94)#579 |
| 50. | Nicasio | 6.0% | 1.3%(+4.69)#50 | 1.1%(+4.91)#585 |
| 51. | University Of California-Santa Barbara | 5.9% | 1.3%(+4.63)#51 | 1.1%(+4.85)#593 |
| 52. | Millerton | 5.9% | 1.3%(+4.59)#52 | 1.1%(+4.81)#598 |
| 53. | Topanga | 5.9% | 1.3%(+4.56)#53 | 1.1%(+4.77)#604 |
| 54. | Lompico | 5.8% | 1.3%(+4.50)#54 | 1.1%(+4.72)#614 |
| 55. | Corralitos | 5.8% | 1.3%(+4.49)#55 | 1.1%(+4.71)#615 |
| 56. | Mountain View | 5.7% | 1.3%(+4.41)#56 | 1.1%(+4.62)#630 |
| 57. | Lincoln Village | 5.7% | 1.3%(+4.40)#57 | 1.1%(+4.61)#631 |
| 58. | Arnold | 5.7% | 1.3%(+4.39)#58 | 1.1%(+4.60)#633 |
| 59. | Acalanes Ridge | 5.7% | 1.3%(+4.38)#59 | 1.1%(+4.60)#636 |
| 60. | Shaver Lake | 5.7% | 1.3%(+4.37)#60 | 1.1%(+4.59)#637 |
| 61. | Los Olivos | 5.6% | 1.3%(+4.33)#61 | 1.1%(+4.54)#646 |
| 62. | Mount Shasta | 5.5% | 1.3%(+4.22)#62 | 1.1%(+4.44)#661 |
| 63. | Woodacre | 5.5% | 1.3%(+4.18)#63 | 1.1%(+4.40)#671 |
| 64. | Fieldbrook | 5.5% | 1.3%(+4.17)#64 | 1.1%(+4.39)#674 |
| 65. | Lagunitas Forest Knolls | 5.4% | 1.3%(+4.12)#65 | 1.1%(+4.34)#686 |
| 66. | Etna | 5.4% | 1.3%(+4.10)#66 | 1.1%(+4.31)#695 |
| 67. | Mariposa | 5.3% | 1.3%(+4.03)#67 | 1.1%(+4.25)#708 |
| 68. | Samoa | 5.1% | 1.3%(+3.76)#68 | 1.1%(+3.97)#776 |
| 69. | Orinda | 5.0% | 1.3%(+3.73)#69 | 1.1%(+3.95)#779 |
| 70. | Santa Rosa Valley | 5.0% | 1.3%(+3.70)#70 | 1.1%(+3.91)#787 |
| 71. | Baywood Park | 5.0% | 1.3%(+3.68)#71 | 1.1%(+3.89)#795 |
| 72. | Blue Lake | 5.0% | 1.3%(+3.67)#72 | 1.1%(+3.88)#798 |
| 73. | Emeryville | 4.9% | 1.3%(+3.61)#73 | 1.1%(+3.83)#808 |
| 74. | Alturas | 4.7% | 1.3%(+3.44)#74 | 1.1%(+3.66)#864 |
| 75. | Collierville | 4.7% | 1.3%(+3.44)#75 | 1.1%(+3.65)#866 |
| 76. | Belmont | 4.7% | 1.3%(+3.41)#76 | 1.1%(+3.62)#870 |
| 77. | Felton | 4.6% | 1.3%(+3.32)#77 | 1.1%(+3.54)#900 |
| 78. | Glen Ellen | 4.6% | 1.3%(+3.26)#78 | 1.1%(+3.48)#919 |
| 79. | Corte Madera | 4.5% | 1.3%(+3.23)#79 | 1.1%(+3.45)#940 |
| 80. | Running Springs | 4.5% | 1.3%(+3.18)#80 | 1.1%(+3.40)#953 |
| 81. | East Richmond Heights | 4.5% | 1.3%(+3.18)#81 | 1.1%(+3.39)#959 |
| 82. | Sebastopol | 4.4% | 1.3%(+3.14)#82 | 1.1%(+3.35)#977 |
| 83. | Esparto | 4.4% | 1.3%(+3.13)#83 | 1.1%(+3.35)#978 |
| 84. | Lake Sherwood | 4.4% | 1.3%(+3.10)#84 | 1.1%(+3.32)#990 |
| 85. | University Of California Merced | 4.4% | 1.3%(+3.07)#85 | 1.1%(+3.29)#1,003 |
| 86. | West Bishop | 4.4% | 1.3%(+3.04)#86 | 1.1%(+3.26)#1,017 |
| 87. | Eldridge | 4.3% | 1.3%(+3.04)#87 | 1.1%(+3.26)#1,019 |
| 88. | Temelec | 4.3% | 1.3%(+3.02)#88 | 1.1%(+3.24)#1,032 |
| 89. | Boonville | 4.3% | 1.3%(+2.95)#89 | 1.1%(+3.17)#1,053 |
| 90. | Tahoma | 4.2% | 1.3%(+2.93)#90 | 1.1%(+3.14)#1,065 |
| 91. | Ladera | 4.2% | 1.3%(+2.92)#91 | 1.1%(+3.14)#1,066 |
| 92. | Allendale | 4.2% | 1.3%(+2.90)#92 | 1.1%(+3.12)#1,077 |
| 93. | East Oakdale | 4.2% | 1.3%(+2.85)#93 | 1.1%(+3.07)#1,094 |
| 94. | Penngrove | 4.1% | 1.3%(+2.83)#94 | 1.1%(+3.05)#1,103 |
| 95. | Redwood City | 4.1% | 1.3%(+2.82)#95 | 1.1%(+3.04)#1,108 |
| 96. | Kentfield | 4.1% | 1.3%(+2.79)#96 | 1.1%(+3.01)#1,113 |
| 97. | Indian Wells | 4.1% | 1.3%(+2.78)#97 | 1.1%(+3.00)#1,116 |
| 98. | Sierra Madre | 4.1% | 1.3%(+2.78)#98 | 1.1%(+3.00)#1,119 |
| 99. | West Park | 4.1% | 1.3%(+2.75)#99 | 1.1%(+2.97)#1,132 |
| 100. | Arcata | 4.1% | 1.3%(+2.75)#100 | 1.1%(+2.96)#1,134 |
Common Questions
What are the Top 10 Cities with the Highest Percentage of Population Employed in Life, Physical & Social Science in California?
Top 10 Cities with the Highest Percentage of Population Employed in Life, Physical & Social Science in California are:
#1
50.0%
#2
35.9%
#3
33.0%
#4
32.9%
#5
27.3%
#6
23.3%
#7
16.5%
#8
14.3%
#9
13.3%
#10
12.2%
What city has the Highest Percentage of Population Employed in Life, Physical & Social Science in California?
Mount Laguna has the Highest Percentage of Population Employed in Life, Physical & Social Science in California with 50.0%.
What is the Percentage of Population Employed in Life, Physical & Social Science in the State of California?
Percentage of Population Employed in Life, Physical & Social Science in California is 1.3%.
What is the Percentage of Population Employed in Life, Physical & Social Science in the United States?
Percentage of Population Employed in Life, Physical & Social Science in the United States is 1.1%.