Cities with the Highest Percentage of Population Employed in Accommodation & Food Services in California
RELATED REPORTS & OPTIONS
Accommodation & Food Services
California
Compare Cities
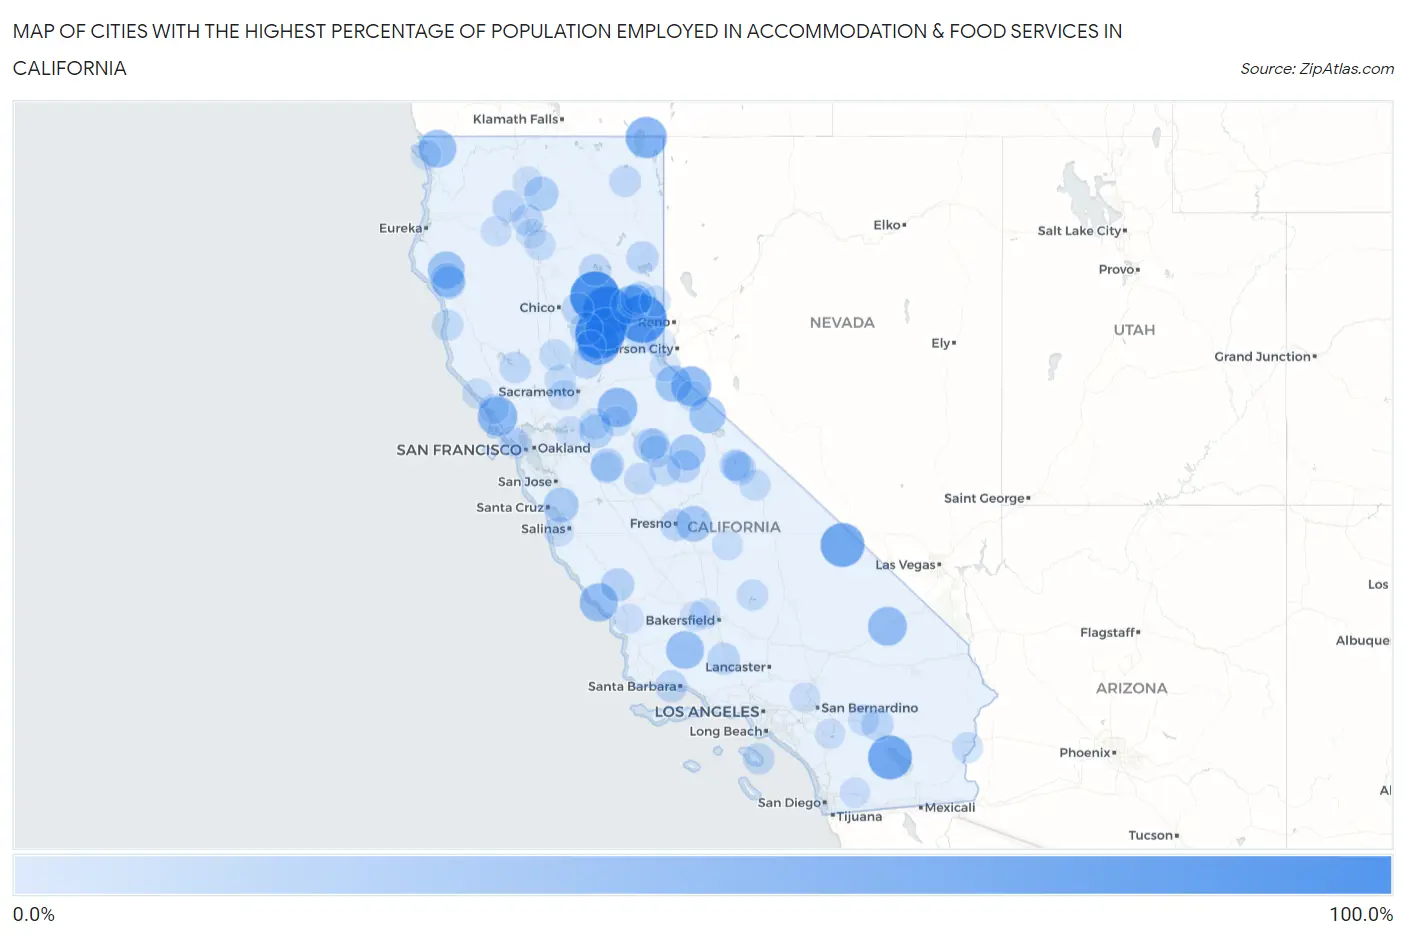
Map of Cities with the Highest Percentage of Population Employed in Accommodation & Food Services in California
0.0%
100.0%
Cities with the Highest Percentage of Population Employed in Accommodation & Food Services in California
| City | % Employed | vs State | vs National | |
| 1. | North San Juan | 100.0% | 7.2%(+92.8)#1 | 6.9%(+93.1)#9 |
| 2. | La Porte | 100.0% | 7.2%(+92.8)#2 | 6.9%(+93.1)#19 |
| 3. | Bucks Lake | 100.0% | 7.2%(+92.8)#3 | 6.9%(+93.1)#28 |
| 4. | Sierraville | 94.6% | 7.2%(+87.4)#4 | 6.9%(+87.7)#38 |
| 5. | Fort Hunter Liggett | 89.2% | 7.2%(+82.1)#5 | 6.9%(+82.3)#39 |
| 6. | Furnace Creek | 75.9% | 7.2%(+68.7)#6 | 6.9%(+69.0)#49 |
| 7. | Salton Sea Beach | 75.5% | 7.2%(+68.3)#7 | 6.9%(+68.6)#51 |
| 8. | Rough And Ready | 69.1% | 7.2%(+62.0)#8 | 6.9%(+62.3)#59 |
| 9. | Salyer | 67.9% | 7.2%(+60.7)#9 | 6.9%(+61.0)#62 |
| 10. | Pike | 67.9% | 7.2%(+60.7)#10 | 6.9%(+61.0)#63 |
| 11. | New Pine Creek | 64.7% | 7.2%(+57.5)#11 | 6.9%(+57.8)#69 |
| 12. | Topaz | 58.6% | 7.2%(+51.4)#12 | 6.9%(+51.7)#100 |
| 13. | Martell | 57.4% | 7.2%(+50.3)#13 | 6.9%(+50.6)#105 |
| 14. | Tomales | 57.1% | 7.2%(+50.0)#14 | 6.9%(+50.3)#107 |
| 15. | Baker | 54.3% | 7.2%(+47.1)#15 | 6.9%(+47.4)#120 |
| 16. | Clio | 52.8% | 7.2%(+45.6)#16 | 6.9%(+45.9)#133 |
| 17. | San Simeon | 52.0% | 7.2%(+44.8)#17 | 6.9%(+45.1)#135 |
| 18. | Gasquet | 50.0% | 7.2%(+42.8)#18 | 6.9%(+43.1)#151 |
| 19. | Cuyama | 50.0% | 7.2%(+42.8)#19 | 6.9%(+43.1)#170 |
| 20. | Miranda | 47.1% | 7.2%(+39.9)#20 | 6.9%(+40.2)#191 |
| 21. | Bridgeport | 44.5% | 7.2%(+37.3)#21 | 6.9%(+37.6)#215 |
| 22. | Markleeville | 43.8% | 7.2%(+36.6)#22 | 6.9%(+36.9)#230 |
| 23. | Minkler | 41.2% | 7.2%(+34.1)#23 | 6.9%(+34.4)#252 |
| 24. | Yosemite Valley | 41.1% | 7.2%(+34.0)#24 | 6.9%(+34.3)#254 |
| 25. | Corralitos | 37.9% | 7.2%(+30.7)#25 | 6.9%(+31.0)#297 |
| 26. | Mccloud | 36.2% | 7.2%(+29.0)#26 | 6.9%(+29.3)#329 |
| 27. | Garberville | 35.4% | 7.2%(+28.3)#27 | 6.9%(+28.5)#342 |
| 28. | Waterloo | 33.6% | 7.2%(+26.4)#28 | 6.9%(+26.7)#375 |
| 29. | Delleker | 33.3% | 7.2%(+26.2)#29 | 6.9%(+26.5)#380 |
| 30. | Bradley | 32.1% | 7.2%(+25.0)#30 | 6.9%(+25.3)#417 |
| 31. | El Centro Naval Air Facility | 31.6% | 7.2%(+24.4)#31 | 6.9%(+24.7)#429 |
| 32. | Groveland | 31.5% | 7.2%(+24.3)#32 | 6.9%(+24.6)#435 |
| 33. | Cowan | 31.5% | 7.2%(+24.3)#33 | 6.9%(+24.6)#436 |
| 34. | Benbow | 31.3% | 7.2%(+24.2)#34 | 6.9%(+24.5)#439 |
| 35. | Hypericum | 31.3% | 7.2%(+24.1)#35 | 6.9%(+24.4)#442 |
| 36. | Rackerby | 31.0% | 7.2%(+23.9)#36 | 6.9%(+24.2)#450 |
| 37. | Wawona | 30.1% | 7.2%(+22.9)#37 | 6.9%(+23.2)#479 |
| 38. | Sheridan | 28.8% | 7.2%(+21.6)#38 | 6.9%(+21.9)#522 |
| 39. | Coffee Creek | 28.4% | 7.2%(+21.3)#39 | 6.9%(+21.5)#544 |
| 40. | Litchfield | 28.4% | 7.2%(+21.2)#40 | 6.9%(+21.5)#547 |
| 41. | Frazier Park | 27.5% | 7.2%(+20.4)#41 | 6.9%(+20.7)#585 |
| 42. | Calwa | 27.0% | 7.2%(+19.9)#42 | 6.9%(+20.1)#608 |
| 43. | Isla Vista | 27.0% | 7.2%(+19.8)#43 | 6.9%(+20.1)#614 |
| 44. | Beckwourth | 26.7% | 7.2%(+19.6)#44 | 6.9%(+19.8)#630 |
| 45. | Swall Meadows | 26.7% | 7.2%(+19.5)#45 | 6.9%(+19.8)#631 |
| 46. | Greeley Hill | 26.6% | 7.2%(+19.5)#46 | 6.9%(+19.7)#635 |
| 47. | Lake Almanor West | 26.3% | 7.2%(+19.1)#47 | 6.9%(+19.4)#651 |
| 48. | Indio Hills | 26.3% | 7.2%(+19.1)#48 | 6.9%(+19.4)#657 |
| 49. | Ridgecrest Heights | 26.2% | 7.2%(+19.0)#49 | 6.9%(+19.3)#659 |
| 50. | Lakehead | 26.1% | 7.2%(+19.0)#50 | 6.9%(+19.3)#661 |
| 51. | California Polytechnic State University | 25.9% | 7.2%(+18.7)#51 | 6.9%(+19.0)#685 |
| 52. | Yankee Hill | 25.9% | 7.2%(+18.7)#52 | 6.9%(+19.0)#686 |
| 53. | University Of California Merced | 25.5% | 7.2%(+18.4)#53 | 6.9%(+18.7)#700 |
| 54. | Aspen Springs | 24.8% | 7.2%(+17.7)#54 | 6.9%(+17.9)#753 |
| 55. | Avalon | 24.8% | 7.2%(+17.6)#55 | 6.9%(+17.9)#756 |
| 56. | Lower Lake | 24.6% | 7.2%(+17.5)#56 | 6.9%(+17.8)#765 |
| 57. | California Pines | 24.6% | 7.2%(+17.4)#57 | 6.9%(+17.7)#768 |
| 58. | Smartsville | 24.3% | 7.2%(+17.2)#58 | 6.9%(+17.4)#787 |
| 59. | Cleone | 23.9% | 7.2%(+16.7)#59 | 6.9%(+17.0)#830 |
| 60. | Monterey Park Tract | 23.8% | 7.2%(+16.6)#60 | 6.9%(+16.9)#833 |
| 61. | Victor | 23.6% | 7.2%(+16.5)#61 | 6.9%(+16.7)#848 |
| 62. | Kernville | 23.6% | 7.2%(+16.5)#62 | 6.9%(+16.7)#849 |
| 63. | Grimes | 23.6% | 7.2%(+16.4)#63 | 6.9%(+16.7)#852 |
| 64. | Portola | 23.5% | 7.2%(+16.3)#64 | 6.9%(+16.6)#860 |
| 65. | Wilkerson | 23.4% | 7.2%(+16.2)#65 | 6.9%(+16.5)#871 |
| 66. | Mariposa | 23.1% | 7.2%(+16.0)#66 | 6.9%(+16.3)#890 |
| 67. | Crowley Lake | 23.0% | 7.2%(+15.8)#67 | 6.9%(+16.1)#914 |
| 68. | Pine Mountain Lake | 22.9% | 7.2%(+15.8)#68 | 6.9%(+16.1)#916 |
| 69. | Garnet | 22.7% | 7.2%(+15.5)#69 | 6.9%(+15.8)#939 |
| 70. | Chilcoot Vinton | 22.4% | 7.2%(+15.2)#70 | 6.9%(+15.5)#961 |
| 71. | Walker | 22.2% | 7.2%(+15.1)#71 | 6.9%(+15.3)#975 |
| 72. | Yolo | 22.2% | 7.2%(+15.1)#72 | 6.9%(+15.3)#976 |
| 73. | Soda Springs | 22.2% | 7.2%(+15.1)#73 | 6.9%(+15.3)#987 |
| 74. | Millville | 22.0% | 7.2%(+14.9)#74 | 6.9%(+15.2)#1,009 |
| 75. | Ripley | 22.0% | 7.2%(+14.9)#75 | 6.9%(+15.2)#1,010 |
| 76. | University Of California Davis | 21.5% | 7.2%(+14.3)#76 | 6.9%(+14.6)#1,058 |
| 77. | Yermo | 21.4% | 7.2%(+14.3)#77 | 6.9%(+14.5)#1,061 |
| 78. | South Lake Tahoe | 21.2% | 7.2%(+14.0)#78 | 6.9%(+14.3)#1,100 |
| 79. | Mexican Colony | 20.8% | 7.2%(+13.6)#79 | 6.9%(+13.9)#1,142 |
| 80. | Three Rivers | 20.8% | 7.2%(+13.6)#80 | 6.9%(+13.9)#1,151 |
| 81. | Timber Cove | 20.7% | 7.2%(+13.5)#81 | 6.9%(+13.8)#1,159 |
| 82. | Weaverville | 20.5% | 7.2%(+13.4)#82 | 6.9%(+13.6)#1,180 |
| 83. | Bodega | 20.0% | 7.2%(+12.8)#83 | 6.9%(+13.1)#1,240 |
| 84. | Lytle Creek | 19.9% | 7.2%(+12.7)#84 | 6.9%(+13.0)#1,268 |
| 85. | Muir Beach | 19.9% | 7.2%(+12.7)#85 | 6.9%(+13.0)#1,269 |
| 86. | Bethel Island | 19.8% | 7.2%(+12.6)#86 | 6.9%(+12.9)#1,281 |
| 87. | Descanso | 19.8% | 7.2%(+12.6)#87 | 6.9%(+12.9)#1,283 |
| 88. | Santa Margarita | 19.7% | 7.2%(+12.5)#88 | 6.9%(+12.8)#1,298 |
| 89. | Seaside | 19.6% | 7.2%(+12.4)#89 | 6.9%(+12.7)#1,318 |
| 90. | Dixon Lane Meadow Creek | 19.5% | 7.2%(+12.4)#90 | 6.9%(+12.7)#1,320 |
| 91. | Bertsch Oceanview | 19.4% | 7.2%(+12.2)#91 | 6.9%(+12.5)#1,350 |
| 92. | Valley Springs | 19.4% | 7.2%(+12.2)#92 | 6.9%(+12.5)#1,355 |
| 93. | Green Acres | 19.4% | 7.2%(+12.2)#93 | 6.9%(+12.5)#1,357 |
| 94. | Weed | 19.1% | 7.2%(+12.0)#94 | 6.9%(+12.3)#1,398 |
| 95. | Buttonwillow | 19.1% | 7.2%(+11.9)#95 | 6.9%(+12.2)#1,407 |
| 96. | Stinson Beach | 18.8% | 7.2%(+11.6)#96 | 6.9%(+11.9)#1,460 |
| 97. | Mountain Gate | 18.7% | 7.2%(+11.5)#97 | 6.9%(+11.8)#1,474 |
| 98. | Sonoma State University | 18.6% | 7.2%(+11.5)#98 | 6.9%(+11.8)#1,484 |
| 99. | Tahoe Vista | 18.4% | 7.2%(+11.2)#99 | 6.9%(+11.5)#1,531 |
| 100. | Knights Ferry | 18.2% | 7.2%(+11.0)#100 | 6.9%(+11.3)#1,590 |
Common Questions
What are the Top 10 Cities with the Highest Percentage of Population Employed in Accommodation & Food Services in California?
Top 10 Cities with the Highest Percentage of Population Employed in Accommodation & Food Services in California are:
#1
100.0%
#2
100.0%
#3
100.0%
#4
94.6%
#5
75.9%
#6
75.5%
#7
69.1%
#8
67.9%
#9
64.7%
#10
58.6%
What city has the Highest Percentage of Population Employed in Accommodation & Food Services in California?
North San Juan has the Highest Percentage of Population Employed in Accommodation & Food Services in California with 100.0%.
What is the Percentage of Population Employed in Accommodation & Food Services in the State of California?
Percentage of Population Employed in Accommodation & Food Services in California is 7.2%.
What is the Percentage of Population Employed in Accommodation & Food Services in the United States?
Percentage of Population Employed in Accommodation & Food Services in the United States is 6.9%.