Zip Codes with the Highest Percentage of Population Employed in Installation, Maintenance & Repair in Mountain View, CA
RELATED REPORTS & OPTIONS
Installation, Maintenance & Repair
Mountain View
Compare Zip Codes
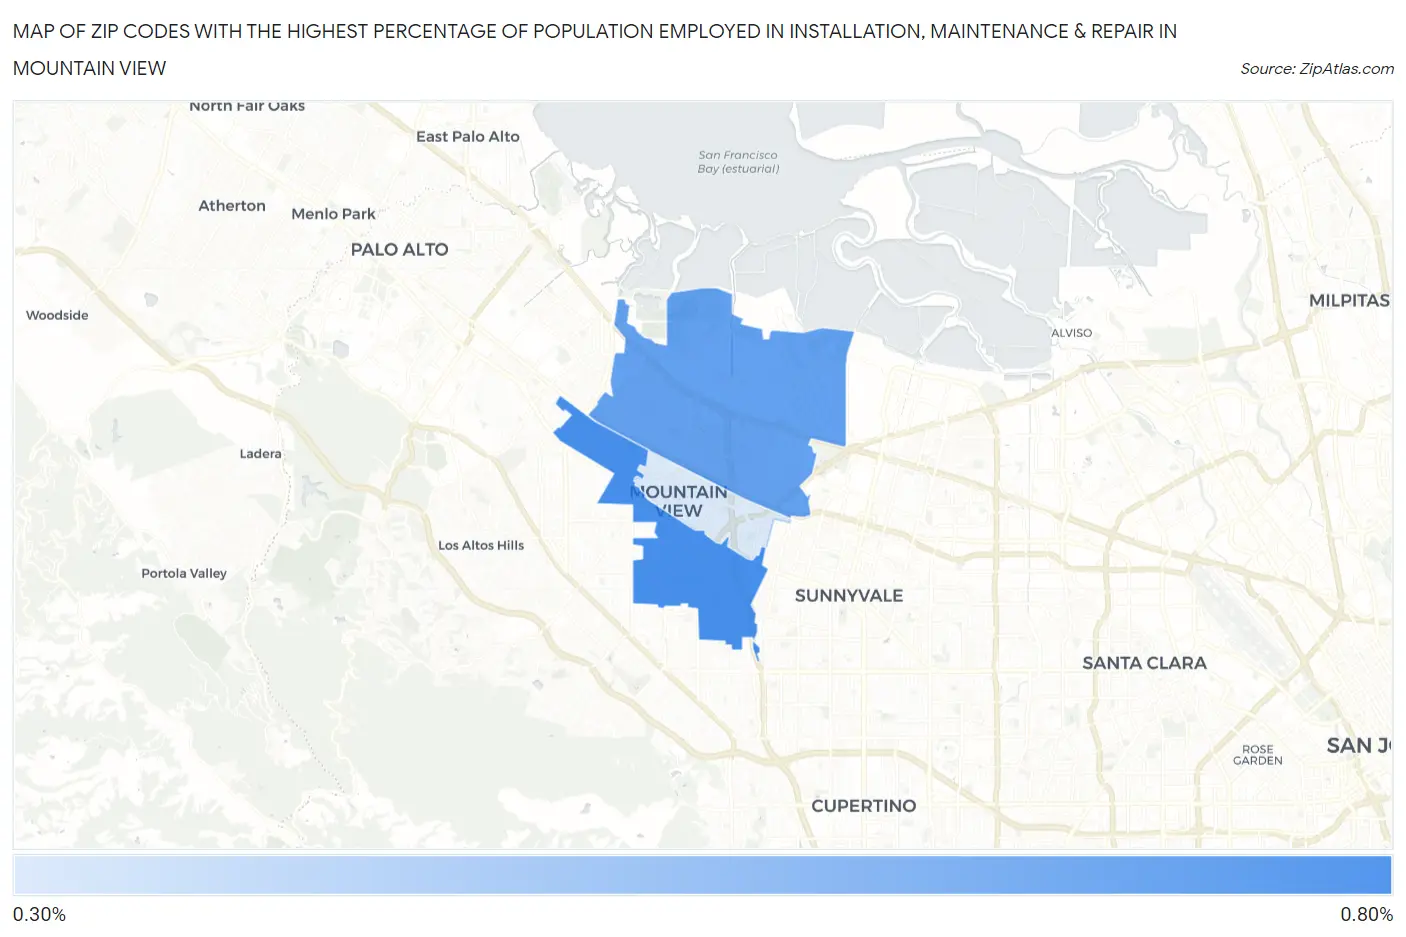
Map of Zip Codes with the Highest Percentage of Population Employed in Installation, Maintenance & Repair in Mountain View
0.32%
0.61%
Zip Codes with the Highest Percentage of Population Employed in Installation, Maintenance & Repair in Mountain View, CA
| Zip Code | % Employed | vs State | vs National | |
| 1. | 94040 | 0.61% | 2.6%(-1.94)#1,348 | 3.1%(-2.45)#26,977 |
| 2. | 94043 | 0.56% | 2.6%(-2.00)#1,358 | 3.1%(-2.51)#27,098 |
| 3. | 94041 | 0.32% | 2.6%(-2.24)#1,411 | 3.1%(-2.75)#27,536 |
1
Common Questions
What are the Top Zip Codes with the Highest Percentage of Population Employed in Installation, Maintenance & Repair in Mountain View, CA?
Top Zip Codes with the Highest Percentage of Population Employed in Installation, Maintenance & Repair in Mountain View, CA are:
What zip code has the Highest Percentage of Population Employed in Installation, Maintenance & Repair in Mountain View, CA?
94040 has the Highest Percentage of Population Employed in Installation, Maintenance & Repair in Mountain View, CA with 0.61%.
What is the Percentage of Population Employed in Installation, Maintenance & Repair in Mountain View, CA?
Percentage of Population Employed in Installation, Maintenance & Repair in Mountain View is 0.53%.
What is the Percentage of Population Employed in Installation, Maintenance & Repair in California?
Percentage of Population Employed in Installation, Maintenance & Repair in California is 2.6%.
What is the Percentage of Population Employed in Installation, Maintenance & Repair in the United States?
Percentage of Population Employed in Installation, Maintenance & Repair in the United States is 3.1%.