Cities with the Highest Percentage of African Population in California
RELATED REPORTS & OPTIONS
African
California
Compare Cities
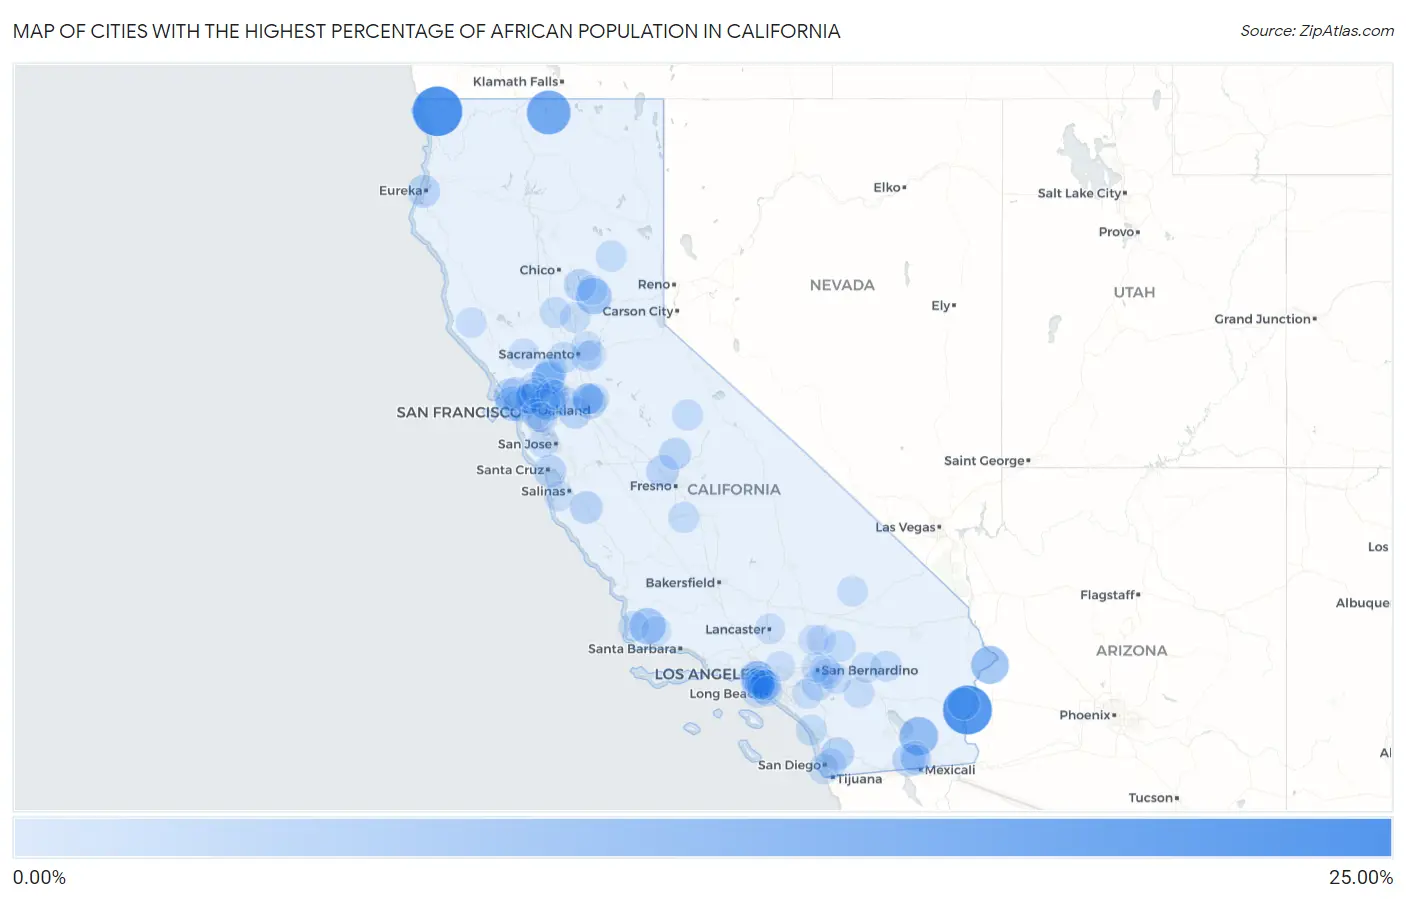
Map of Cities with the Highest Percentage of African Population in California
0.00%
25.00%
Cities with the Highest Percentage of African Population in California
| City | African | vs State | vs National | |
| 1. | Gasquet | 20.77% | 0.37%(+20.4)#1 | 0.57%(+20.2)#31 |
| 2. | Ripley | 20.03% | 0.37%(+19.7)#2 | 0.57%(+19.5)#32 |
| 3. | Macdoel | 14.69% | 0.37%(+14.3)#3 | 0.57%(+14.1)#58 |
| 4. | Calipatria | 9.24% | 0.37%(+8.87)#4 | 0.57%(+8.68)#116 |
| 5. | Bluewater | 8.38% | 0.37%(+8.02)#5 | 0.57%(+7.82)#139 |
| 6. | Shell Ridge | 6.92% | 0.37%(+6.55)#6 | 0.57%(+6.35)#201 |
| 7. | Los Alamos | 6.83% | 0.37%(+6.47)#7 | 0.57%(+6.27)#204 |
| 8. | Dobbins | 6.67% | 0.37%(+6.30)#8 | 0.57%(+6.10)#209 |
| 9. | El Centro Naval Air Facility | 5.19% | 0.37%(+4.83)#9 | 0.57%(+4.63)#301 |
| 10. | Stinson Beach | 5.12% | 0.37%(+4.75)#10 | 0.57%(+4.56)#310 |
| 11. | Camp Pendleton Mainside | 4.75% | 0.37%(+4.38)#11 | 0.57%(+4.19)#344 |
| 12. | Suisun City | 4.35% | 0.37%(+3.98)#12 | 0.57%(+3.78)#394 |
| 13. | Marin City | 4.24% | 0.37%(+3.87)#13 | 0.57%(+3.68)#408 |
| 14. | Ladera Heights | 4.16% | 0.37%(+3.79)#14 | 0.57%(+3.59)#418 |
| 15. | Seeley | 3.76% | 0.37%(+3.39)#15 | 0.57%(+3.19)#463 |
| 16. | Eucalyptus Hills | 3.67% | 0.37%(+3.30)#16 | 0.57%(+3.10)#479 |
| 17. | Taft Mosswood | 3.55% | 0.37%(+3.18)#17 | 0.57%(+2.98)#499 |
| 18. | Lagunitas Forest Knolls | 3.49% | 0.37%(+3.12)#18 | 0.57%(+2.93)#511 |
| 19. | Soledad | 3.31% | 0.37%(+2.95)#19 | 0.57%(+2.75)#538 |
| 20. | Fairhaven | 3.23% | 0.37%(+2.86)#20 | 0.57%(+2.66)#560 |
| 21. | View Park Windsor Hills | 3.19% | 0.37%(+2.83)#21 | 0.57%(+2.63)#570 |
| 22. | Parksdale | 3.16% | 0.37%(+2.79)#22 | 0.57%(+2.59)#578 |
| 23. | Twin Lakes | 3.14% | 0.37%(+2.78)#23 | 0.57%(+2.58)#586 |
| 24. | Kelly Ridge | 3.09% | 0.37%(+2.73)#24 | 0.57%(+2.53)#601 |
| 25. | Fairfield | 3.08% | 0.37%(+2.71)#25 | 0.57%(+2.51)#606 |
| 26. | Mountain House | 3.04% | 0.37%(+2.67)#26 | 0.57%(+2.47)#617 |
| 27. | Blythe | 2.90% | 0.37%(+2.53)#27 | 0.57%(+2.33)#656 |
| 28. | Yosemite Lakes | 2.60% | 0.37%(+2.23)#28 | 0.57%(+2.03)#745 |
| 29. | West Athens | 2.21% | 0.37%(+1.85)#29 | 0.57%(+1.65)#905 |
| 30. | Vacaville | 2.04% | 0.37%(+1.67)#30 | 0.57%(+1.47)#1,000 |
| 31. | Lucerne Valley | 2.01% | 0.37%(+1.65)#31 | 0.57%(+1.45)#1,018 |
| 32. | March Arb | 1.96% | 0.37%(+1.59)#32 | 0.57%(+1.39)#1,050 |
| 33. | University Of California Davis | 1.96% | 0.37%(+1.59)#33 | 0.57%(+1.39)#1,051 |
| 34. | East Quincy | 1.83% | 0.37%(+1.47)#34 | 0.57%(+1.27)#1,129 |
| 35. | Yosemite Valley | 1.73% | 0.37%(+1.36)#35 | 0.57%(+1.16)#1,200 |
| 36. | Home Garden | 1.72% | 0.37%(+1.35)#36 | 0.57%(+1.16)#1,206 |
| 37. | Green Valley Cdp Solano County | 1.70% | 0.37%(+1.34)#37 | 0.57%(+1.14)#1,222 |
| 38. | Stockton | 1.67% | 0.37%(+1.30)#38 | 0.57%(+1.10)#1,256 |
| 39. | Camp Pendleton South | 1.61% | 0.37%(+1.24)#39 | 0.57%(+1.04)#1,318 |
| 40. | Meridian | 1.60% | 0.37%(+1.23)#40 | 0.57%(+1.03)#1,330 |
| 41. | Pleasant Hill | 1.59% | 0.37%(+1.22)#41 | 0.57%(+1.03)#1,333 |
| 42. | Twentynine Palms | 1.58% | 0.37%(+1.22)#42 | 0.57%(+1.02)#1,340 |
| 43. | Inglewood | 1.50% | 0.37%(+1.13)#43 | 0.57%(+0.933)#1,409 |
| 44. | Rolling Hills Estates | 1.50% | 0.37%(+1.13)#44 | 0.57%(+0.932)#1,410 |
| 45. | Garden Acres | 1.49% | 0.37%(+1.12)#45 | 0.57%(+0.926)#1,419 |
| 46. | Hawthorne | 1.49% | 0.37%(+1.12)#46 | 0.57%(+0.926)#1,420 |
| 47. | Palm Springs | 1.47% | 0.37%(+1.10)#47 | 0.57%(+0.901)#1,456 |
| 48. | Coronado | 1.43% | 0.37%(+1.06)#48 | 0.57%(+0.860)#1,507 |
| 49. | Lemon Grove | 1.42% | 0.37%(+1.05)#49 | 0.57%(+0.854)#1,515 |
| 50. | Country Club | 1.41% | 0.37%(+1.05)#50 | 0.57%(+0.849)#1,519 |
| 51. | Westmont | 1.40% | 0.37%(+1.04)#51 | 0.57%(+0.838)#1,535 |
| 52. | Lucas Valley Marinwood | 1.37% | 0.37%(+1.01)#52 | 0.57%(+0.808)#1,570 |
| 53. | East Rancho Dominguez | 1.37% | 0.37%(+1.00)#53 | 0.57%(+0.802)#1,581 |
| 54. | El Centro | 1.32% | 0.37%(+0.955)#54 | 0.57%(+0.756)#1,643 |
| 55. | Olivehurst | 1.31% | 0.37%(+0.948)#55 | 0.57%(+0.750)#1,659 |
| 56. | Fort Irwin | 1.30% | 0.37%(+0.938)#56 | 0.57%(+0.739)#1,669 |
| 57. | Old Stine | 1.30% | 0.37%(+0.934)#57 | 0.57%(+0.736)#1,679 |
| 58. | Carson | 1.30% | 0.37%(+0.932)#58 | 0.57%(+0.733)#1,680 |
| 59. | Rosemont | 1.30% | 0.37%(+0.929)#59 | 0.57%(+0.731)#1,685 |
| 60. | Yucca Valley | 1.29% | 0.37%(+0.924)#60 | 0.57%(+0.725)#1,697 |
| 61. | Vandenberg Afb | 1.25% | 0.37%(+0.883)#61 | 0.57%(+0.684)#1,746 |
| 62. | Compton | 1.23% | 0.37%(+0.867)#62 | 0.57%(+0.669)#1,770 |
| 63. | Vallejo | 1.23% | 0.37%(+0.859)#63 | 0.57%(+0.661)#1,781 |
| 64. | West Rancho Dominguez | 1.20% | 0.37%(+0.835)#64 | 0.57%(+0.636)#1,808 |
| 65. | Loyola | 1.15% | 0.37%(+0.786)#65 | 0.57%(+0.587)#1,880 |
| 66. | Angwin | 1.14% | 0.37%(+0.768)#66 | 0.57%(+0.570)#1,900 |
| 67. | Highland | 1.13% | 0.37%(+0.767)#67 | 0.57%(+0.569)#1,902 |
| 68. | Imperial | 1.13% | 0.37%(+0.759)#68 | 0.57%(+0.560)#1,913 |
| 69. | Pinole | 1.12% | 0.37%(+0.752)#69 | 0.57%(+0.554)#1,934 |
| 70. | Cherry Valley | 1.11% | 0.37%(+0.744)#70 | 0.57%(+0.545)#1,952 |
| 71. | North Richmond | 1.10% | 0.37%(+0.731)#71 | 0.57%(+0.533)#1,970 |
| 72. | Richmond | 1.09% | 0.37%(+0.720)#72 | 0.57%(+0.522)#1,987 |
| 73. | Duarte | 1.07% | 0.37%(+0.708)#73 | 0.57%(+0.509)#2,012 |
| 74. | Signal Hill | 1.05% | 0.37%(+0.687)#74 | 0.57%(+0.488)#2,047 |
| 75. | Victorville | 1.02% | 0.37%(+0.656)#75 | 0.57%(+0.458)#2,096 |
| 76. | Spring Valley Cdp Lake County | 1.01% | 0.37%(+0.646)#76 | 0.57%(+0.447)#2,111 |
| 77. | Boonville | 1.01% | 0.37%(+0.638)#77 | 0.57%(+0.440)#2,121 |
| 78. | Brentwood | 1.00% | 0.37%(+0.631)#78 | 0.57%(+0.432)#2,136 |
| 79. | Lancaster | 1.00% | 0.37%(+0.631)#79 | 0.57%(+0.432)#2,139 |
| 80. | Sonoma State University | 1.00% | 0.37%(+0.629)#80 | 0.57%(+0.431)#2,144 |
| 81. | Mentone | 0.99% | 0.37%(+0.622)#81 | 0.57%(+0.424)#2,159 |
| 82. | Los Olivos | 0.98% | 0.37%(+0.614)#82 | 0.57%(+0.415)#2,171 |
| 83. | Bay Point | 0.97% | 0.37%(+0.604)#83 | 0.57%(+0.406)#2,195 |
| 84. | Bonadelle Ranchos | 0.94% | 0.37%(+0.574)#84 | 0.57%(+0.375)#2,252 |
| 85. | Temescal Valley | 0.93% | 0.37%(+0.565)#85 | 0.57%(+0.366)#2,273 |
| 86. | Ashland | 0.90% | 0.37%(+0.531)#86 | 0.57%(+0.333)#2,352 |
| 87. | Del Rey Oaks | 0.87% | 0.37%(+0.502)#87 | 0.57%(+0.304)#2,414 |
| 88. | Saranap | 0.86% | 0.37%(+0.497)#88 | 0.57%(+0.298)#2,425 |
| 89. | Oakland | 0.86% | 0.37%(+0.493)#89 | 0.57%(+0.295)#2,435 |
| 90. | Crockett | 0.84% | 0.37%(+0.473)#90 | 0.57%(+0.274)#2,482 |
| 91. | Foothill Farms | 0.82% | 0.37%(+0.457)#91 | 0.57%(+0.258)#2,520 |
| 92. | Challenge Brownsville | 0.81% | 0.37%(+0.442)#92 | 0.57%(+0.243)#2,558 |
| 93. | Gardena | 0.80% | 0.37%(+0.438)#93 | 0.57%(+0.240)#2,570 |
| 94. | Spring Valley Cdp San Diego County | 0.79% | 0.37%(+0.427)#94 | 0.57%(+0.229)#2,605 |
| 95. | San Bernardino | 0.79% | 0.37%(+0.427)#95 | 0.57%(+0.228)#2,607 |
| 96. | San Leandro | 0.79% | 0.37%(+0.419)#96 | 0.57%(+0.220)#2,630 |
| 97. | El Sobrante Cdp Riverside County | 0.78% | 0.37%(+0.417)#97 | 0.57%(+0.218)#2,633 |
| 98. | Apple Valley | 0.74% | 0.37%(+0.371)#98 | 0.57%(+0.173)#2,774 |
| 99. | Rancho Cordova | 0.74% | 0.37%(+0.369)#99 | 0.57%(+0.170)#2,780 |
| 100. | Pittsburg | 0.73% | 0.37%(+0.366)#100 | 0.57%(+0.167)#2,789 |
Common Questions
What are the Top 10 Cities with the Highest Percentage of African Population in California?
Top 10 Cities with the Highest Percentage of African Population in California are:
#1
20.77%
#2
20.03%
#3
14.69%
#4
9.24%
#5
8.38%
#6
6.92%
#7
6.83%
#8
6.67%
#9
5.12%
#10
4.35%
What city has the Highest Percentage of African Population in California?
Gasquet has the Highest Percentage of African Population in California with 20.77%.
What is the Percentage of African Population in the State of California?
Percentage of African Population in California is 0.37%.
What is the Percentage of African Population in the United States?
Percentage of African Population in the United States is 0.57%.