Cities with the Highest Percentage of Population Employed in Installation, Maintenance & Repair in Minnesota
RELATED REPORTS & OPTIONS
Installation, Maintenance & Repair
Minnesota
Compare Cities
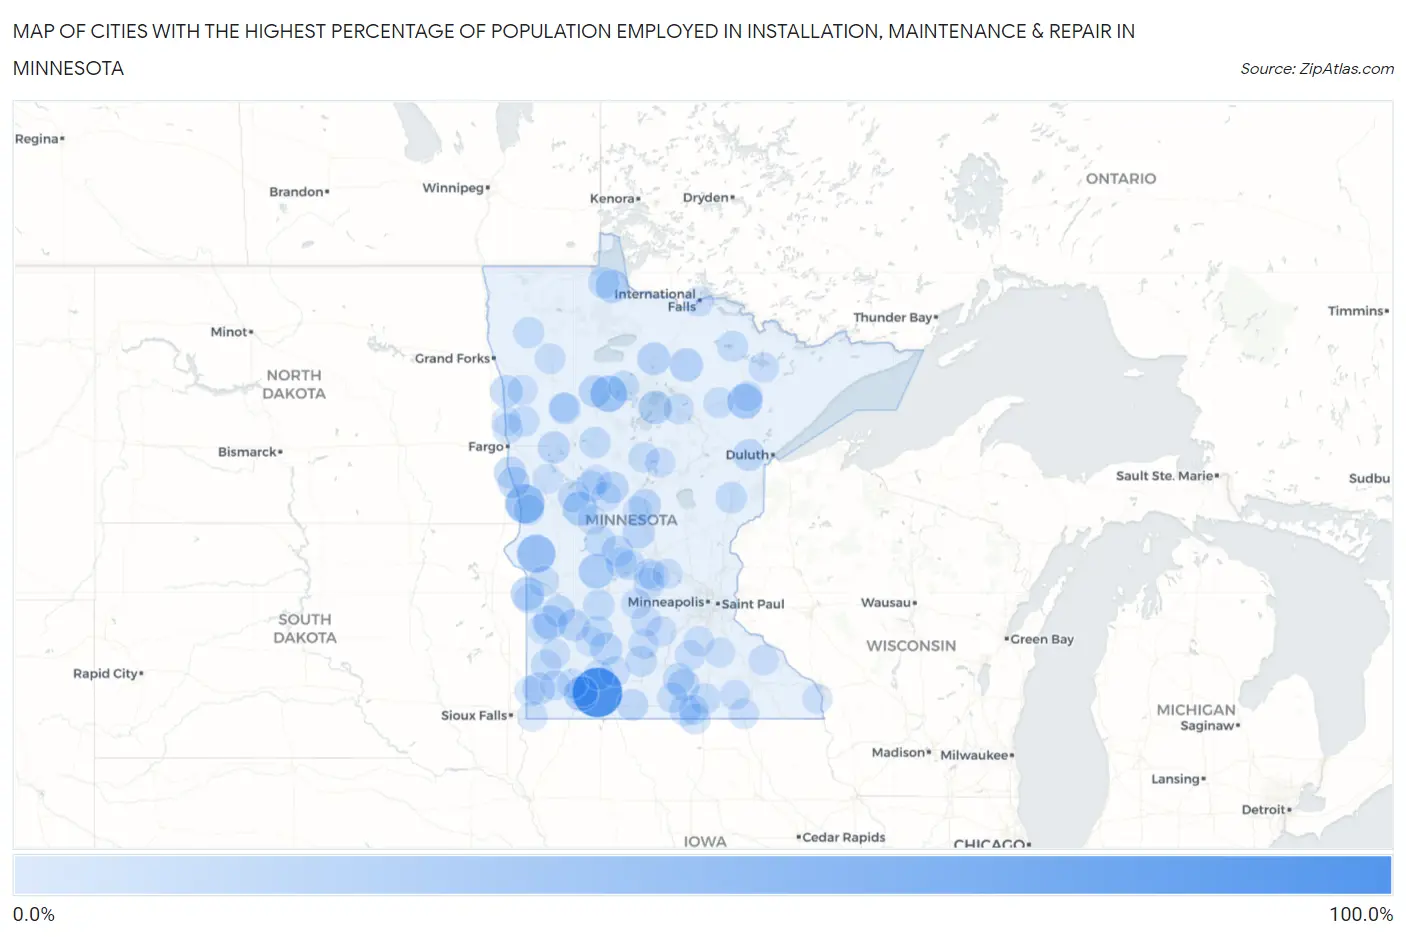
Map of Cities with the Highest Percentage of Population Employed in Installation, Maintenance & Repair in Minnesota
0.0%
100.0%
Cities with the Highest Percentage of Population Employed in Installation, Maintenance & Repair in Minnesota
| City | % Employed | vs State | vs National | |
| 1. | Wilder | 81.8% | 2.9%(+78.9)#1 | 3.1%(+78.8)#22 |
| 2. | Doran | 41.7% | 2.9%(+38.8)#2 | 3.1%(+38.6)#131 |
| 3. | Johnson | 38.5% | 2.9%(+35.6)#3 | 3.1%(+35.4)#160 |
| 4. | Wilton | 32.1% | 2.9%(+29.2)#4 | 3.1%(+29.0)#250 |
| 5. | Iron Junction | 26.7% | 2.9%(+23.8)#5 | 3.1%(+23.6)#361 |
| 6. | Sunburg | 25.7% | 2.9%(+22.8)#6 | 3.1%(+22.6)#385 |
| 7. | Kinbrae | 25.0% | 2.9%(+22.1)#7 | 3.1%(+21.9)#431 |
| 8. | Urbank | 24.0% | 2.9%(+21.1)#8 | 3.1%(+20.9)#460 |
| 9. | High Forest | 23.1% | 2.9%(+20.2)#9 | 3.1%(+20.0)#493 |
| 10. | St Leo | 22.8% | 2.9%(+19.9)#10 | 3.1%(+19.7)#512 |
| 11. | Williams | 21.7% | 2.9%(+18.9)#11 | 3.1%(+18.7)#557 |
| 12. | Nassau | 21.1% | 2.9%(+18.2)#12 | 3.1%(+18.0)#600 |
| 13. | Bena | 20.6% | 2.9%(+17.7)#13 | 3.1%(+17.5)#630 |
| 14. | Effie | 20.4% | 2.9%(+17.5)#14 | 3.1%(+17.3)#642 |
| 15. | Mizpah | 18.8% | 2.9%(+15.9)#15 | 3.1%(+15.7)#752 |
| 16. | Clements | 17.5% | 2.9%(+14.7)#16 | 3.1%(+14.5)#859 |
| 17. | Nielsville | 17.2% | 2.9%(+14.4)#17 | 3.1%(+14.2)#879 |
| 18. | Shevlin | 17.1% | 2.9%(+14.2)#18 | 3.1%(+14.0)#893 |
| 19. | Audubon | 16.7% | 2.9%(+13.8)#19 | 3.1%(+13.6)#930 |
| 20. | Elmdale | 16.7% | 2.9%(+13.8)#20 | 3.1%(+13.6)#936 |
| 21. | Trosky | 16.7% | 2.9%(+13.8)#21 | 3.1%(+13.6)#947 |
| 22. | Wolverton | 16.4% | 2.9%(+13.6)#22 | 3.1%(+13.4)#974 |
| 23. | Hanley Falls | 16.1% | 2.9%(+13.2)#23 | 3.1%(+13.0)#1,015 |
| 24. | Aldrich | 15.8% | 2.9%(+12.9)#24 | 3.1%(+12.7)#1,045 |
| 25. | Kent | 15.8% | 2.9%(+12.9)#25 | 3.1%(+12.7)#1,046 |
| 26. | Waldorf | 15.7% | 2.9%(+12.8)#26 | 3.1%(+12.6)#1,051 |
| 27. | Fort Ripley | 15.6% | 2.9%(+12.7)#27 | 3.1%(+12.6)#1,059 |
| 28. | Mahnomen | 15.4% | 2.9%(+12.5)#28 | 3.1%(+12.3)#1,084 |
| 29. | Boyd | 15.4% | 2.9%(+12.5)#29 | 3.1%(+12.3)#1,085 |
| 30. | Welcome | 15.3% | 2.9%(+12.4)#30 | 3.1%(+12.2)#1,107 |
| 31. | Greenwald | 15.3% | 2.9%(+12.4)#31 | 3.1%(+12.2)#1,113 |
| 32. | Clitherall | 15.1% | 2.9%(+12.2)#32 | 3.1%(+12.0)#1,140 |
| 33. | Midway | 14.3% | 2.9%(+11.4)#33 | 3.1%(+11.2)#1,282 |
| 34. | Rutledge | 14.0% | 2.9%(+11.1)#34 | 3.1%(+10.9)#1,333 |
| 35. | Osage | 13.9% | 2.9%(+11.0)#35 | 3.1%(+10.9)#1,355 |
| 36. | Roosevelt | 13.9% | 2.9%(+11.0)#36 | 3.1%(+10.8)#1,370 |
| 37. | Pemberton | 13.7% | 2.9%(+10.8)#37 | 3.1%(+10.6)#1,393 |
| 38. | Westport | 13.6% | 2.9%(+10.8)#38 | 3.1%(+10.6)#1,409 |
| 39. | Walters | 13.3% | 2.9%(+10.5)#39 | 3.1%(+10.3)#1,489 |
| 40. | Prinsburg | 13.1% | 2.9%(+10.2)#40 | 3.1%(+10.0)#1,540 |
| 41. | Searles | 12.8% | 2.9%(+9.94)#41 | 3.1%(+9.75)#1,622 |
| 42. | Viking | 12.8% | 2.9%(+9.89)#42 | 3.1%(+9.70)#1,639 |
| 43. | Orr | 12.8% | 2.9%(+9.88)#43 | 3.1%(+9.69)#1,641 |
| 44. | Borup | 12.5% | 2.9%(+9.62)#44 | 3.1%(+9.43)#1,700 |
| 45. | Lake Henry | 12.5% | 2.9%(+9.62)#45 | 3.1%(+9.43)#1,704 |
| 46. | Delhi | 12.5% | 2.9%(+9.62)#46 | 3.1%(+9.43)#1,713 |
| 47. | Clarks Grove | 12.3% | 2.9%(+9.45)#47 | 3.1%(+9.26)#1,739 |
| 48. | Emmons | 12.0% | 2.9%(+9.17)#48 | 3.1%(+8.98)#1,811 |
| 49. | Turtle River | 12.0% | 2.9%(+9.12)#49 | 3.1%(+8.93)#1,832 |
| 50. | Deer Creek | 11.8% | 2.9%(+8.94)#50 | 3.1%(+8.75)#1,881 |
| 51. | Kingston | 11.7% | 2.9%(+8.77)#51 | 3.1%(+8.58)#1,930 |
| 52. | Georgetown | 11.5% | 2.9%(+8.66)#52 | 3.1%(+8.47)#1,971 |
| 53. | Dundee | 11.4% | 2.9%(+8.55)#53 | 3.1%(+8.36)#2,014 |
| 54. | Jasper | 11.3% | 2.9%(+8.43)#54 | 3.1%(+8.24)#2,050 |
| 55. | Campbell | 11.3% | 2.9%(+8.41)#55 | 3.1%(+8.22)#2,054 |
| 56. | Plummer | 11.1% | 2.9%(+8.24)#56 | 3.1%(+8.04)#2,101 |
| 57. | Zemple | 11.1% | 2.9%(+8.24)#57 | 3.1%(+8.04)#2,113 |
| 58. | Correll | 11.1% | 2.9%(+8.24)#58 | 3.1%(+8.04)#2,123 |
| 59. | Easton | 11.0% | 2.9%(+8.10)#59 | 3.1%(+7.91)#2,153 |
| 60. | Roscoe | 10.9% | 2.9%(+8.03)#60 | 3.1%(+7.84)#2,172 |
| 61. | Ruthton | 10.8% | 2.9%(+7.93)#61 | 3.1%(+7.74)#2,214 |
| 62. | Keewatin | 10.8% | 2.9%(+7.92)#62 | 3.1%(+7.73)#2,218 |
| 63. | Chickamaw Beach | 10.7% | 2.9%(+7.84)#63 | 3.1%(+7.65)#2,245 |
| 64. | Brownton | 10.6% | 2.9%(+7.75)#64 | 3.1%(+7.56)#2,276 |
| 65. | Cedar Mills | 10.5% | 2.9%(+7.65)#65 | 3.1%(+7.46)#2,330 |
| 66. | South Haven | 10.4% | 2.9%(+7.50)#66 | 3.1%(+7.31)#2,379 |
| 67. | Bluffton | 10.3% | 2.9%(+7.47)#67 | 3.1%(+7.28)#2,396 |
| 68. | Leonidas | 10.3% | 2.9%(+7.47)#68 | 3.1%(+7.28)#2,402 |
| 69. | Arlington | 10.3% | 2.9%(+7.41)#69 | 3.1%(+7.22)#2,425 |
| 70. | Comfrey | 10.2% | 2.9%(+7.35)#70 | 3.1%(+7.16)#2,456 |
| 71. | International Falls | 10.2% | 2.9%(+7.34)#71 | 3.1%(+7.15)#2,460 |
| 72. | Millville | 10.2% | 2.9%(+7.33)#72 | 3.1%(+7.14)#2,468 |
| 73. | Lonsdale | 10.1% | 2.9%(+7.25)#73 | 3.1%(+7.06)#2,496 |
| 74. | Tower | 10.1% | 2.9%(+7.23)#74 | 3.1%(+7.04)#2,510 |
| 75. | Lafayette | 10.1% | 2.9%(+7.21)#75 | 3.1%(+7.02)#2,516 |
| 76. | Taopi | 10.0% | 2.9%(+7.12)#76 | 3.1%(+6.93)#2,568 |
| 77. | Marion | 9.8% | 2.9%(+6.96)#77 | 3.1%(+6.77)#2,650 |
| 78. | Conger | 9.8% | 2.9%(+6.96)#78 | 3.1%(+6.77)#2,654 |
| 79. | Avoca | 9.8% | 2.9%(+6.88)#79 | 3.1%(+6.69)#2,698 |
| 80. | Kimball | 9.7% | 2.9%(+6.83)#80 | 3.1%(+6.64)#2,727 |
| 81. | Porter | 9.7% | 2.9%(+6.83)#81 | 3.1%(+6.64)#2,730 |
| 82. | Kilkenny | 9.7% | 2.9%(+6.80)#82 | 3.1%(+6.61)#2,752 |
| 83. | Beltrami | 9.6% | 2.9%(+6.74)#83 | 3.1%(+6.55)#2,788 |
| 84. | Crosslake | 9.6% | 2.9%(+6.71)#84 | 3.1%(+6.52)#2,795 |
| 85. | Chandler | 9.5% | 2.9%(+6.65)#85 | 3.1%(+6.46)#2,822 |
| 86. | Sargeant | 9.4% | 2.9%(+6.50)#86 | 3.1%(+6.31)#2,915 |
| 87. | Seaforth | 9.3% | 2.9%(+6.43)#87 | 3.1%(+6.23)#2,949 |
| 88. | Hills | 9.3% | 2.9%(+6.41)#88 | 3.1%(+6.22)#2,953 |
| 89. | Nerstrand | 9.2% | 2.9%(+6.37)#89 | 3.1%(+6.18)#2,980 |
| 90. | Hokah | 9.2% | 2.9%(+6.33)#90 | 3.1%(+6.14)#3,001 |
| 91. | Bertha | 9.2% | 2.9%(+6.31)#91 | 3.1%(+6.12)#3,009 |
| 92. | Carlos | 9.2% | 2.9%(+6.29)#92 | 3.1%(+6.10)#3,027 |
| 93. | Randall | 9.1% | 2.9%(+6.24)#93 | 3.1%(+6.05)#3,043 |
| 94. | Marietta | 9.1% | 2.9%(+6.21)#94 | 3.1%(+6.02)#3,064 |
| 95. | Silver Creek | 9.1% | 2.9%(+6.21)#95 | 3.1%(+6.02)#3,069 |
| 96. | Beaulieu | 9.1% | 2.9%(+6.21)#96 | 3.1%(+6.02)#3,080 |
| 97. | Russell | 9.0% | 2.9%(+6.09)#97 | 3.1%(+5.90)#3,143 |
| 98. | Perley | 8.8% | 2.9%(+5.90)#98 | 3.1%(+5.70)#3,282 |
| 99. | Jeffers | 8.8% | 2.9%(+5.88)#99 | 3.1%(+5.69)#3,292 |
| 100. | Erhard | 8.7% | 2.9%(+5.87)#100 | 3.1%(+5.68)#3,300 |
Common Questions
What are the Top 10 Cities with the Highest Percentage of Population Employed in Installation, Maintenance & Repair in Minnesota?
Top 10 Cities with the Highest Percentage of Population Employed in Installation, Maintenance & Repair in Minnesota are:
What city has the Highest Percentage of Population Employed in Installation, Maintenance & Repair in Minnesota?
Wilder has the Highest Percentage of Population Employed in Installation, Maintenance & Repair in Minnesota with 81.8%.
What is the Percentage of Population Employed in Installation, Maintenance & Repair in the State of Minnesota?
Percentage of Population Employed in Installation, Maintenance & Repair in Minnesota is 2.9%.
What is the Percentage of Population Employed in Installation, Maintenance & Repair in the United States?
Percentage of Population Employed in Installation, Maintenance & Repair in the United States is 3.1%.