Cities with the Highest Percentage of Immigrants from Caribbean in California
RELATED REPORTS & OPTIONS
Caribbean
California
Compare Cities
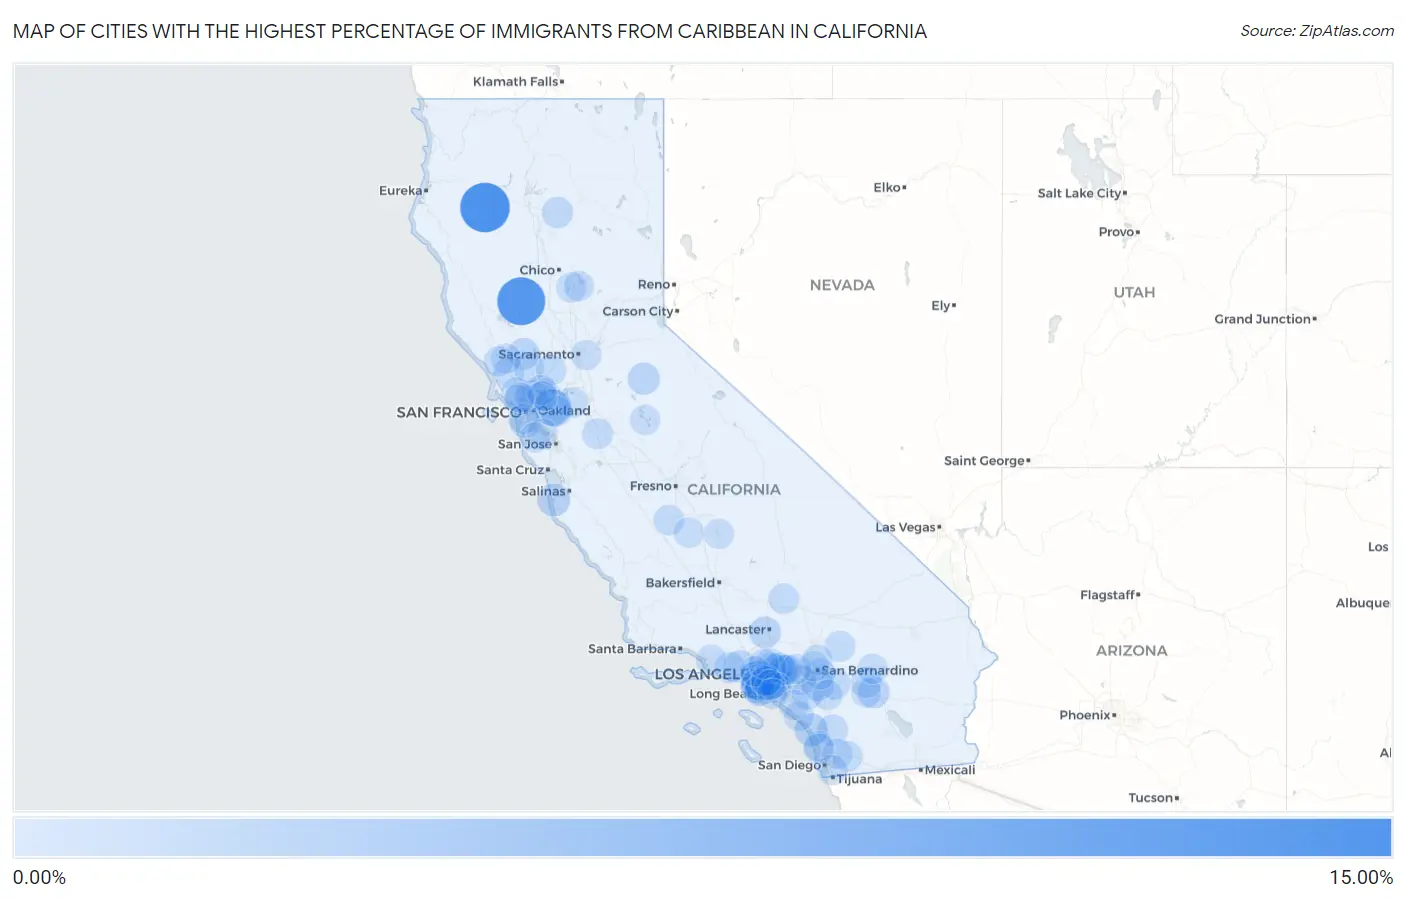
Map of Cities with the Highest Percentage of Immigrants from Caribbean in California
0.00%
15.00%
Cities with the Highest Percentage of Immigrants from Caribbean in California
| City | Caribbean | vs State | vs National | |
| 1. | Hayfork | 13.57% | 0.18%(+13.4)#-1 | 1.37%(+12.2)#0 |
| 2. | Lodoga | 12.44% | 0.18%(+12.3)#0 | 1.37%(+11.1)#1 |
| 3. | Diablo | 4.66% | 0.18%(+4.48)#1 | 1.37%(+3.29)#2 |
| 4. | View Park Windsor Hills | 2.30% | 0.18%(+2.12)#2 | 1.37%(+0.928)#3 |
| 5. | Camp Pendleton South | 2.16% | 0.18%(+1.98)#3 | 1.37%(+0.787)#4 |
| 6. | Carmel By The Sea | 2.07% | 0.18%(+1.89)#4 | 1.37%(+0.696)#5 |
| 7. | Montalvin Manor | 1.96% | 0.18%(+1.78)#5 | 1.37%(+0.587)#6 |
| 8. | Whitmore | 1.84% | 0.18%(+1.66)#6 | 1.37%(+0.466)#7 |
| 9. | Ladera Heights | 1.67% | 0.18%(+1.49)#7 | 1.37%(+0.297)#8 |
| 10. | Arnold | 1.66% | 0.18%(+1.48)#8 | 1.37%(+0.289)#9 |
| 11. | Hidden Hills | 1.66% | 0.18%(+1.48)#32 | 1.37%(+0.289)#234 |
| 12. | Quartz Hill | 1.50% | 0.18%(+1.32)#33 | 1.37%(+0.124)#235 |
| 13. | Desert Palms | 1.45% | 0.18%(+1.27)#34 | 1.37%(+0.078)#236 |
| 14. | Bell | 1.42% | 0.18%(+1.24)#275 | 1.37%(+0.048)#1,799 |
| 15. | Santa Fe Springs | 1.40% | 0.18%(+1.21)#276 | 1.37%(+0.024)#1,800 |
| 16. | Angwin | 1.28% | 0.18%(+1.10)#277 | 1.37%(-0.091)#1,801 |
| 17. | March Arb | 1.28% | 0.18%(+1.10)#278 | 1.37%(-0.096)#1,802 |
| 18. | Benton Park | 1.23% | 0.18%(+1.05)#279 | 1.37%(-0.139)#1,803 |
| 19. | Vine Hill | 1.12% | 0.18%(+0.938)#280 | 1.37%(-0.253)#1,804 |
| 20. | Shingletown | 1.11% | 0.18%(+0.931)#281 | 1.37%(-0.260)#1,805 |
| 21. | Temescal Valley | 1.09% | 0.18%(+0.910)#282 | 1.37%(-0.281)#1,806 |
| 22. | Hawthorne | 1.09% | 0.18%(+0.904)#283 | 1.37%(-0.287)#1,807 |
| 23. | Camino Tassajara | 1.06% | 0.18%(+0.877)#284 | 1.37%(-0.314)#1,808 |
| 24. | Inglewood | 1.00% | 0.18%(+0.823)#285 | 1.37%(-0.369)#1,809 |
| 25. | Valley Center | 0.99% | 0.18%(+0.807)#286 | 1.37%(-0.384)#1,810 |
| 26. | Desert Edge | 0.97% | 0.18%(+0.788)#287 | 1.37%(-0.403)#1,811 |
| 27. | Westlake Village | 0.97% | 0.18%(+0.788)#288 | 1.37%(-0.404)#1,812 |
| 28. | Beaumont | 0.94% | 0.18%(+0.758)#298 | 1.37%(-0.433)#1,931 |
| 29. | Downey | 0.93% | 0.18%(+0.748)#299 | 1.37%(-0.444)#1,932 |
| 30. | Del Aire | 0.87% | 0.18%(+0.693)#300 | 1.37%(-0.499)#1,933 |
| 31. | Loma Linda | 0.81% | 0.18%(+0.631)#301 | 1.37%(-0.561)#1,934 |
| 32. | Patterson | 0.79% | 0.18%(+0.609)#302 | 1.37%(-0.583)#1,935 |
| 33. | East Whittier | 0.75% | 0.18%(+0.570)#303 | 1.37%(-0.621)#1,936 |
| 34. | Lucerne Valley | 0.74% | 0.18%(+0.559)#304 | 1.37%(-0.632)#1,937 |
| 35. | Redondo Beach | 0.72% | 0.18%(+0.538)#305 | 1.37%(-0.653)#1,938 |
| 36. | Cotati | 0.72% | 0.18%(+0.535)#306 | 1.37%(-0.657)#1,939 |
| 37. | Lemoore Station | 0.70% | 0.18%(+0.522)#307 | 1.37%(-0.670)#1,940 |
| 38. | Crestline | 0.70% | 0.18%(+0.515)#308 | 1.37%(-0.676)#1,941 |
| 39. | Camp Pendleton Mainside | 0.68% | 0.18%(+0.496)#309 | 1.37%(-0.695)#1,942 |
| 40. | Yountville | 0.68% | 0.18%(+0.496)#310 | 1.37%(-0.695)#1,943 |
| 41. | California City | 0.64% | 0.18%(+0.459)#311 | 1.37%(-0.733)#1,944 |
| 42. | El Sobrante Cdp Contra Costa County | 0.64% | 0.18%(+0.458)#312 | 1.37%(-0.734)#1,945 |
| 43. | Alpine | 0.63% | 0.18%(+0.454)#313 | 1.37%(-0.738)#1,946 |
| 44. | Charter Oak | 0.62% | 0.18%(+0.440)#314 | 1.37%(-0.751)#1,947 |
| 45. | Vacaville | 0.61% | 0.18%(+0.432)#363 | 1.37%(-0.759)#2,341 |
| 46. | Vincent | 0.61% | 0.18%(+0.428)#364 | 1.37%(-0.763)#2,342 |
| 47. | San Bruno | 0.59% | 0.18%(+0.409)#365 | 1.37%(-0.782)#2,343 |
| 48. | Walnut Park | 0.59% | 0.18%(+0.405)#366 | 1.37%(-0.786)#2,344 |
| 49. | Altadena | 0.58% | 0.18%(+0.399)#367 | 1.37%(-0.792)#2,345 |
| 50. | Mayflower Village | 0.58% | 0.18%(+0.395)#368 | 1.37%(-0.797)#2,346 |
| 51. | Lawndale | 0.56% | 0.18%(+0.380)#369 | 1.37%(-0.811)#2,347 |
| 52. | Gardena | 0.56% | 0.18%(+0.379)#370 | 1.37%(-0.813)#2,348 |
| 53. | El Rio | 0.55% | 0.18%(+0.364)#371 | 1.37%(-0.827)#2,349 |
| 54. | Lomita | 0.54% | 0.18%(+0.361)#372 | 1.37%(-0.830)#2,350 |
| 55. | Larkfield Wikiup | 0.52% | 0.18%(+0.339)#373 | 1.37%(-0.852)#2,351 |
| 56. | East Rancho Dominguez | 0.51% | 0.18%(+0.328)#374 | 1.37%(-0.863)#2,352 |
| 57. | Lucas Valley Marinwood | 0.51% | 0.18%(+0.324)#375 | 1.37%(-0.867)#2,353 |
| 58. | El Sobrante Cdp Riverside County | 0.50% | 0.18%(+0.322)#376 | 1.37%(-0.869)#2,354 |
| 59. | West Carson | 0.50% | 0.18%(+0.318)#377 | 1.37%(-0.873)#2,355 |
| 60. | Corcoran | 0.50% | 0.18%(+0.314)#378 | 1.37%(-0.877)#2,356 |
| 61. | Lake Don Pedro | 0.49% | 0.18%(+0.313)#379 | 1.37%(-0.879)#2,357 |
| 62. | Benicia | 0.48% | 0.18%(+0.303)#380 | 1.37%(-0.888)#2,358 |
| 63. | Solana Beach | 0.48% | 0.18%(+0.298)#381 | 1.37%(-0.894)#2,359 |
| 64. | Norwalk | 0.47% | 0.18%(+0.290)#382 | 1.37%(-0.901)#2,373 |
| 65. | Forestville | 0.47% | 0.18%(+0.287)#383 | 1.37%(-0.904)#2,374 |
| 66. | Eastvale | 0.46% | 0.18%(+0.282)#384 | 1.37%(-0.910)#2,375 |
| 67. | Eucalyptus Hills | 0.46% | 0.18%(+0.281)#385 | 1.37%(-0.910)#2,376 |
| 68. | Cudahy | 0.45% | 0.18%(+0.269)#386 | 1.37%(-0.922)#2,377 |
| 69. | Monrovia | 0.45% | 0.18%(+0.268)#387 | 1.37%(-0.924)#2,378 |
| 70. | Thermalito | 0.44% | 0.18%(+0.261)#388 | 1.37%(-0.931)#2,379 |
| 71. | Muscoy | 0.44% | 0.18%(+0.259)#389 | 1.37%(-0.932)#2,380 |
| 72. | San Dimas | 0.44% | 0.18%(+0.254)#390 | 1.37%(-0.937)#2,381 |
| 73. | Martinez | 0.43% | 0.18%(+0.250)#391 | 1.37%(-0.941)#2,382 |
| 74. | Citrus | 0.43% | 0.18%(+0.247)#392 | 1.37%(-0.944)#2,383 |
| 75. | East Palo Alto | 0.42% | 0.18%(+0.239)#393 | 1.37%(-0.952)#2,384 |
| 76. | Rancho Mirage | 0.42% | 0.18%(+0.236)#394 | 1.37%(-0.955)#2,385 |
| 77. | San Pasqual | 0.41% | 0.18%(+0.233)#395 | 1.37%(-0.959)#2,386 |
| 78. | Upland | 0.41% | 0.18%(+0.232)#396 | 1.37%(-0.959)#2,387 |
| 79. | Porterville | 0.41% | 0.18%(+0.232)#397 | 1.37%(-0.960)#2,388 |
| 80. | Beverly Hills | 0.41% | 0.18%(+0.226)#398 | 1.37%(-0.965)#2,389 |
| 81. | La Riviera | 0.40% | 0.18%(+0.222)#399 | 1.37%(-0.969)#2,390 |
| 82. | Homeland | 0.40% | 0.18%(+0.221)#400 | 1.37%(-0.971)#2,391 |
| 83. | Pepperdine University | 0.40% | 0.18%(+0.220)#401 | 1.37%(-0.971)#2,392 |
| 84. | Buena Park | 0.40% | 0.18%(+0.220)#402 | 1.37%(-0.971)#2,393 |
| 85. | Oroville East | 0.39% | 0.18%(+0.212)#403 | 1.37%(-0.980)#2,394 |
| 86. | Kentfield | 0.39% | 0.18%(+0.210)#404 | 1.37%(-0.981)#2,395 |
| 87. | South Gate | 0.39% | 0.18%(+0.207)#405 | 1.37%(-0.984)#2,396 |
| 88. | Glendale | 0.39% | 0.18%(+0.207)#406 | 1.37%(-0.984)#2,397 |
| 89. | Joshua Tree | 0.39% | 0.18%(+0.204)#407 | 1.37%(-0.987)#2,398 |
| 90. | Discovery Bay | 0.38% | 0.18%(+0.196)#408 | 1.37%(-0.995)#2,399 |
| 91. | Chula Vista | 0.37% | 0.18%(+0.190)#409 | 1.37%(-1.00)#2,400 |
| 92. | Bellflower | 0.36% | 0.18%(+0.183)#410 | 1.37%(-1.01)#2,401 |
| 93. | Colma | 0.36% | 0.18%(+0.182)#411 | 1.37%(-1.01)#2,402 |
| 94. | Seal Beach | 0.36% | 0.18%(+0.182)#412 | 1.37%(-1.01)#2,403 |
| 95. | Woodside | 0.36% | 0.18%(+0.180)#413 | 1.37%(-1.01)#2,404 |
| 96. | San Clemente | 0.36% | 0.18%(+0.180)#414 | 1.37%(-1.01)#2,405 |
| 97. | Laguna Hills | 0.36% | 0.18%(+0.178)#415 | 1.37%(-1.01)#2,406 |
| 98. | Del Mar | 0.35% | 0.18%(+0.173)#416 | 1.37%(-1.02)#2,407 |
| 99. | San Rafael | 0.35% | 0.18%(+0.169)#417 | 1.37%(-1.02)#2,408 |
| 100. | La Canada Flintridge | 0.35% | 0.18%(+0.167)#418 | 1.37%(-1.02)#2,409 |
Common Questions
What are the Top 10 Cities with the Highest Percentage of Immigrants from Caribbean in California?
Top 10 Cities with the Highest Percentage of Immigrants from Caribbean in California are:
#1
13.57%
#2
12.44%
#3
4.66%
#4
2.30%
#5
2.16%
#6
2.07%
#7
1.96%
#8
1.67%
#9
1.66%
#10
1.66%
What city has the Highest Percentage of Immigrants from Caribbean in California?
Hayfork has the Highest Percentage of Immigrants from Caribbean in California with 13.57%.
What is the Percentage of Immigrants from Caribbean in the State of California?
Percentage of Immigrants from Caribbean in California is 0.18%.
What is the Percentage of Immigrants from Caribbean in the United States?
Percentage of Immigrants from Caribbean in the United States is 1.37%.