Cities with the Highest Percentage of Population with a Degree in Communications in California
RELATED REPORTS & OPTIONS
Communications
California
Compare Cities
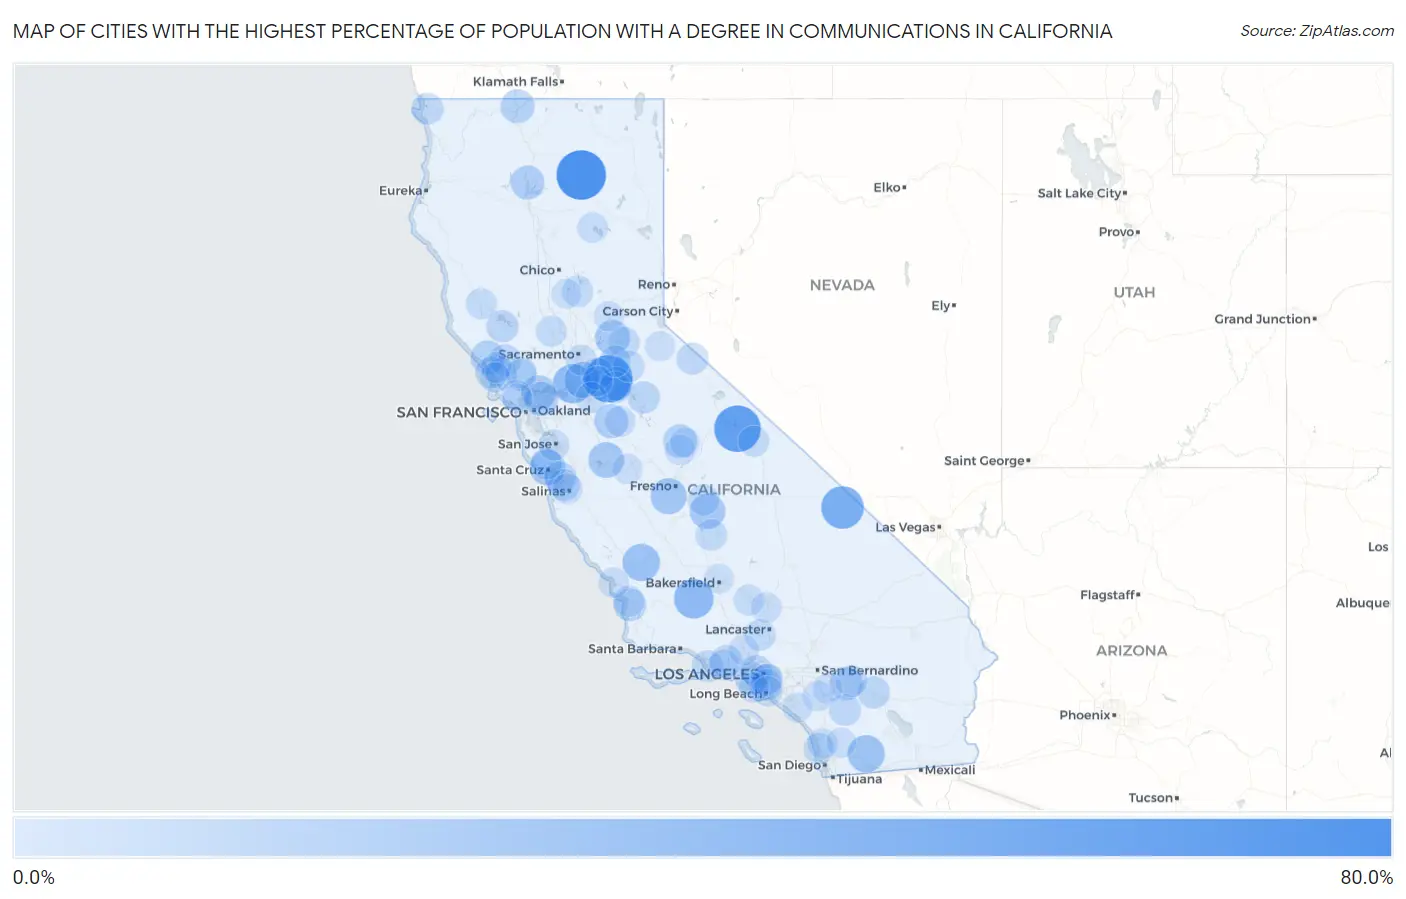
Map of Cities with the Highest Percentage of Population with a Degree in Communications in California
0.0%
80.0%
Cities with the Highest Percentage of Population with a Degree in Communications in California
| City | % Graduates | vs State | vs National | |
| 1. | Fall River Mills | 69.7% | 4.6%(+65.1)#1 | 4.1%(+65.6)#41 |
| 2. | Camanche North Shore | 63.0% | 4.6%(+58.3)#2 | 4.1%(+58.8)#48 |
| 3. | Aspen Springs | 60.0% | 4.6%(+55.4)#3 | 4.1%(+55.9)#52 |
| 4. | Furnace Creek | 47.1% | 4.6%(+42.4)#4 | 4.1%(+42.9)#98 |
| 5. | Taft Heights | 37.1% | 4.6%(+32.5)#5 | 4.1%(+33.0)#153 |
| 6. | Isleton | 36.2% | 4.6%(+31.5)#6 | 4.1%(+32.0)#161 |
| 7. | Shandon | 30.8% | 4.6%(+26.1)#7 | 4.1%(+26.6)#214 |
| 8. | Mount Laguna | 30.0% | 4.6%(+25.4)#8 | 4.1%(+25.9)#234 |
| 9. | Thornton | 26.7% | 4.6%(+22.0)#9 | 4.1%(+22.5)#275 |
| 10. | Raisin City | 26.7% | 4.6%(+22.0)#10 | 4.1%(+22.5)#276 |
| 11. | Santa Nella | 25.8% | 4.6%(+21.2)#11 | 4.1%(+21.7)#297 |
| 12. | Paradise Park | 25.5% | 4.6%(+20.9)#12 | 4.1%(+21.4)#300 |
| 13. | Ivanhoe | 25.0% | 4.6%(+20.4)#13 | 4.1%(+20.9)#303 |
| 14. | Coloma | 23.7% | 4.6%(+19.1)#14 | 4.1%(+19.5)#348 |
| 15. | Port Costa | 21.3% | 4.6%(+16.7)#15 | 4.1%(+17.1)#405 |
| 16. | Alhambra Valley | 20.6% | 4.6%(+16.0)#16 | 4.1%(+16.5)#428 |
| 17. | Empire | 20.3% | 4.6%(+15.7)#17 | 4.1%(+16.2)#439 |
| 18. | Lakehead | 20.3% | 4.6%(+15.6)#18 | 4.1%(+16.1)#446 |
| 19. | Cazadero | 20.0% | 4.6%(+15.4)#19 | 4.1%(+15.9)#455 |
| 20. | Hornbrook | 20.0% | 4.6%(+15.4)#20 | 4.1%(+15.9)#456 |
| 21. | Ahwahnee | 19.5% | 4.6%(+14.9)#21 | 4.1%(+15.4)#485 |
| 22. | Valley Springs | 19.4% | 4.6%(+14.8)#22 | 4.1%(+15.3)#489 |
| 23. | El Centro Naval Air Facility | 18.4% | 4.6%(+13.7)#23 | 4.1%(+14.2)#528 |
| 24. | Cabazon | 18.2% | 4.6%(+13.6)#24 | 4.1%(+14.0)#533 |
| 25. | Petaluma Center | 17.2% | 4.6%(+12.6)#25 | 4.1%(+13.1)#582 |
| 26. | Marina Del Rey | 16.9% | 4.6%(+12.3)#26 | 4.1%(+12.7)#595 |
| 27. | Pepperdine University | 16.4% | 4.6%(+11.8)#27 | 4.1%(+12.3)#640 |
| 28. | Callender | 16.1% | 4.6%(+11.5)#28 | 4.1%(+12.0)#664 |
| 29. | West Hollywood | 15.4% | 4.6%(+10.7)#29 | 4.1%(+11.2)#725 |
| 30. | Desert Palms | 14.9% | 4.6%(+10.3)#30 | 4.1%(+10.8)#760 |
| 31. | Santa Rosa Valley | 14.8% | 4.6%(+10.2)#31 | 4.1%(+10.7)#766 |
| 32. | North Fork | 14.7% | 4.6%(+10.1)#32 | 4.1%(+10.6)#775 |
| 33. | East Sonora | 14.6% | 4.6%(+10.0)#33 | 4.1%(+10.5)#782 |
| 34. | Pajaro Dunes | 14.6% | 4.6%(+9.96)#34 | 4.1%(+10.4)#791 |
| 35. | Kelseyville | 14.5% | 4.6%(+9.91)#35 | 4.1%(+10.4)#795 |
| 36. | Bodega Bay | 14.3% | 4.6%(+9.72)#36 | 4.1%(+10.2)#808 |
| 37. | Castroville | 13.8% | 4.6%(+9.14)#37 | 4.1%(+9.63)#886 |
| 38. | Walker | 13.8% | 4.6%(+9.14)#38 | 4.1%(+9.63)#888 |
| 39. | Channel Islands Beach | 13.7% | 4.6%(+9.11)#39 | 4.1%(+9.60)#890 |
| 40. | Fort Dick | 13.7% | 4.6%(+9.09)#40 | 4.1%(+9.58)#891 |
| 41. | Clay | 13.7% | 4.6%(+9.09)#41 | 4.1%(+9.58)#892 |
| 42. | Williams Canyon | 13.6% | 4.6%(+9.01)#42 | 4.1%(+9.50)#902 |
| 43. | Fulton | 13.6% | 4.6%(+8.98)#43 | 4.1%(+9.47)#905 |
| 44. | Lake Riverside | 13.3% | 4.6%(+8.67)#44 | 4.1%(+9.16)#946 |
| 45. | Cudahy | 13.3% | 4.6%(+8.66)#45 | 4.1%(+9.15)#948 |
| 46. | East Rancho Dominguez | 13.2% | 4.6%(+8.59)#46 | 4.1%(+9.08)#961 |
| 47. | Rancho Calaveras | 13.2% | 4.6%(+8.59)#47 | 4.1%(+9.08)#963 |
| 48. | Camino | 13.1% | 4.6%(+8.47)#48 | 4.1%(+8.96)#975 |
| 49. | Red Corral | 13.0% | 4.6%(+8.39)#49 | 4.1%(+8.88)#980 |
| 50. | Poplar Cotton Center | 12.8% | 4.6%(+8.20)#50 | 4.1%(+8.69)#1,006 |
| 51. | Whitewater | 12.8% | 4.6%(+8.20)#51 | 4.1%(+8.69)#1,007 |
| 52. | Plymouth | 12.7% | 4.6%(+8.11)#52 | 4.1%(+8.60)#1,019 |
| 53. | Leona Valley | 12.5% | 4.6%(+7.85)#53 | 4.1%(+8.34)#1,072 |
| 54. | Palermo | 12.4% | 4.6%(+7.76)#54 | 4.1%(+8.25)#1,081 |
| 55. | Bloomfield | 12.3% | 4.6%(+7.68)#55 | 4.1%(+8.17)#1,091 |
| 56. | Orosi | 12.2% | 4.6%(+7.55)#56 | 4.1%(+8.04)#1,115 |
| 57. | Mount Hermon | 12.1% | 4.6%(+7.52)#57 | 4.1%(+8.01)#1,116 |
| 58. | El Verano | 12.0% | 4.6%(+7.39)#58 | 4.1%(+7.88)#1,127 |
| 59. | Redwood Valley | 11.7% | 4.6%(+7.06)#59 | 4.1%(+7.55)#1,207 |
| 60. | Bishop | 11.6% | 4.6%(+6.98)#60 | 4.1%(+7.48)#1,212 |
| 61. | Oceano | 11.3% | 4.6%(+6.65)#61 | 4.1%(+7.14)#1,268 |
| 62. | Dunnigan | 11.3% | 4.6%(+6.65)#62 | 4.1%(+7.14)#1,269 |
| 63. | Del Mar | 11.2% | 4.6%(+6.56)#63 | 4.1%(+7.05)#1,280 |
| 64. | Burbank | 10.9% | 4.6%(+6.32)#64 | 4.1%(+6.81)#1,344 |
| 65. | Casa Conejo | 10.9% | 4.6%(+6.31)#65 | 4.1%(+6.80)#1,347 |
| 66. | Tehachapi | 10.9% | 4.6%(+6.28)#66 | 4.1%(+6.77)#1,355 |
| 67. | Parkway | 10.9% | 4.6%(+6.28)#67 | 4.1%(+6.77)#1,357 |
| 68. | Bayview Cdp Humboldt County | 10.8% | 4.6%(+6.20)#68 | 4.1%(+6.69)#1,375 |
| 69. | Fetters Hot Springs Agua Caliente | 10.8% | 4.6%(+6.20)#69 | 4.1%(+6.69)#1,376 |
| 70. | August | 10.7% | 4.6%(+6.04)#70 | 4.1%(+6.53)#1,413 |
| 71. | Waterford | 10.7% | 4.6%(+6.03)#71 | 4.1%(+6.52)#1,417 |
| 72. | Chester | 10.3% | 4.6%(+5.65)#72 | 4.1%(+6.14)#1,505 |
| 73. | Occidental | 10.2% | 4.6%(+5.61)#73 | 4.1%(+6.10)#1,520 |
| 74. | Mojave | 9.9% | 4.6%(+5.30)#74 | 4.1%(+5.79)#1,610 |
| 75. | Morro Bay | 9.9% | 4.6%(+5.22)#75 | 4.1%(+5.72)#1,636 |
| 76. | Rancho Santa Fe | 9.8% | 4.6%(+5.13)#76 | 4.1%(+5.62)#1,656 |
| 77. | Boronda | 9.7% | 4.6%(+5.09)#77 | 4.1%(+5.58)#1,663 |
| 78. | Dillon Beach | 9.7% | 4.6%(+5.09)#78 | 4.1%(+5.58)#1,667 |
| 79. | Bell | 9.7% | 4.6%(+5.08)#79 | 4.1%(+5.57)#1,672 |
| 80. | Coarsegold | 9.5% | 4.6%(+4.92)#80 | 4.1%(+5.41)#1,725 |
| 81. | Dogtown | 9.5% | 4.6%(+4.86)#81 | 4.1%(+5.35)#1,752 |
| 82. | Stevenson Ranch | 9.5% | 4.6%(+4.85)#82 | 4.1%(+5.34)#1,758 |
| 83. | Signal Hill | 9.5% | 4.6%(+4.85)#83 | 4.1%(+5.34)#1,759 |
| 84. | Madera Ranchos | 9.5% | 4.6%(+4.83)#84 | 4.1%(+5.32)#1,761 |
| 85. | San Miguel Cdp Contra Costa County | 9.4% | 4.6%(+4.82)#85 | 4.1%(+5.31)#1,766 |
| 86. | Meadowbrook | 9.3% | 4.6%(+4.70)#86 | 4.1%(+5.19)#1,799 |
| 87. | Sleepy Hollow | 9.3% | 4.6%(+4.64)#87 | 4.1%(+5.13)#1,821 |
| 88. | Hermosa Beach | 9.1% | 4.6%(+4.48)#88 | 4.1%(+4.97)#1,857 |
| 89. | Oak Run | 9.1% | 4.6%(+4.47)#89 | 4.1%(+4.96)#1,873 |
| 90. | Oakhurst | 9.0% | 4.6%(+4.34)#90 | 4.1%(+4.83)#1,932 |
| 91. | Dos Palos | 8.9% | 4.6%(+4.31)#91 | 4.1%(+4.80)#1,941 |
| 92. | Lakeview | 8.8% | 4.6%(+4.22)#92 | 4.1%(+4.71)#1,972 |
| 93. | Colfax | 8.8% | 4.6%(+4.20)#93 | 4.1%(+4.69)#1,980 |
| 94. | Sonoma State University | 8.8% | 4.6%(+4.20)#94 | 4.1%(+4.69)#1,981 |
| 95. | Oildale | 8.8% | 4.6%(+4.18)#95 | 4.1%(+4.67)#1,992 |
| 96. | Kirkwood | 8.7% | 4.6%(+4.10)#96 | 4.1%(+4.60)#2,019 |
| 97. | Ladera Ranch | 8.7% | 4.6%(+4.10)#97 | 4.1%(+4.59)#2,021 |
| 98. | Ramona | 8.7% | 4.6%(+4.08)#98 | 4.1%(+4.57)#2,026 |
| 99. | Ross | 8.6% | 4.6%(+4.02)#99 | 4.1%(+4.51)#2,062 |
| 100. | Biggs | 8.5% | 4.6%(+3.90)#100 | 4.1%(+4.39)#2,111 |
Common Questions
What are the Top 10 Cities with the Highest Percentage of Population with a Degree in Communications in California?
Top 10 Cities with the Highest Percentage of Population with a Degree in Communications in California are:
#1
69.7%
#2
63.0%
#3
60.0%
#4
47.1%
#5
37.1%
#6
36.2%
#7
30.8%
#8
30.0%
#9
26.7%
#10
26.7%
What city has the Highest Percentage of Population with a Degree in Communications in California?
Fall River Mills has the Highest Percentage of Population with a Degree in Communications in California with 69.7%.
What is the Percentage of Population with a Degree in Communications in the State of California?
Percentage of Population with a Degree in Communications in California is 4.6%.
What is the Percentage of Population with a Degree in Communications in the United States?
Percentage of Population with a Degree in Communications in the United States is 4.1%.