Cities with the Most Immigrants from Uganda in California
RELATED REPORTS & OPTIONS
Uganda
California
Compare Cities
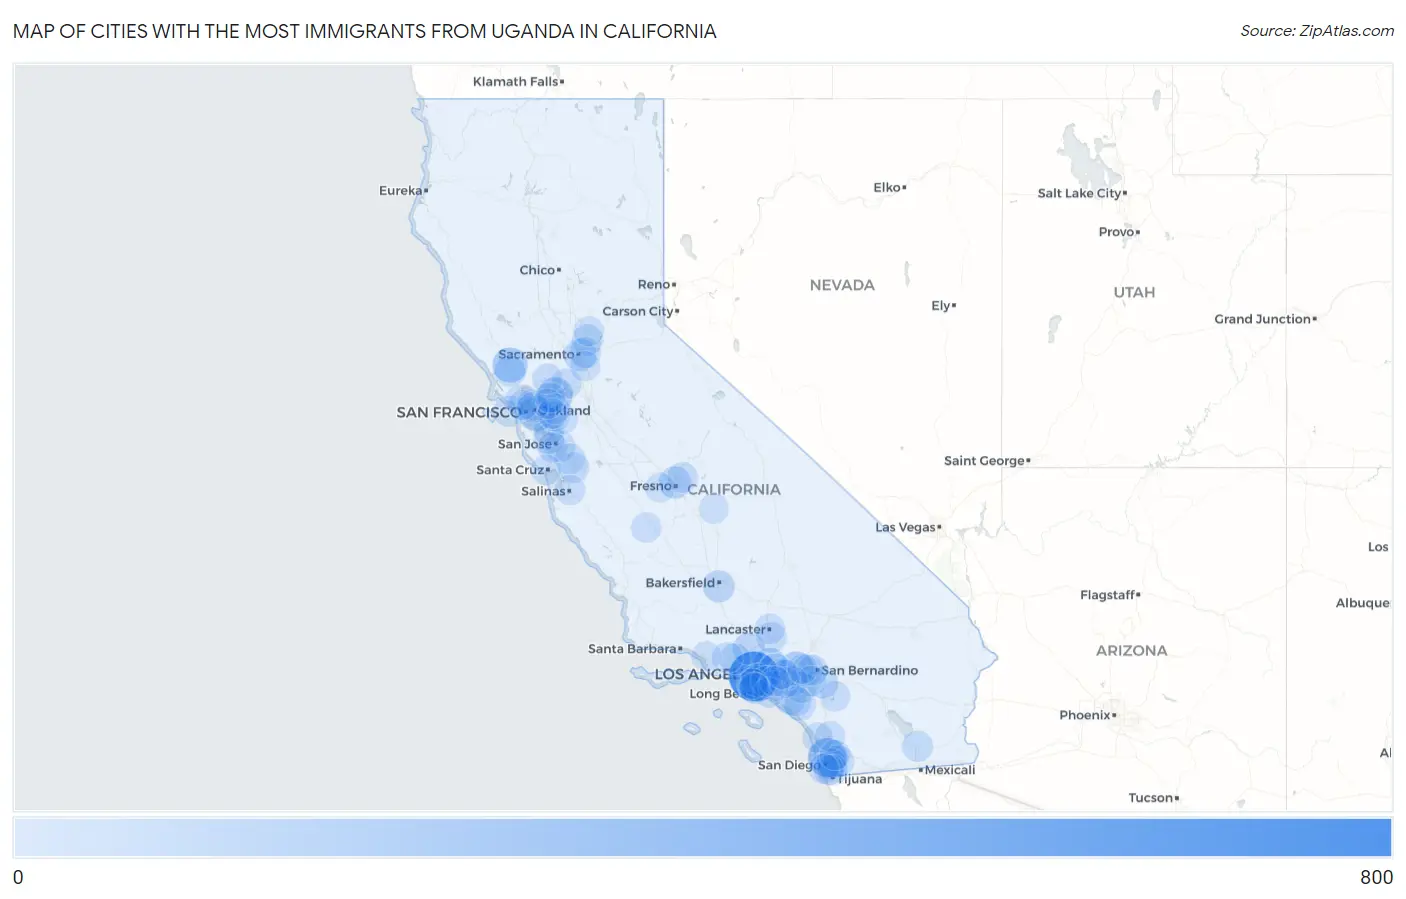
Map of Cities with the Most Immigrants from Uganda in California
0
800
Cities with the Most Immigrants from Uganda in California
| City | Uganda | vs State | vs National | |
| 1. | Los Angeles | 800 | 4,329(18.48%)#1 | 36,662(2.18%)#2 |
| 2. | San Diego | 355 | 4,329(8.20%)#2 | 36,662(0.97%)#6 |
| 3. | Hawthorne | 221 | 4,329(5.11%)#3 | 36,662(0.60%)#17 |
| 4. | Pittsburg | 207 | 4,329(4.78%)#4 | 36,662(0.56%)#19 |
| 5. | Oakland | 198 | 4,329(4.57%)#5 | 36,662(0.54%)#20 |
| 6. | Santa Rosa | 197 | 4,329(4.55%)#6 | 36,662(0.54%)#22 |
| 7. | Upland | 172 | 4,329(3.97%)#7 | 36,662(0.47%)#30 |
| 8. | Pasadena | 152 | 4,329(3.51%)#8 | 36,662(0.41%)#40 |
| 9. | Inglewood | 127 | 4,329(2.93%)#9 | 36,662(0.35%)#51 |
| 10. | Sacramento | 90 | 4,329(2.08%)#10 | 36,662(0.25%)#87 |
| 11. | Santa Clarita | 85 | 4,329(1.96%)#11 | 36,662(0.23%)#93 |
| 12. | Fresno | 82 | 4,329(1.89%)#12 | 36,662(0.22%)#101 |
| 13. | Bakersfield | 80 | 4,329(1.85%)#13 | 36,662(0.22%)#104 |
| 14. | Moreno Valley | 60 | 4,329(1.39%)#14 | 36,662(0.16%)#138 |
| 15. | Irvine | 58 | 4,329(1.34%)#15 | 36,662(0.16%)#143 |
| 16. | Rohnert Park | 50 | 4,329(1.16%)#16 | 36,662(0.14%)#170 |
| 17. | La Mesa | 46 | 4,329(1.06%)#17 | 36,662(0.13%)#179 |
| 18. | La Canada Flintridge | 46 | 4,329(1.06%)#18 | 36,662(0.13%)#180 |
| 19. | Coto De Caza | 46 | 4,329(1.06%)#19 | 36,662(0.13%)#181 |
| 20. | Brawley | 42 | 4,329(0.97%)#20 | 36,662(0.11%)#196 |
| 21. | Roseville | 40 | 4,329(0.92%)#21 | 36,662(0.11%)#202 |
| 22. | Arden Arcade | 40 | 4,329(0.92%)#22 | 36,662(0.11%)#203 |
| 23. | San Jose | 39 | 4,329(0.90%)#23 | 36,662(0.11%)#205 |
| 24. | Simi Valley | 39 | 4,329(0.90%)#24 | 36,662(0.11%)#207 |
| 25. | Rancho San Diego | 39 | 4,329(0.90%)#25 | 36,662(0.11%)#209 |
| 26. | San Francisco | 37 | 4,329(0.85%)#26 | 36,662(0.10%)#214 |
| 27. | Corona | 37 | 4,329(0.85%)#27 | 36,662(0.10%)#216 |
| 28. | Berkeley | 36 | 4,329(0.83%)#28 | 36,662(0.10%)#218 |
| 29. | Fontana | 35 | 4,329(0.81%)#29 | 36,662(0.10%)#224 |
| 30. | Clovis | 33 | 4,329(0.76%)#30 | 36,662(0.09%)#236 |
| 31. | Arcadia | 33 | 4,329(0.76%)#31 | 36,662(0.09%)#238 |
| 32. | Morgan Hill | 31 | 4,329(0.72%)#32 | 36,662(0.08%)#255 |
| 33. | Torrance | 30 | 4,329(0.69%)#33 | 36,662(0.08%)#260 |
| 34. | Moorpark | 30 | 4,329(0.69%)#34 | 36,662(0.08%)#262 |
| 35. | Sunnyvale | 27 | 4,329(0.62%)#35 | 36,662(0.07%)#280 |
| 36. | Lemon Grove | 26 | 4,329(0.60%)#36 | 36,662(0.07%)#291 |
| 37. | Rialto | 24 | 4,329(0.55%)#37 | 36,662(0.07%)#302 |
| 38. | Rio Vista | 23 | 4,329(0.53%)#38 | 36,662(0.06%)#313 |
| 39. | Gilroy | 22 | 4,329(0.51%)#39 | 36,662(0.06%)#318 |
| 40. | Riverside | 21 | 4,329(0.49%)#40 | 36,662(0.06%)#325 |
| 41. | Chula Vista | 21 | 4,329(0.49%)#41 | 36,662(0.06%)#326 |
| 42. | Palmdale | 21 | 4,329(0.49%)#42 | 36,662(0.06%)#327 |
| 43. | Chino Hills | 20 | 4,329(0.46%)#43 | 36,662(0.05%)#339 |
| 44. | Cerritos | 19 | 4,329(0.44%)#44 | 36,662(0.05%)#354 |
| 45. | Fremont | 18 | 4,329(0.42%)#45 | 36,662(0.05%)#359 |
| 46. | Hemet | 18 | 4,329(0.42%)#46 | 36,662(0.05%)#360 |
| 47. | Fairfield | 17 | 4,329(0.39%)#47 | 36,662(0.05%)#366 |
| 48. | Livermore | 17 | 4,329(0.39%)#48 | 36,662(0.05%)#367 |
| 49. | South Gate | 16 | 4,329(0.37%)#49 | 36,662(0.04%)#377 |
| 50. | Santa Cruz | 15 | 4,329(0.35%)#50 | 36,662(0.04%)#392 |
| 51. | Campbell | 15 | 4,329(0.35%)#51 | 36,662(0.04%)#393 |
| 52. | Strawberry Cdp Marin County | 15 | 4,329(0.35%)#52 | 36,662(0.04%)#402 |
| 53. | Carlsbad | 14 | 4,329(0.32%)#53 | 36,662(0.04%)#407 |
| 54. | Dublin | 14 | 4,329(0.32%)#54 | 36,662(0.04%)#409 |
| 55. | Brea | 14 | 4,329(0.32%)#55 | 36,662(0.04%)#410 |
| 56. | Walnut | 13 | 4,329(0.30%)#56 | 36,662(0.04%)#420 |
| 57. | Blackhawk | 13 | 4,329(0.30%)#57 | 36,662(0.04%)#427 |
| 58. | Long Beach | 12 | 4,329(0.28%)#58 | 36,662(0.03%)#430 |
| 59. | Escondido | 11 | 4,329(0.25%)#59 | 36,662(0.03%)#445 |
| 60. | West Covina | 11 | 4,329(0.25%)#60 | 36,662(0.03%)#446 |
| 61. | Larkspur | 11 | 4,329(0.25%)#61 | 36,662(0.03%)#457 |
| 62. | Emeryville | 11 | 4,329(0.25%)#62 | 36,662(0.03%)#458 |
| 63. | Lancaster | 10 | 4,329(0.23%)#63 | 36,662(0.03%)#462 |
| 64. | Salinas | 10 | 4,329(0.23%)#64 | 36,662(0.03%)#463 |
| 65. | South Whittier | 10 | 4,329(0.23%)#65 | 36,662(0.03%)#468 |
| 66. | National City | 10 | 4,329(0.23%)#66 | 36,662(0.03%)#469 |
| 67. | Coalinga | 10 | 4,329(0.23%)#67 | 36,662(0.03%)#474 |
| 68. | San Ramon | 7 | 4,329(0.16%)#68 | 36,662(0.02%)#519 |
| 69. | Santee | 7 | 4,329(0.16%)#69 | 36,662(0.02%)#523 |
| 70. | El Segundo | 7 | 4,329(0.16%)#70 | 36,662(0.02%)#528 |
| 71. | Elk Grove | 6 | 4,329(0.14%)#71 | 36,662(0.02%)#534 |
| 72. | San Buenaventura Ventura | 6 | 4,329(0.14%)#72 | 36,662(0.02%)#535 |
| 73. | Lake Forest | 6 | 4,329(0.14%)#73 | 36,662(0.02%)#537 |
| 74. | Coronado | 6 | 4,329(0.14%)#74 | 36,662(0.02%)#545 |
| 75. | Walnut Creek | 5 | 4,329(0.12%)#75 | 36,662(0.01%)#567 |
| 76. | Hermosa Beach | 5 | 4,329(0.12%)#76 | 36,662(0.01%)#573 |
| 77. | El Sobrante Cdp Contra Costa County | 5 | 4,329(0.12%)#77 | 36,662(0.01%)#574 |
| 78. | Woodlake | 5 | 4,329(0.12%)#78 | 36,662(0.01%)#576 |
| 79. | Belvedere | 5 | 4,329(0.12%)#79 | 36,662(0.01%)#581 |
| 80. | Lincoln | 4 | 4,329(0.09%)#80 | 36,662(0.01%)#592 |
| 81. | Rancho Cucamonga | 3 | 4,329(0.07%)#81 | 36,662(0.01%)#607 |
| 82. | Concord | 2 | 4,329(0.05%)#82 | 36,662(0.01%)#619 |
| 83. | Kerman | 1 | 4,329(0.02%)#83 | 36,662(0.00%)#652 |
Common Questions
What are the Top 10 Cities with the Most Immigrants from Uganda in California?
Top 10 Cities with the Most Immigrants from Uganda in California are:
#1
800
#2
355
#3
221
#4
207
#5
198
#6
197
#7
172
#8
152
#9
127
#10
90
What city has the Most Immigrants from Uganda in California?
Los Angeles has the Most Immigrants from Uganda in California with 800.
What is the Total Immigrants from Uganda in the State of California?
Total Immigrants from Uganda in California is 4,329.
What is the Total Immigrants from Uganda in the United States?
Total Immigrants from Uganda in the United States is 36,662.