Cities with the Most Immigrants from Chile in California
RELATED REPORTS & OPTIONS
Chile
California
Compare Cities
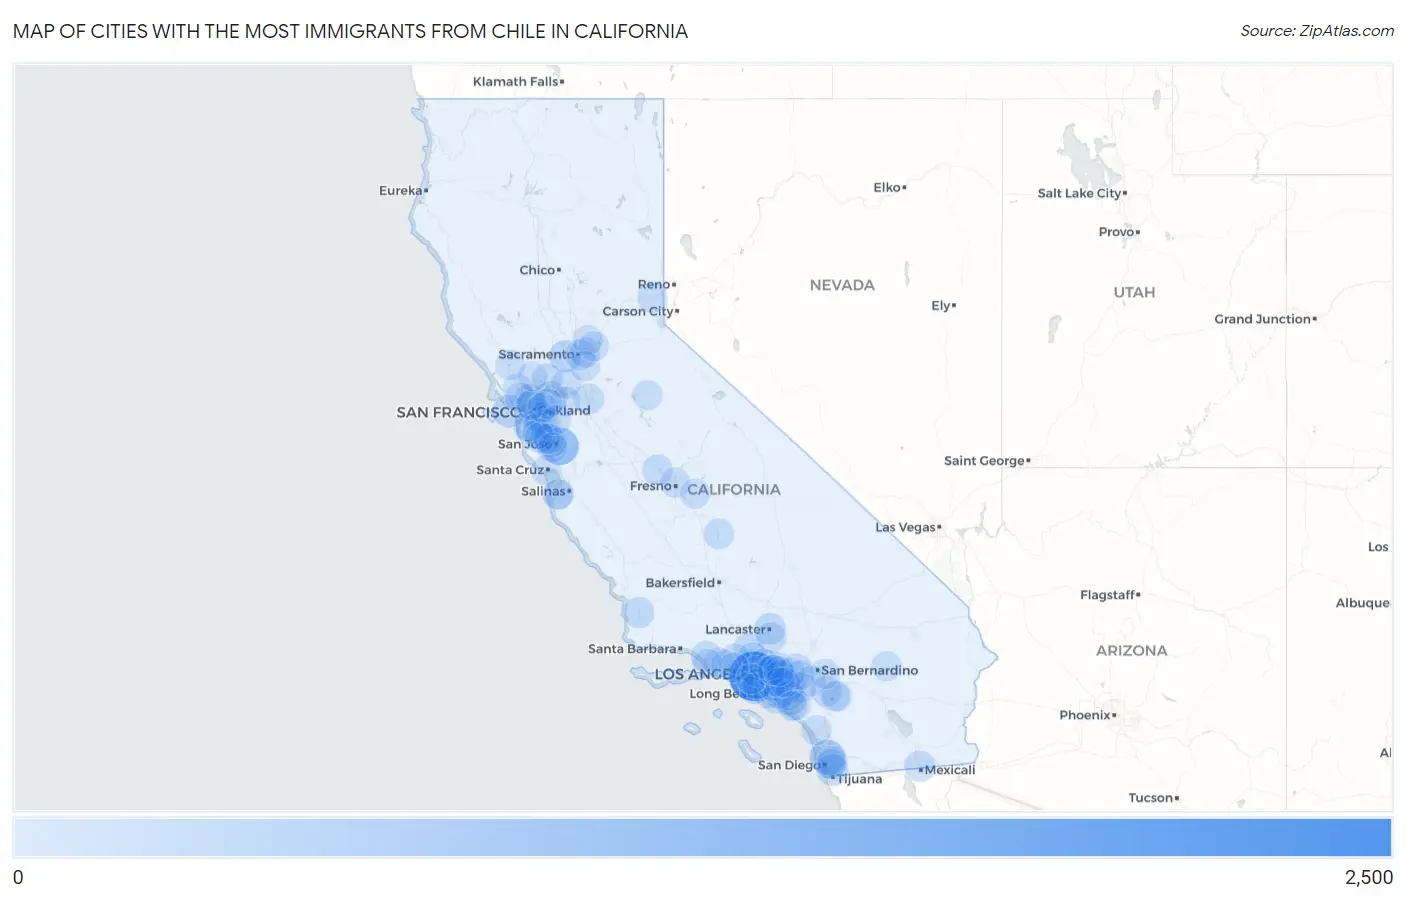
Map of Cities with the Most Immigrants from Chile in California
0
2,500
Cities with the Most Immigrants from Chile in California
| City | Chile | vs State | vs National | |
| 1. | Los Angeles | 2,372 | 15,357(15.45%)#1 | 106,565(2.23%)#2 |
| 2. | San Jose | 905 | 15,357(5.89%)#2 | 106,565(0.85%)#4 |
| 3. | San Diego | 662 | 15,357(4.31%)#3 | 106,565(0.62%)#9 |
| 4. | Irvine | 361 | 15,357(2.35%)#4 | 106,565(0.34%)#29 |
| 5. | Concord | 320 | 15,357(2.08%)#5 | 106,565(0.30%)#34 |
| 6. | San Francisco | 310 | 15,357(2.02%)#6 | 106,565(0.29%)#36 |
| 7. | Oakland | 309 | 15,357(2.01%)#7 | 106,565(0.29%)#37 |
| 8. | Anaheim | 258 | 15,357(1.68%)#8 | 106,565(0.24%)#51 |
| 9. | Chula Vista | 244 | 15,357(1.59%)#9 | 106,565(0.23%)#57 |
| 10. | Davis | 237 | 15,357(1.54%)#10 | 106,565(0.22%)#61 |
| 11. | Santa Clara | 235 | 15,357(1.53%)#11 | 106,565(0.22%)#62 |
| 12. | Long Beach | 215 | 15,357(1.40%)#12 | 106,565(0.20%)#72 |
| 13. | Lancaster | 186 | 15,357(1.21%)#13 | 106,565(0.17%)#92 |
| 14. | Santa Clarita | 177 | 15,357(1.15%)#14 | 106,565(0.17%)#97 |
| 15. | Santa Maria | 166 | 15,357(1.08%)#15 | 106,565(0.16%)#103 |
| 16. | Calexico | 163 | 15,357(1.06%)#16 | 106,565(0.15%)#107 |
| 17. | Berkeley | 159 | 15,357(1.04%)#17 | 106,565(0.15%)#110 |
| 18. | San Mateo | 148 | 15,357(0.96%)#18 | 106,565(0.14%)#121 |
| 19. | San Leandro | 135 | 15,357(0.88%)#19 | 106,565(0.13%)#133 |
| 20. | Madera | 134 | 15,357(0.87%)#20 | 106,565(0.13%)#134 |
| 21. | Downey | 109 | 15,357(0.71%)#21 | 106,565(0.10%)#179 |
| 22. | Upland | 107 | 15,357(0.70%)#22 | 106,565(0.10%)#183 |
| 23. | Torrance | 105 | 15,357(0.68%)#23 | 106,565(0.10%)#187 |
| 24. | San Buenaventura Ventura | 101 | 15,357(0.66%)#24 | 106,565(0.09%)#197 |
| 25. | Porterville | 101 | 15,357(0.66%)#25 | 106,565(0.09%)#198 |
| 26. | West Hollywood | 101 | 15,357(0.66%)#26 | 106,565(0.09%)#199 |
| 27. | Fairfield | 100 | 15,357(0.65%)#27 | 106,565(0.09%)#201 |
| 28. | Stockton | 96 | 15,357(0.63%)#28 | 106,565(0.09%)#212 |
| 29. | Simi Valley | 94 | 15,357(0.61%)#29 | 106,565(0.09%)#215 |
| 30. | Burlingame | 93 | 15,357(0.61%)#30 | 106,565(0.09%)#219 |
| 31. | Truckee | 88 | 15,357(0.57%)#31 | 106,565(0.08%)#236 |
| 32. | Nuevo | 87 | 15,357(0.57%)#32 | 106,565(0.08%)#239 |
| 33. | Sacramento | 83 | 15,357(0.54%)#33 | 106,565(0.08%)#247 |
| 34. | Huntington Beach | 82 | 15,357(0.53%)#34 | 106,565(0.08%)#253 |
| 35. | Hacienda Heights | 81 | 15,357(0.53%)#35 | 106,565(0.08%)#257 |
| 36. | Cerritos | 81 | 15,357(0.53%)#36 | 106,565(0.08%)#258 |
| 37. | Palmdale | 78 | 15,357(0.51%)#37 | 106,565(0.07%)#269 |
| 38. | Monrovia | 70 | 15,357(0.46%)#38 | 106,565(0.07%)#307 |
| 39. | Yorba Linda | 69 | 15,357(0.45%)#39 | 106,565(0.06%)#308 |
| 40. | Hayward | 68 | 15,357(0.44%)#40 | 106,565(0.06%)#315 |
| 41. | Oceanside | 65 | 15,357(0.42%)#41 | 106,565(0.06%)#329 |
| 42. | Richmond | 65 | 15,357(0.42%)#42 | 106,565(0.06%)#330 |
| 43. | South Whittier | 65 | 15,357(0.42%)#43 | 106,565(0.06%)#332 |
| 44. | San Fernando | 65 | 15,357(0.42%)#44 | 106,565(0.06%)#334 |
| 45. | Alhambra | 64 | 15,357(0.42%)#45 | 106,565(0.06%)#338 |
| 46. | Foster City | 62 | 15,357(0.40%)#46 | 106,565(0.06%)#347 |
| 47. | Seaside | 62 | 15,357(0.40%)#47 | 106,565(0.06%)#348 |
| 48. | Pasadena | 60 | 15,357(0.39%)#48 | 106,565(0.06%)#356 |
| 49. | West Covina | 60 | 15,357(0.39%)#49 | 106,565(0.06%)#358 |
| 50. | Hawthorne | 58 | 15,357(0.38%)#50 | 106,565(0.05%)#369 |
| 51. | Mountain View | 58 | 15,357(0.38%)#51 | 106,565(0.05%)#370 |
| 52. | East Hemet | 57 | 15,357(0.37%)#52 | 106,565(0.05%)#376 |
| 53. | Sunnyvale | 56 | 15,357(0.36%)#53 | 106,565(0.05%)#379 |
| 54. | La Puente | 56 | 15,357(0.36%)#54 | 106,565(0.05%)#382 |
| 55. | La Mesa | 55 | 15,357(0.36%)#55 | 106,565(0.05%)#390 |
| 56. | Novato | 55 | 15,357(0.36%)#56 | 106,565(0.05%)#391 |
| 57. | North Fair Oaks | 55 | 15,357(0.36%)#57 | 106,565(0.05%)#393 |
| 58. | Stanford | 54 | 15,357(0.35%)#58 | 106,565(0.05%)#396 |
| 59. | Riverside | 52 | 15,357(0.34%)#59 | 106,565(0.05%)#409 |
| 60. | Thousand Oaks | 52 | 15,357(0.34%)#60 | 106,565(0.05%)#410 |
| 61. | Corona | 51 | 15,357(0.33%)#61 | 106,565(0.05%)#415 |
| 62. | Temple City | 51 | 15,357(0.33%)#62 | 106,565(0.05%)#419 |
| 63. | Mono Vista | 51 | 15,357(0.33%)#63 | 106,565(0.05%)#421 |
| 64. | Glendale | 50 | 15,357(0.33%)#64 | 106,565(0.05%)#422 |
| 65. | Pomona | 49 | 15,357(0.32%)#65 | 106,565(0.05%)#431 |
| 66. | Lemon Grove | 47 | 15,357(0.31%)#66 | 106,565(0.04%)#452 |
| 67. | Albany | 47 | 15,357(0.31%)#67 | 106,565(0.04%)#453 |
| 68. | San Rafael | 46 | 15,357(0.30%)#68 | 106,565(0.04%)#459 |
| 69. | East San Gabriel | 46 | 15,357(0.30%)#69 | 106,565(0.04%)#463 |
| 70. | Fresno | 45 | 15,357(0.29%)#70 | 106,565(0.04%)#466 |
| 71. | Tustin | 45 | 15,357(0.29%)#71 | 106,565(0.04%)#467 |
| 72. | Santa Cruz | 45 | 15,357(0.29%)#72 | 106,565(0.04%)#468 |
| 73. | Campbell | 44 | 15,357(0.29%)#73 | 106,565(0.04%)#476 |
| 74. | Arden Arcade | 43 | 15,357(0.28%)#74 | 106,565(0.04%)#488 |
| 75. | Camarillo | 43 | 15,357(0.28%)#75 | 106,565(0.04%)#490 |
| 76. | Monterey | 43 | 15,357(0.28%)#76 | 106,565(0.04%)#492 |
| 77. | Agoura Hills | 43 | 15,357(0.28%)#77 | 106,565(0.04%)#493 |
| 78. | Roseville | 42 | 15,357(0.27%)#78 | 106,565(0.04%)#505 |
| 79. | Hemet | 42 | 15,357(0.27%)#79 | 106,565(0.04%)#507 |
| 80. | Rio Vista | 42 | 15,357(0.27%)#80 | 106,565(0.04%)#513 |
| 81. | Elk Grove | 41 | 15,357(0.27%)#81 | 106,565(0.04%)#516 |
| 82. | Garden Grove | 41 | 15,357(0.27%)#82 | 106,565(0.04%)#517 |
| 83. | Redlands | 41 | 15,357(0.27%)#83 | 106,565(0.04%)#519 |
| 84. | Marina Del Rey | 41 | 15,357(0.27%)#84 | 106,565(0.04%)#529 |
| 85. | Mission Viejo | 40 | 15,357(0.26%)#85 | 106,565(0.04%)#533 |
| 86. | Brentwood | 40 | 15,357(0.26%)#86 | 106,565(0.04%)#534 |
| 87. | Brea | 39 | 15,357(0.25%)#87 | 106,565(0.04%)#541 |
| 88. | Orangevale | 39 | 15,357(0.25%)#88 | 106,565(0.04%)#542 |
| 89. | Reedley | 39 | 15,357(0.25%)#89 | 106,565(0.04%)#545 |
| 90. | Twentynine Palms | 38 | 15,357(0.25%)#90 | 106,565(0.04%)#548 |
| 91. | Santa Rosa | 37 | 15,357(0.24%)#91 | 106,565(0.03%)#555 |
| 92. | Ontario | 36 | 15,357(0.23%)#92 | 106,565(0.03%)#565 |
| 93. | Aliso Viejo | 36 | 15,357(0.23%)#93 | 106,565(0.03%)#571 |
| 94. | Oxnard | 35 | 15,357(0.23%)#94 | 106,565(0.03%)#581 |
| 95. | Napa | 35 | 15,357(0.23%)#95 | 106,565(0.03%)#583 |
| 96. | Walnut Creek | 35 | 15,357(0.23%)#96 | 106,565(0.03%)#584 |
| 97. | La Habra | 35 | 15,357(0.23%)#97 | 106,565(0.03%)#585 |
| 98. | Moraga | 35 | 15,357(0.23%)#98 | 106,565(0.03%)#594 |
| 99. | Pleasanton | 34 | 15,357(0.22%)#99 | 106,565(0.03%)#599 |
| 100. | Baldwin Park | 34 | 15,357(0.22%)#100 | 106,565(0.03%)#600 |
Common Questions
What are the Top 10 Cities with the Most Immigrants from Chile in California?
Top 10 Cities with the Most Immigrants from Chile in California are:
#1
2,372
#2
905
#3
662
#4
361
#5
320
#6
310
#7
309
#8
258
#9
244
#10
237
What city has the Most Immigrants from Chile in California?
Los Angeles has the Most Immigrants from Chile in California with 2,372.
What is the Total Immigrants from Chile in the State of California?
Total Immigrants from Chile in California is 15,357.
What is the Total Immigrants from Chile in the United States?
Total Immigrants from Chile in the United States is 106,565.