9th Grade by Race, Ethnicity and Immigration Origin
SELECT DEMOGRAPHIC
Select Demographic
9th Grade
Common Questions
What are the top races in the United States with the highest percentage of population with at least 9th grade education?
The top races in the United States with the highest percentage of population with at least 9th grade education are:
#1
Whites/Caucasians
95.8%
(99.4/100)
#2
Hawaiians
94.7%
(22.7/100)
#3
Blacks/African Americans
94.6%
(20.5/100)
What are the top ancestries in the United States with the highest percentage of population with at least 9th grade education?
The top ancestries in the United States with the highest percentage of population with at least 9th grade education are:
#1
Tsimshian
97.0%
(100.0/100)
#2
Norwegians
96.9%
(100.0/100)
#3
Slovaks
96.9%
(100.0/100)
#4
Slovenes
96.7%
(100.0/100)
#5
Swedes
96.7%
(100.0/100)
What are the top immigration origins in the United States with the highest percentage of population with at least 9th grade education?
The top immigration origins in the United States with the highest percentage of population with at least 9th grade education are:
#1
Immigrants from Scotland
96.1%
(99.9/100)
#2
Immigrants from India
96.1%
(99.9/100)
#3
Immigrants from Northern Europe
96.0%
(99.9/100)
#4
Immigrants from Canada
96.0%
(99.8/100)
#5
Immigrants from Austria
96.0%
(99.8/100)
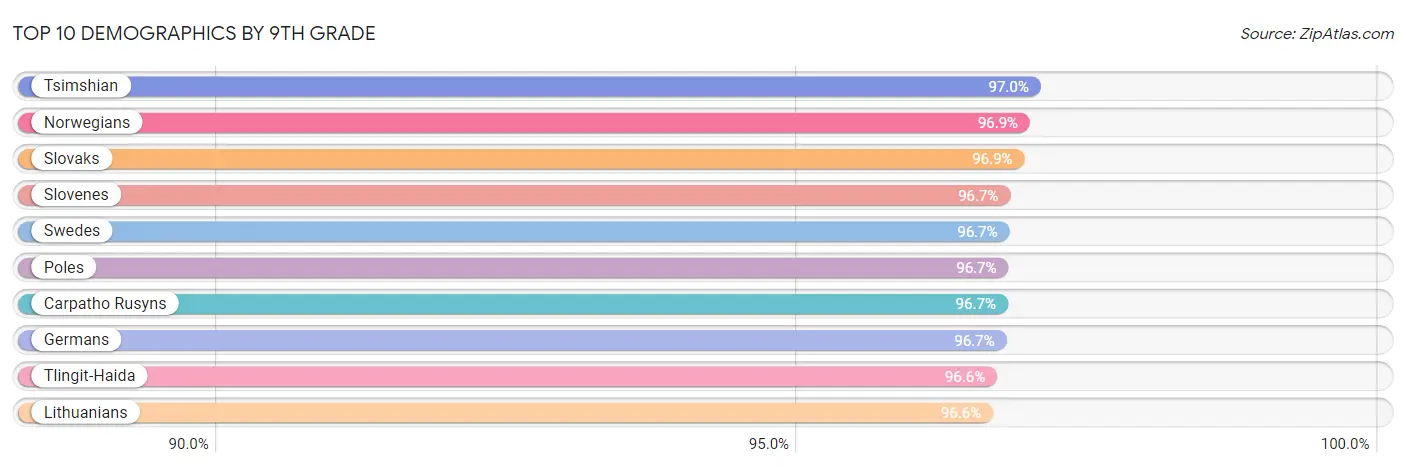
Top 10 Demographics by 9th Grade
The best off demographics with the highest percentage of population with at least 9th grade education in the United States are Tsimshian (97.0%, 100.0/100), Norwegian (96.9%, 100.0/100), Slovak (96.9%, 100.0/100), Slovene (96.7%, 100.0/100), and Swedish (96.7%, 100.0/100).
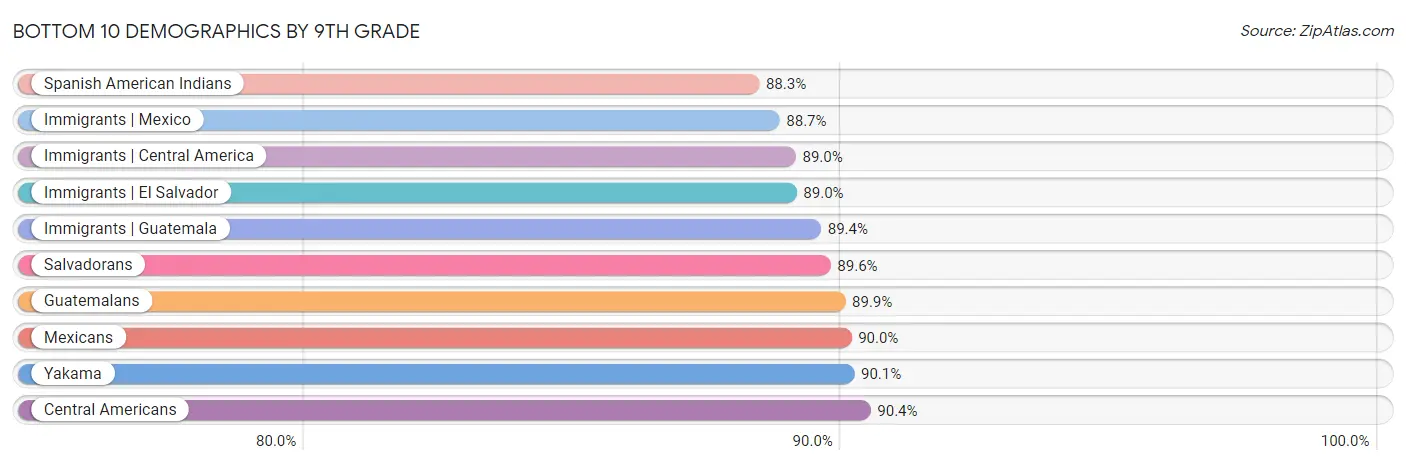
Bottom 10 Demographics by 9th Grade
The worst off demographics with the lowest percentage of population with at least 9th grade education in the United States are Spanish American Indian (88.3%, 0.0/100), Immigrants from Mexico (88.7%, 0.0/100), Immigrants from Central America (89.0%, 0.0/100), Immigrants from El Salvador (89.0%, 0.0/100), and Immigrants from Guatemala (89.4%, 0.0/100).
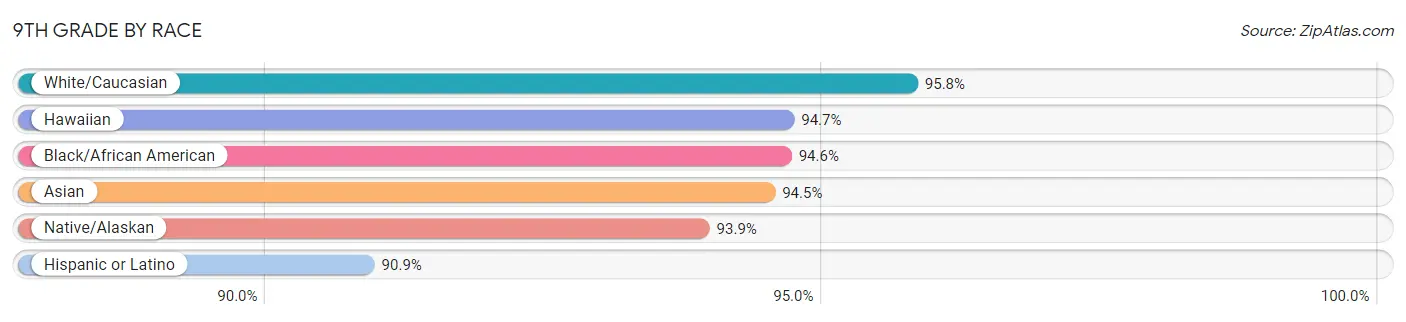
9th Grade by Race
Top demographics by 9th Grade within the race category in the United States are Whites/Caucasians (95.8%, 99.4/100), Hawaiians (94.7%, 22.7/100), and Blacks/African Americans (94.6%, 20.5/100).
| Race | Rating | Rank | 9th Grade |
| Asian | 9.9 /100 | #217 | Tragic 94.5% |
| Black/African American | 20.5 /100 | #201 | Fair 94.6% |
| Hawaiian | 22.7 /100 | #198 | Fair 94.7% |
| Hispanic or Latino | 0.0 /100 | #332 | Tragic 90.9% |
| Native/Alaskan | 0.4 /100 | #265 | Tragic 93.9% |
| White/Caucasian | 99.4 /100 | #77 | Exceptional 95.8% |
9th Grade by Ancestry
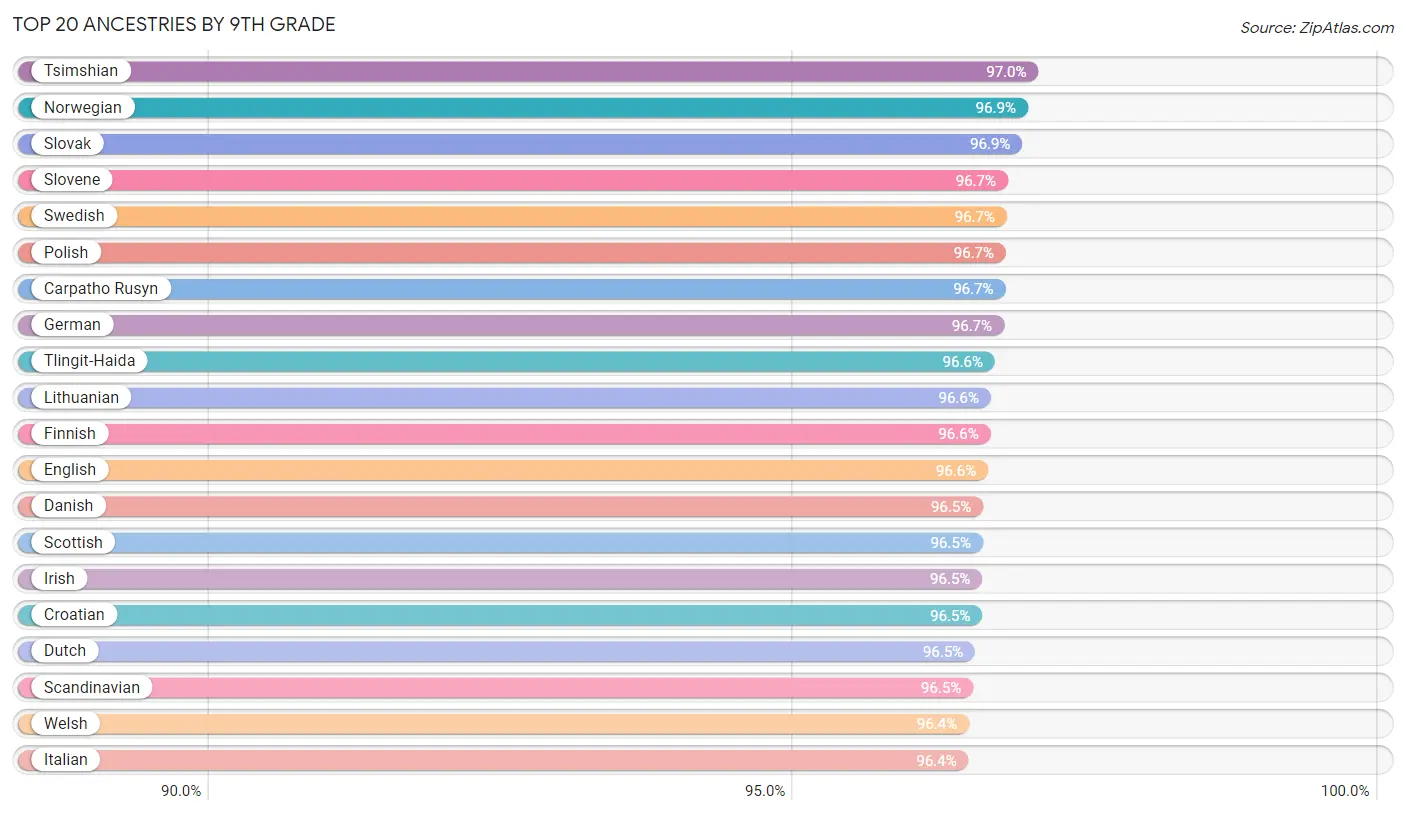
Top 20 Ancestries by 9th Grade
Top demographics by 9th Grade within the ancestry category in the United States are Tsimshian (97.0%, 100.0/100), Norwegians (96.9%, 100.0/100), Slovaks (96.9%, 100.0/100), Slovenes (96.7%, 100.0/100), and Swedes (96.7%, 100.0/100).
| Ancestry | Rating | Rank | 9th Grade |
| Afghan | 1.8 /100 | #247 | Tragic 94.2% |
| African | 9.0 /100 | #219 | Tragic 94.5% |
| Alaska Native | 99.9 /100 | #44 | Exceptional 96.1% |
| Alaskan Athabascan | 100.0 /100 | #21 | Exceptional 96.4% |
| Albanian | 76.1 /100 | #153 | Good 95.1% |
| Aleut | 99.8 /100 | #58 | Exceptional 96.0% |
| Alsatian | 58.6 /100 | #170 | Average 94.9% |
| American | 98.5 /100 | #95 | Exceptional 95.6% |
| Apache | 4.2 /100 | #230 | Tragic 94.3% |
| Arab | 74.9 /100 | #154 | Good 95.1% |
| Arapaho | 99.3 /100 | #81 | Exceptional 95.7% |
| Argentinean | 37.6 /100 | #184 | Fair 94.8% |
| Armenian | 0.3 /100 | #267 | Tragic 93.9% |
| Assyrian/Chaldean/Syriac | 32.0 /100 | #191 | Fair 94.7% |
| Australian | 99.9 /100 | #48 | Exceptional 96.0% |
| Austrian | 99.8 /100 | #53 | Exceptional 96.0% |
| Bahamian | 7.0 /100 | #223 | Tragic 94.4% |
| Bangladeshi | 0.0 /100 | #284 | Tragic 93.4% |
| Barbadian | 0.0 /100 | #283 | Tragic 93.5% |
| Basque | 94.1 /100 | #129 | Exceptional 95.4% |
| Belgian | 100.0 /100 | #32 | Exceptional 96.3% |
| Belizean | 0.0 /100 | #322 | Tragic 91.8% |
| Bermudan | 65.8 /100 | #162 | Good 95.0% |
| Bhutanese | 99.3 /100 | #80 | Exceptional 95.7% |
| Blackfeet | 62.6 /100 | #165 | Good 95.0% |
| Bolivian | 3.3 /100 | #235 | Tragic 94.3% |
| Brazilian | 49.8 /100 | #175 | Average 94.9% |
| British | 100.0 /100 | #31 | Exceptional 96.3% |
| British West Indian | 0.0 /100 | #291 | Tragic 93.2% |
| Bulgarian | 99.9 /100 | #35 | Exceptional 96.2% |
| Burmese | 96.0 /100 | #115 | Exceptional 95.4% |
| Cajun | 77.3 /100 | #151 | Good 95.1% |
| Cambodian | 95.6 /100 | #120 | Exceptional 95.4% |
| Canadian | 99.7 /100 | #63 | Exceptional 95.9% |
| Cape Verdean | 0.0 /100 | #316 | Tragic 92.2% |
| Carpatho Rusyn | 100.0 /100 | #7 | Exceptional 96.7% |
| Celtic | 99.9 /100 | #50 | Exceptional 96.0% |
| Central American | 0.0 /100 | #338 | Tragic 90.4% |
| Central American Indian | 0.0 /100 | #325 | Tragic 91.5% |
| Cherokee | 96.3 /100 | #111 | Exceptional 95.4% |
| Cheyenne | 51.5 /100 | #173 | Average 94.9% |
| Chickasaw | 96.8 /100 | #108 | Exceptional 95.5% |
| Chilean | 60.7 /100 | #168 | Good 95.0% |
| Chinese | 100.0 /100 | #29 | Exceptional 96.3% |
| Chippewa | 99.9 /100 | #42 | Exceptional 96.1% |
| Choctaw | 81.9 /100 | #147 | Excellent 95.1% |
| Colombian | 0.8 /100 | #253 | Tragic 94.0% |
| Colville | 58.5 /100 | #171 | Average 94.9% |
| Comanche | 14.9 /100 | #209 | Poor 94.6% |
| Costa Rican | 3.5 /100 | #234 | Tragic 94.3% |
| Cree | 95.5 /100 | #121 | Exceptional 95.4% |
| Creek | 98.8 /100 | #91 | Exceptional 95.6% |
| Croatian | 100.0 /100 | #16 | Exceptional 96.5% |
| Crow | 99.9 /100 | #45 | Exceptional 96.1% |
| Cuban | 0.0 /100 | #294 | Tragic 93.2% |
| Cypriot | 99.6 /100 | #67 | Exceptional 95.8% |
| Czech | 100.0 /100 | #23 | Exceptional 96.4% |
| Czechoslovakian | 99.9 /100 | #41 | Exceptional 96.1% |
| Danish | 100.0 /100 | #13 | Exceptional 96.5% |
| Delaware | 98.4 /100 | #97 | Exceptional 95.6% |
| Dominican | 0.0 /100 | #328 | Tragic 91.1% |
| Dutch | 100.0 /100 | #17 | Exceptional 96.5% |
| Dutch West Indian | 2.0 /100 | #244 | Tragic 94.2% |
| Eastern European | 100.0 /100 | #28 | Exceptional 96.3% |
| Ecuadorian | 0.0 /100 | #319 | Tragic 91.9% |
| Egyptian | 70.1 /100 | #158 | Good 95.0% |
| English | 100.0 /100 | #12 | Exceptional 96.6% |
| Estonian | 99.9 /100 | #37 | Exceptional 96.1% |
| Ethiopian | 5.4 /100 | #225 | Tragic 94.4% |
| European | 100.0 /100 | #22 | Exceptional 96.4% |
| Fijian | 0.0 /100 | #297 | Tragic 93.1% |
| Filipino | 98.5 /100 | #96 | Exceptional 95.6% |
| Finnish | 100.0 /100 | #11 | Exceptional 96.6% |
| French | 100.0 /100 | #25 | Exceptional 96.3% |
| French American Indian | 66.5 /100 | #161 | Good 95.0% |
| French Canadian | 100.0 /100 | #26 | Exceptional 96.3% |
| German | 100.0 /100 | #8 | Exceptional 96.7% |
| German Russian | 96.1 /100 | #114 | Exceptional 95.4% |
| Ghanaian | 0.5 /100 | #259 | Tragic 93.9% |
| Greek | 99.9 /100 | #49 | Exceptional 96.0% |
| Guamanian/Chamorro | 35.5 /100 | #187 | Fair 94.8% |
| Guatemalan | 0.0 /100 | #341 | Tragic 89.9% |
| Guyanese | 0.0 /100 | #303 | Tragic 92.7% |
| Haitian | 0.0 /100 | #298 | Tragic 93.1% |
| Hmong | 87.7 /100 | #137 | Excellent 95.2% |
| Honduran | 0.0 /100 | #329 | Tragic 91.0% |
| Hopi | 37.1 /100 | #186 | Fair 94.8% |
| Houma | 0.0 /100 | #312 | Tragic 92.3% |
| Hungarian | 100.0 /100 | #34 | Exceptional 96.2% |
| Icelander | 99.1 /100 | #85 | Exceptional 95.7% |
| Indian (Asian) | 8.6 /100 | #220 | Tragic 94.5% |
| Indonesian | 0.0 /100 | #296 | Tragic 93.1% |
| Inupiat | 99.5 /100 | #75 | Exceptional 95.8% |
| Iranian | 99.9 /100 | #43 | Exceptional 96.1% |
| Iraqi | 54.0 /100 | #172 | Average 94.9% |
| Irish | 100.0 /100 | #15 | Exceptional 96.5% |
| Iroquois | 96.2 /100 | #113 | Exceptional 95.4% |
| Israeli | 90.4 /100 | #133 | Exceptional 95.3% |
| Italian | 100.0 /100 | #20 | Exceptional 96.4% |
| Jamaican | 1.0 /100 | #251 | Tragic 94.1% |
| Japanese | 0.0 /100 | #305 | Tragic 92.6% |
| Jordanian | 93.5 /100 | #130 | Exceptional 95.3% |
| Kenyan | 79.1 /100 | #150 | Good 95.1% |
| Kiowa | 95.3 /100 | #123 | Exceptional 95.4% |
| Korean | 2.9 /100 | #237 | Tragic 94.3% |
| Laotian | 21.0 /100 | #199 | Fair 94.6% |
| Latvian | 100.0 /100 | #24 | Exceptional 96.4% |
| Lebanese | 98.1 /100 | #100 | Exceptional 95.6% |
| Liberian | 37.4 /100 | #185 | Fair 94.8% |
| Lithuanian | 100.0 /100 | #10 | Exceptional 96.6% |
| Lumbee | 4.7 /100 | #228 | Tragic 94.4% |
| Luxembourger | 100.0 /100 | #33 | Exceptional 96.3% |
| Macedonian | 99.8 /100 | #57 | Exceptional 96.0% |
| Malaysian | 0.0 /100 | #282 | Tragic 93.5% |
| Maltese | 100.0 /100 | #30 | Exceptional 96.3% |
| Marshallese | 27.9 /100 | #195 | Fair 94.7% |
| Menominee | 98.3 /100 | #99 | Exceptional 95.6% |
| Mexican | 0.0 /100 | #340 | Tragic 90.0% |
| Mexican American Indian | 0.0 /100 | #331 | Tragic 90.9% |
| Mongolian | 73.0 /100 | #157 | Good 95.0% |
| Moroccan | 19.6 /100 | #204 | Poor 94.6% |
| Native Hawaiian | 99.8 /100 | #60 | Exceptional 95.9% |
| Navajo | 0.3 /100 | #266 | Tragic 93.9% |
| Nepalese | 0.0 /100 | #318 | Tragic 92.0% |
| New Zealander | 99.8 /100 | #59 | Exceptional 95.9% |
| Nicaraguan | 0.0 /100 | #320 | Tragic 91.9% |
| Nigerian | 3.7 /100 | #233 | Tragic 94.3% |
| Northern European | 99.9 /100 | #36 | Exceptional 96.2% |
| Norwegian | 100.0 /100 | #2 | Exceptional 96.9% |
| Okinawan | 99.0 /100 | #87 | Exceptional 95.7% |
| Osage | 96.8 /100 | #109 | Exceptional 95.5% |
| Ottawa | 99.9 /100 | #39 | Exceptional 96.1% |
| Paiute | 1.9 /100 | #245 | Tragic 94.2% |
| Pakistani | 64.1 /100 | #163 | Good 95.0% |
| Palestinian | 94.3 /100 | #127 | Exceptional 95.4% |
| Panamanian | 29.0 /100 | #194 | Fair 94.7% |
| Paraguayan | 30.1 /100 | #193 | Fair 94.7% |
| Pennsylvania German | 0.0 /100 | #290 | Tragic 93.3% |
| Peruvian | 0.2 /100 | #274 | Tragic 93.8% |
| Pima | 0.4 /100 | #260 | Tragic 93.9% |
| Polish | 100.0 /100 | #6 | Exceptional 96.7% |
| Portuguese | 9.2 /100 | #218 | Tragic 94.5% |
| Potawatomi | 97.7 /100 | #103 | Exceptional 95.5% |
| Pueblo | 82.2 /100 | #145 | Excellent 95.1% |
| Puerto Rican | 0.0 /100 | #323 | Tragic 91.8% |
| Puget Sound Salish | 99.2 /100 | #82 | Exceptional 95.7% |
| Romanian | 99.3 /100 | #79 | Exceptional 95.7% |
| Russian | 99.9 /100 | #47 | Exceptional 96.0% |
| Salvadoran | 0.0 /100 | #342 | Tragic 89.6% |
| Samoan | 17.3 /100 | #206 | Poor 94.6% |
| Scandinavian | 100.0 /100 | #18 | Exceptional 96.5% |
| Scotch-Irish | 100.0 /100 | #27 | Exceptional 96.3% |
| Scottish | 100.0 /100 | #14 | Exceptional 96.5% |
| Seminole | 42.5 /100 | #182 | Average 94.8% |
| Senegalese | 1.9 /100 | #246 | Tragic 94.2% |
| Serbian | 99.9 /100 | #52 | Exceptional 96.0% |
| Shoshone | 95.3 /100 | #124 | Exceptional 95.4% |
| Sierra Leonean | 42.7 /100 | #181 | Average 94.8% |
| Sioux | 99.8 /100 | #61 | Exceptional 95.9% |
| Slavic | 99.9 /100 | #40 | Exceptional 96.1% |
| Slovak | 100.0 /100 | #3 | Exceptional 96.9% |
| Slovene | 100.0 /100 | #4 | Exceptional 96.7% |
| Somali | 2.9 /100 | #236 | Tragic 94.3% |
| South African | 98.8 /100 | #90 | Exceptional 95.6% |
| South American | 0.4 /100 | #261 | Tragic 93.9% |
| South American Indian | 2.8 /100 | #238 | Tragic 94.3% |
| Soviet Union | 95.6 /100 | #119 | Exceptional 95.4% |
| Spaniard | 59.6 /100 | #169 | Average 94.9% |
| Spanish | 84.4 /100 | #143 | Excellent 95.2% |
| Spanish American | 2.6 /100 | #241 | Tragic 94.2% |
| Spanish American Indian | 0.0 /100 | #347 | Tragic 88.3% |
| Sri Lankan | 0.0 /100 | #293 | Tragic 93.2% |
| Subsaharan African | 5.4 /100 | #226 | Tragic 94.4% |
| Sudanese | 32.7 /100 | #190 | Fair 94.7% |
| Swedish | 100.0 /100 | #5 | Exceptional 96.7% |
| Swiss | 99.2 /100 | #83 | Exceptional 95.7% |
| Syrian | 97.4 /100 | #104 | Exceptional 95.5% |
| Taiwanese | 0.1 /100 | #280 | Tragic 93.6% |
| Thai | 99.5 /100 | #74 | Exceptional 95.8% |
| Tlingit-Haida | 100.0 /100 | #9 | Exceptional 96.6% |
| Tohono O'Odham | 0.0 /100 | #304 | Tragic 92.6% |
| Tongan | 6.0 /100 | #224 | Tragic 94.4% |
| Trinidadian and Tobagonian | 0.1 /100 | #279 | Tragic 93.7% |
| Tsimshian | 100.0 /100 | #1 | Exceptional 97.0% |
| Turkish | 99.5 /100 | #72 | Exceptional 95.8% |
| U.S. Virgin Islander | 0.7 /100 | #254 | Tragic 94.0% |
| Ugandan | 77.0 /100 | #152 | Good 95.1% |
| Ukrainian | 99.7 /100 | #62 | Exceptional 95.9% |
| Uruguayan | 1.3 /100 | #249 | Tragic 94.1% |
| Ute | 62.6 /100 | #166 | Good 95.0% |
| Venezuelan | 63.6 /100 | #164 | Good 95.0% |
| Vietnamese | 0.0 /100 | #313 | Tragic 92.3% |
| Welsh | 100.0 /100 | #19 | Exceptional 96.4% |
| West Indian | 0.2 /100 | #276 | Tragic 93.7% |
| Yakama | 0.0 /100 | #339 | Tragic 90.1% |
| Yaqui | 0.0 /100 | #300 | Tragic 92.9% |
| Yugoslavian | 98.9 /100 | #89 | Exceptional 95.7% |
| Yuman | 0.2 /100 | #270 | Tragic 93.8% |
| Yup'ik | 83.3 /100 | #144 | Excellent 95.2% |
| Zimbabwean | 99.7 /100 | #64 | Exceptional 95.9% |
9th Grade by Immigration
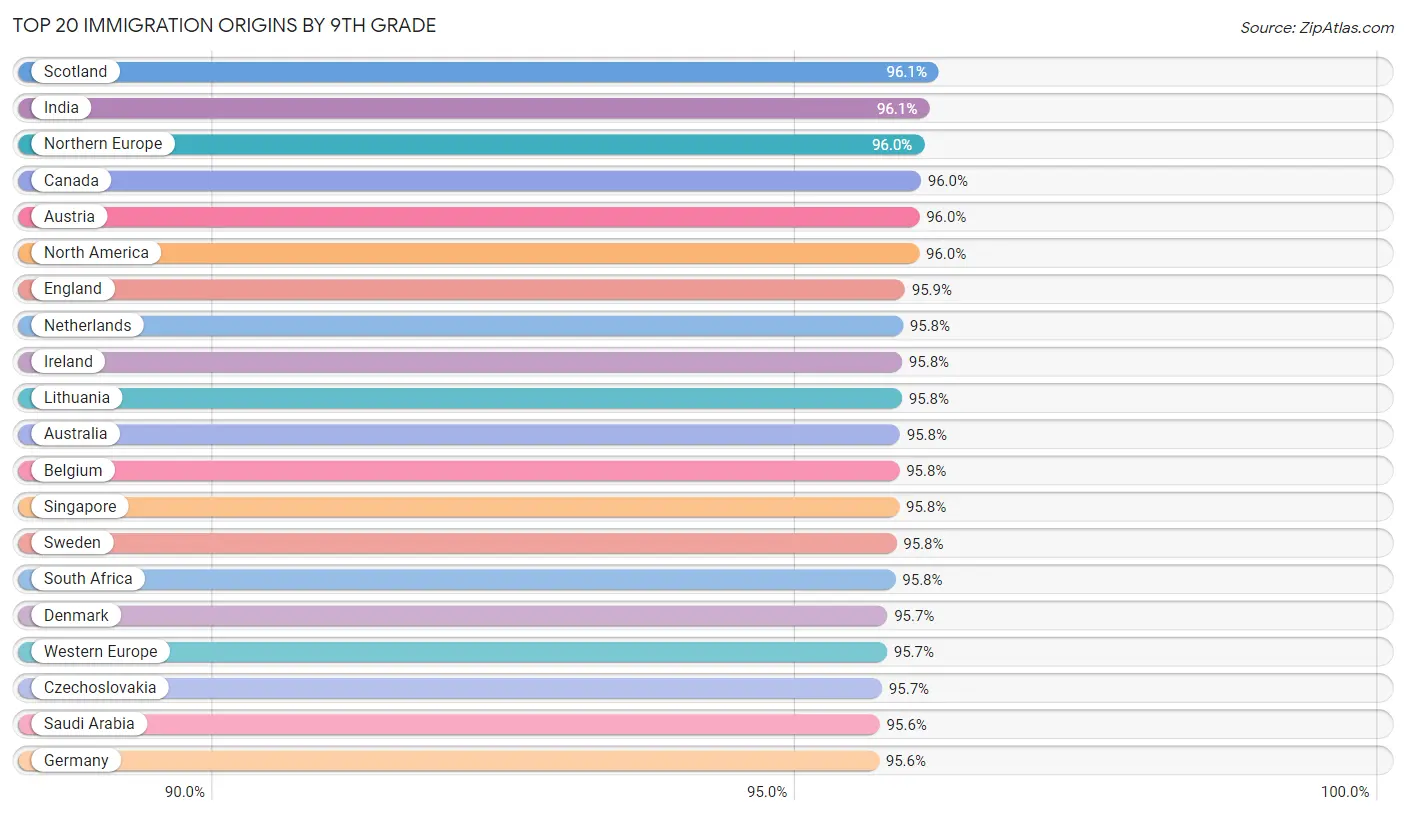
Top 20 Immigration Origins by 9th Grade
Top demographics by 9th Grade within the immigration category in the United States are Immigrants from Scotland (96.1%, 99.9/100), Immigrants from India (96.1%, 99.9/100), Immigrants from Northern Europe (96.0%, 99.9/100), Immigrants from Canada (96.0%, 99.8/100), and Immigrants from Austria (96.0%, 99.8/100).
| Immigration | Rating | Rank | 9th Grade |
| Nonimmigrants | 92.0 /100 | #132 | Exceptional 95.3% |
| Immigrants | 0.0 /100 | #307 | Tragic 92.5% |
| Afghanistan | 0.5 /100 | #256 | Tragic 94.0% |
| Africa | 3.9 /100 | #232 | Tragic 94.3% |
| Albania | 34.5 /100 | #188 | Fair 94.8% |
| Argentina | 34.4 /100 | #189 | Fair 94.8% |
| Armenia | 0.0 /100 | #326 | Tragic 91.4% |
| Asia | 7.7 /100 | #222 | Tragic 94.4% |
| Australia | 99.5 /100 | #70 | Exceptional 95.8% |
| Austria | 99.8 /100 | #55 | Exceptional 96.0% |
| Bahamas | 19.8 /100 | #203 | Poor 94.6% |
| Bangladesh | 0.0 /100 | #309 | Tragic 92.4% |
| Barbados | 0.0 /100 | #286 | Tragic 93.4% |
| Belarus | 88.9 /100 | #135 | Excellent 95.2% |
| Belgium | 99.5 /100 | #71 | Exceptional 95.8% |
| Belize | 0.0 /100 | #324 | Tragic 91.8% |
| Bolivia | 0.3 /100 | #268 | Tragic 93.9% |
| Bosnia and Herzegovina | 85.2 /100 | #141 | Excellent 95.2% |
| Brazil | 61.1 /100 | #167 | Good 95.0% |
| Bulgaria | 96.7 /100 | #110 | Exceptional 95.5% |
| Burma/Myanmar | 0.0 /100 | #295 | Tragic 93.1% |
| Cabo Verde | 0.0 /100 | #330 | Tragic 90.9% |
| Cambodia | 0.0 /100 | #310 | Tragic 92.4% |
| Cameroon | 2.1 /100 | #243 | Tragic 94.2% |
| Canada | 99.8 /100 | #54 | Exceptional 96.0% |
| Caribbean | 0.0 /100 | #315 | Tragic 92.2% |
| Central America | 0.0 /100 | #345 | Tragic 89.0% |
| Chile | 13.4 /100 | #210 | Poor 94.5% |
| China | 2.8 /100 | #239 | Tragic 94.3% |
| Colombia | 0.2 /100 | #275 | Tragic 93.8% |
| Congo | 0.4 /100 | #264 | Tragic 93.9% |
| Costa Rica | 0.5 /100 | #257 | Tragic 94.0% |
| Croatia | 96.2 /100 | #112 | Exceptional 95.4% |
| Cuba | 0.0 /100 | #317 | Tragic 92.2% |
| Czechoslovakia | 98.9 /100 | #88 | Exceptional 95.7% |
| Denmark | 99.1 /100 | #84 | Exceptional 95.7% |
| Dominica | 0.0 /100 | #302 | Tragic 92.7% |
| Dominican Republic | 0.0 /100 | #336 | Tragic 90.5% |
| Eastern Africa | 8.2 /100 | #221 | Tragic 94.5% |
| Eastern Asia | 19.8 /100 | #202 | Poor 94.6% |
| Eastern Europe | 85.8 /100 | #139 | Excellent 95.2% |
| Ecuador | 0.0 /100 | #321 | Tragic 91.8% |
| Egypt | 50.0 /100 | #174 | Average 94.9% |
| El Salvador | 0.0 /100 | #344 | Tragic 89.0% |
| England | 99.6 /100 | #65 | Exceptional 95.9% |
| Eritrea | 0.1 /100 | #278 | Tragic 93.7% |
| Ethiopia | 2.7 /100 | #240 | Tragic 94.3% |
| Europe | 95.7 /100 | #116 | Exceptional 95.4% |
| Fiji | 0.0 /100 | #311 | Tragic 92.3% |
| France | 97.4 /100 | #105 | Exceptional 95.5% |
| Germany | 98.7 /100 | #93 | Exceptional 95.6% |
| Ghana | 0.2 /100 | #271 | Tragic 93.8% |
| Greece | 84.6 /100 | #142 | Excellent 95.2% |
| Grenada | 0.0 /100 | #299 | Tragic 93.0% |
| Guatemala | 0.0 /100 | #343 | Tragic 89.4% |
| Guyana | 0.0 /100 | #308 | Tragic 92.5% |
| Haiti | 0.0 /100 | #301 | Tragic 92.7% |
| Honduras | 0.0 /100 | #335 | Tragic 90.6% |
| Hong Kong | 1.3 /100 | #250 | Tragic 94.1% |
| Hungary | 94.2 /100 | #128 | Exceptional 95.4% |
| India | 99.9 /100 | #46 | Exceptional 96.1% |
| Indonesia | 12.3 /100 | #211 | Poor 94.5% |
| Iran | 88.3 /100 | #136 | Excellent 95.2% |
| Iraq | 47.8 /100 | #177 | Average 94.9% |
| Ireland | 99.6 /100 | #68 | Exceptional 95.8% |
| Israel | 89.6 /100 | #134 | Excellent 95.3% |
| Italy | 66.6 /100 | #160 | Good 95.0% |
| Jamaica | 0.4 /100 | #262 | Tragic 93.9% |
| Japan | 98.4 /100 | #98 | Exceptional 95.6% |
| Jordan | 81.2 /100 | #148 | Excellent 95.1% |
| Kazakhstan | 74.7 /100 | #155 | Good 95.1% |
| Kenya | 73.1 /100 | #156 | Good 95.0% |
| Korea | 79.6 /100 | #149 | Good 95.1% |
| Kuwait | 95.5 /100 | #122 | Exceptional 95.4% |
| Laos | 0.0 /100 | #292 | Tragic 93.2% |
| Latin America | 0.0 /100 | #337 | Tragic 90.4% |
| Latvia | 98.7 /100 | #94 | Exceptional 95.6% |
| Lebanon | 27.2 /100 | #196 | Fair 94.7% |
| Liberia | 11.8 /100 | #214 | Poor 94.5% |
| Lithuania | 99.6 /100 | #69 | Exceptional 95.8% |
| Malaysia | 12.2 /100 | #212 | Poor 94.5% |
| Mexico | 0.0 /100 | #346 | Tragic 88.7% |
| Micronesia | 24.7 /100 | #197 | Fair 94.7% |
| Middle Africa | 2.2 /100 | #242 | Tragic 94.2% |
| Moldova | 97.9 /100 | #101 | Exceptional 95.5% |
| Morocco | 16.3 /100 | #207 | Poor 94.6% |
| Nepal | 39.7 /100 | #183 | Fair 94.8% |
| Netherlands | 99.6 /100 | #66 | Exceptional 95.8% |
| Nicaragua | 0.0 /100 | #327 | Tragic 91.3% |
| Nigeria | 0.6 /100 | #255 | Tragic 94.0% |
| North America | 99.8 /100 | #56 | Exceptional 96.0% |
| North Macedonia | 92.3 /100 | #131 | Exceptional 95.3% |
| Northern Africa | 30.7 /100 | #192 | Fair 94.7% |
| Northern Europe | 99.9 /100 | #51 | Exceptional 96.0% |
| Norway | 97.1 /100 | #106 | Exceptional 95.5% |
| Oceania | 12.1 /100 | #213 | Poor 94.5% |
| Pakistan | 15.5 /100 | #208 | Poor 94.6% |
| Panama | 4.0 /100 | #231 | Tragic 94.3% |
| Peru | 0.0 /100 | #285 | Tragic 93.4% |
| Philippines | 0.1 /100 | #277 | Tragic 93.7% |
| Poland | 46.7 /100 | #178 | Average 94.9% |
| Portugal | 0.0 /100 | #314 | Tragic 92.2% |
| Romania | 95.6 /100 | #117 | Exceptional 95.4% |
| Russia | 86.6 /100 | #138 | Excellent 95.2% |
| Saudi Arabia | 98.8 /100 | #92 | Exceptional 95.6% |
| Scotland | 99.9 /100 | #38 | Exceptional 96.1% |
| Senegal | 0.9 /100 | #252 | Tragic 94.1% |
| Serbia | 94.4 /100 | #126 | Exceptional 95.4% |
| Sierra Leone | 4.8 /100 | #227 | Tragic 94.4% |
| Singapore | 99.5 /100 | #73 | Exceptional 95.8% |
| Somalia | 1.4 /100 | #248 | Tragic 94.1% |
| South Africa | 99.4 /100 | #78 | Exceptional 95.8% |
| South America | 0.2 /100 | #273 | Tragic 93.8% |
| South Central Asia | 95.1 /100 | #125 | Exceptional 95.4% |
| South Eastern Asia | 0.0 /100 | #288 | Tragic 93.3% |
| Southern Europe | 4.5 /100 | #229 | Tragic 94.3% |
| Spain | 49.1 /100 | #176 | Average 94.9% |
| Sri Lanka | 82.1 /100 | #146 | Excellent 95.1% |
| St. Vincent and the Grenadines | 0.0 /100 | #287 | Tragic 93.4% |
| Sudan | 17.6 /100 | #205 | Poor 94.6% |
| Sweden | 99.5 /100 | #76 | Exceptional 95.8% |
| Switzerland | 97.7 /100 | #102 | Exceptional 95.5% |
| Syria | 11.0 /100 | #215 | Poor 94.5% |
| Taiwan | 85.3 /100 | #140 | Excellent 95.2% |
| Thailand | 0.5 /100 | #258 | Tragic 93.9% |
| Trinidad and Tobago | 0.1 /100 | #281 | Tragic 93.6% |
| Turkey | 95.6 /100 | #118 | Exceptional 95.4% |
| Uganda | 43.1 /100 | #180 | Average 94.8% |
| Ukraine | 67.4 /100 | #159 | Good 95.0% |
| Uruguay | 0.2 /100 | #269 | Tragic 93.8% |
| Uzbekistan | 0.4 /100 | #263 | Tragic 93.9% |
| Venezuela | 46.5 /100 | #179 | Average 94.9% |
| Vietnam | 0.0 /100 | #306 | Tragic 92.6% |
| West Indies | 0.0 /100 | #289 | Tragic 93.3% |
| Western Africa | 0.2 /100 | #272 | Tragic 93.8% |
| Western Asia | 10.7 /100 | #216 | Poor 94.5% |
| Western Europe | 99.1 /100 | #86 | Exceptional 95.7% |
| Yemen | 0.0 /100 | #333 | Tragic 90.8% |
| Zaire | 20.6 /100 | #200 | Fair 94.6% |
| Zimbabwe | 96.9 /100 | #107 | Exceptional 95.5% |
| Azores | 0.0 /100 | #334 | Tragic 90.8% |