Zip Codes with the Highest Percentage of Population Employed in Installation, Maintenance & Repair in Castro Valley, CA
RELATED REPORTS & OPTIONS
Installation, Maintenance & Repair
Castro Valley
Compare Zip Codes
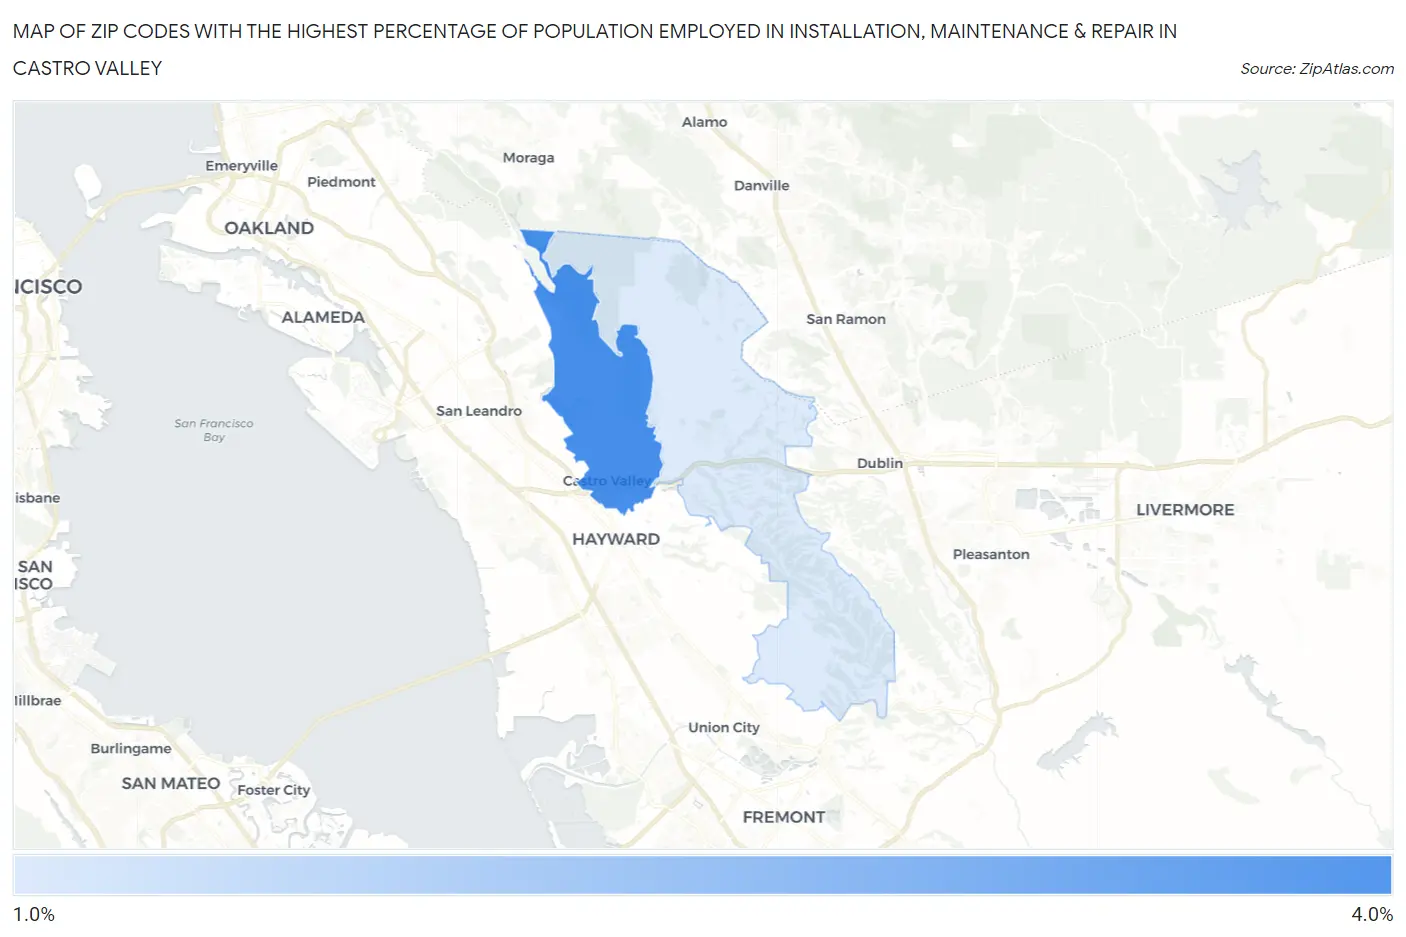
Map of Zip Codes with the Highest Percentage of Population Employed in Installation, Maintenance & Repair in Castro Valley
1.7%
3.5%
Zip Codes with the Highest Percentage of Population Employed in Installation, Maintenance & Repair in Castro Valley, CA
| Zip Code | % Employed | vs State | vs National | |
| 1. | 94546 | 3.5% | 2.6%(+0.968)#452 | 3.1%(+0.457)#14,515 |
| 2. | 94552 | 1.7% | 2.6%(-0.893)#1,076 | 3.1%(-1.40)#23,512 |
1
Common Questions
What are the Top Zip Codes with the Highest Percentage of Population Employed in Installation, Maintenance & Repair in Castro Valley, CA?
Top Zip Codes with the Highest Percentage of Population Employed in Installation, Maintenance & Repair in Castro Valley, CA are:
What zip code has the Highest Percentage of Population Employed in Installation, Maintenance & Repair in Castro Valley, CA?
94546 has the Highest Percentage of Population Employed in Installation, Maintenance & Repair in Castro Valley, CA with 3.5%.
What is the Percentage of Population Employed in Installation, Maintenance & Repair in Castro Valley, CA?
Percentage of Population Employed in Installation, Maintenance & Repair in Castro Valley is 3.2%.
What is the Percentage of Population Employed in Installation, Maintenance & Repair in California?
Percentage of Population Employed in Installation, Maintenance & Repair in California is 2.6%.
What is the Percentage of Population Employed in Installation, Maintenance & Repair in the United States?
Percentage of Population Employed in Installation, Maintenance & Repair in the United States is 3.1%.