Cities with the Highest Percentage of Eastern European Population in California
RELATED REPORTS & OPTIONS
Eastern European
California
Compare Cities
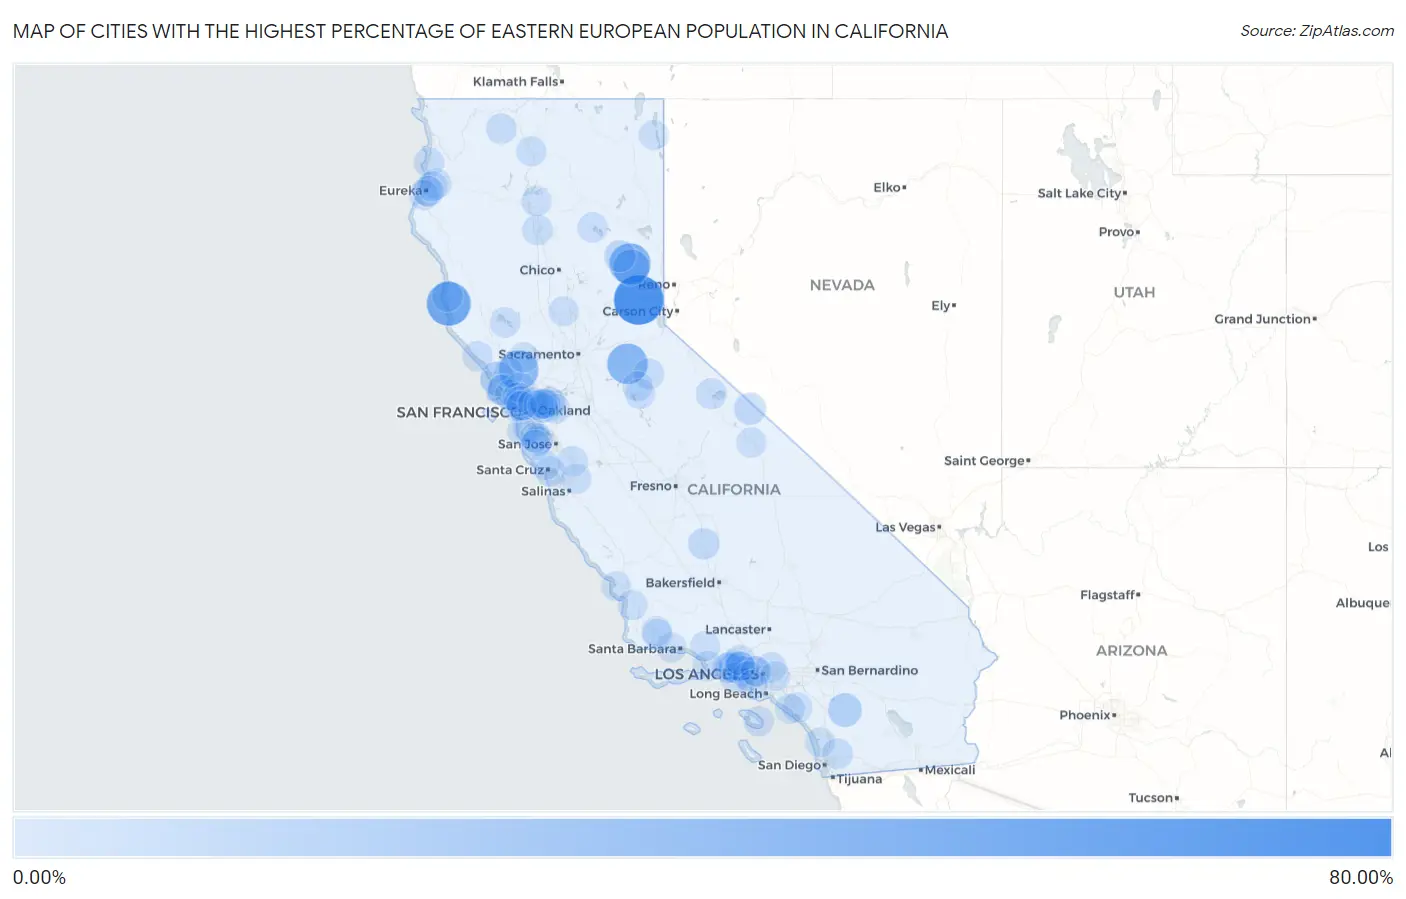
Map of Cities with the Highest Percentage of Eastern European Population in California
0.00%
80.00%
Cities with the Highest Percentage of Eastern European Population in California
| City | Eastern European | vs State | vs National | |
| 1. | Kingvale | 63.53% | 0.30%(+63.2)#1 | 0.30%(+63.2)#2 |
| 2. | Little River | 44.84% | 0.30%(+44.5)#2 | 0.30%(+44.5)#5 |
| 3. | Choctaw Valley | 39.29% | 0.30%(+39.0)#3 | 0.30%(+39.0)#6 |
| 4. | Mohawk Vista | 35.71% | 0.30%(+35.4)#4 | 0.30%(+35.4)#7 |
| 5. | Volcano | 33.90% | 0.30%(+33.6)#5 | 0.30%(+33.6)#11 |
| 6. | Glen Ellen | 30.26% | 0.30%(+30.0)#6 | 0.30%(+30.0)#13 |
| 7. | C Road | 20.43% | 0.30%(+20.1)#7 | 0.30%(+20.1)#20 |
| 8. | Tomales | 14.04% | 0.30%(+13.7)#8 | 0.30%(+13.7)#32 |
| 9. | Williams Canyon | 13.89% | 0.30%(+13.6)#9 | 0.30%(+13.6)#34 |
| 10. | Lake Riverside | 12.56% | 0.30%(+12.3)#10 | 0.30%(+12.3)#37 |
| 11. | Benton | 6.87% | 0.30%(+6.57)#11 | 0.30%(+6.57)#83 |
| 12. | Greenhorn | 6.32% | 0.30%(+6.02)#12 | 0.30%(+6.02)#94 |
| 13. | Teviston | 5.11% | 0.30%(+4.80)#13 | 0.30%(+4.80)#147 |
| 14. | Point Reyes Station | 4.96% | 0.30%(+4.66)#14 | 0.30%(+4.66)#159 |
| 15. | Bayview Cdp Contra Costa County | 4.59% | 0.30%(+4.29)#15 | 0.30%(+4.28)#193 |
| 16. | Baywood Park | 4.15% | 0.30%(+3.85)#16 | 0.30%(+3.85)#225 |
| 17. | Caspar | 3.89% | 0.30%(+3.59)#17 | 0.30%(+3.59)#251 |
| 18. | Hillsborough | 3.61% | 0.30%(+3.30)#18 | 0.30%(+3.30)#284 |
| 19. | Mono City | 3.59% | 0.30%(+3.29)#19 | 0.30%(+3.28)#288 |
| 20. | Tiburon | 3.54% | 0.30%(+3.24)#20 | 0.30%(+3.24)#296 |
| 21. | Tamalpais Homestead Valley | 3.21% | 0.30%(+2.90)#21 | 0.30%(+2.90)#339 |
| 22. | Castella | 3.14% | 0.30%(+2.84)#22 | 0.30%(+2.83)#350 |
| 23. | Eucalyptus Hills | 3.10% | 0.30%(+2.79)#23 | 0.30%(+2.79)#356 |
| 24. | Calabasas | 3.08% | 0.30%(+2.78)#24 | 0.30%(+2.78)#362 |
| 25. | Dorrington | 3.01% | 0.30%(+2.71)#25 | 0.30%(+2.71)#372 |
| 26. | Fort Jones | 2.75% | 0.30%(+2.45)#26 | 0.30%(+2.45)#423 |
| 27. | Westlake Village | 2.67% | 0.30%(+2.37)#27 | 0.30%(+2.36)#445 |
| 28. | Bend | 2.66% | 0.30%(+2.36)#28 | 0.30%(+2.35)#446 |
| 29. | Blue Lake | 2.62% | 0.30%(+2.31)#29 | 0.30%(+2.31)#460 |
| 30. | Alamo | 2.55% | 0.30%(+2.25)#30 | 0.30%(+2.25)#472 |
| 31. | North Gate | 2.44% | 0.30%(+2.14)#31 | 0.30%(+2.14)#505 |
| 32. | Oak Park | 2.39% | 0.30%(+2.09)#32 | 0.30%(+2.09)#518 |
| 33. | Avalon | 2.35% | 0.30%(+2.05)#33 | 0.30%(+2.05)#536 |
| 34. | Topanga | 2.35% | 0.30%(+2.05)#34 | 0.30%(+2.05)#537 |
| 35. | Lake Sherwood | 2.23% | 0.30%(+1.92)#35 | 0.30%(+1.92)#599 |
| 36. | San Pasqual | 2.22% | 0.30%(+1.92)#36 | 0.30%(+1.92)#601 |
| 37. | Timber Cove | 2.13% | 0.30%(+1.83)#37 | 0.30%(+1.82)#638 |
| 38. | Myrtletown | 2.12% | 0.30%(+1.82)#38 | 0.30%(+1.82)#640 |
| 39. | Malibu | 2.08% | 0.30%(+1.77)#39 | 0.30%(+1.77)#665 |
| 40. | Beverly Hills | 2.07% | 0.30%(+1.77)#40 | 0.30%(+1.77)#668 |
| 41. | Agoura Hills | 2.04% | 0.30%(+1.73)#41 | 0.30%(+1.73)#683 |
| 42. | El Granada | 2.02% | 0.30%(+1.72)#42 | 0.30%(+1.71)#694 |
| 43. | Channel Islands Beach | 1.99% | 0.30%(+1.69)#43 | 0.30%(+1.69)#701 |
| 44. | Twin Lakes | 1.98% | 0.30%(+1.68)#44 | 0.30%(+1.68)#703 |
| 45. | Soda Bay | 1.98% | 0.30%(+1.67)#45 | 0.30%(+1.67)#711 |
| 46. | Muir Beach | 1.97% | 0.30%(+1.66)#46 | 0.30%(+1.66)#716 |
| 47. | Santa Susana | 1.94% | 0.30%(+1.64)#47 | 0.30%(+1.64)#739 |
| 48. | Murphys | 1.93% | 0.30%(+1.63)#48 | 0.30%(+1.63)#747 |
| 49. | Big Lagoon | 1.92% | 0.30%(+1.62)#49 | 0.30%(+1.62)#748 |
| 50. | Chester | 1.89% | 0.30%(+1.59)#50 | 0.30%(+1.59)#761 |
| 51. | Castle Hill | 1.88% | 0.30%(+1.58)#51 | 0.30%(+1.58)#768 |
| 52. | Belvedere | 1.85% | 0.30%(+1.55)#52 | 0.30%(+1.54)#788 |
| 53. | Lagunitas Forest Knolls | 1.83% | 0.30%(+1.53)#53 | 0.30%(+1.53)#795 |
| 54. | Mount Shasta | 1.82% | 0.30%(+1.52)#54 | 0.30%(+1.52)#802 |
| 55. | San Martin | 1.80% | 0.30%(+1.50)#55 | 0.30%(+1.49)#816 |
| 56. | Black Point Green Point | 1.78% | 0.30%(+1.48)#56 | 0.30%(+1.48)#822 |
| 57. | Santa Monica | 1.77% | 0.30%(+1.46)#57 | 0.30%(+1.46)#835 |
| 58. | Inverness | 1.70% | 0.30%(+1.40)#58 | 0.30%(+1.40)#859 |
| 59. | Goleta | 1.69% | 0.30%(+1.39)#59 | 0.30%(+1.38)#864 |
| 60. | West Hollywood | 1.69% | 0.30%(+1.38)#60 | 0.30%(+1.38)#867 |
| 61. | Los Olivos | 1.67% | 0.30%(+1.37)#61 | 0.30%(+1.36)#881 |
| 62. | Corte Madera | 1.66% | 0.30%(+1.36)#62 | 0.30%(+1.36)#887 |
| 63. | Hidden Hills | 1.66% | 0.30%(+1.36)#63 | 0.30%(+1.36)#890 |
| 64. | Berkeley | 1.60% | 0.30%(+1.30)#64 | 0.30%(+1.30)#930 |
| 65. | San Juan Bautista | 1.57% | 0.30%(+1.27)#65 | 0.30%(+1.27)#955 |
| 66. | Strawberry Cdp Marin County | 1.56% | 0.30%(+1.26)#66 | 0.30%(+1.26)#959 |
| 67. | Blackhawk | 1.55% | 0.30%(+1.25)#67 | 0.30%(+1.25)#964 |
| 68. | West Bishop | 1.52% | 0.30%(+1.22)#68 | 0.30%(+1.22)#1,003 |
| 69. | Ladera Ranch | 1.52% | 0.30%(+1.22)#69 | 0.30%(+1.22)#1,006 |
| 70. | Columbia | 1.52% | 0.30%(+1.22)#70 | 0.30%(+1.21)#1,008 |
| 71. | Kensington | 1.47% | 0.30%(+1.17)#71 | 0.30%(+1.17)#1,046 |
| 72. | San Anselmo | 1.46% | 0.30%(+1.16)#72 | 0.30%(+1.15)#1,055 |
| 73. | Cotati | 1.44% | 0.30%(+1.14)#73 | 0.30%(+1.14)#1,065 |
| 74. | Fields Landing | 1.43% | 0.30%(+1.13)#74 | 0.30%(+1.13)#1,076 |
| 75. | Highlands | 1.43% | 0.30%(+1.13)#75 | 0.30%(+1.12)#1,077 |
| 76. | Cedarville | 1.40% | 0.30%(+1.10)#76 | 0.30%(+1.10)#1,097 |
| 77. | Ladera | 1.40% | 0.30%(+1.10)#77 | 0.30%(+1.10)#1,101 |
| 78. | St Helena | 1.40% | 0.30%(+1.10)#78 | 0.30%(+1.10)#1,103 |
| 79. | Ballard | 1.39% | 0.30%(+1.09)#79 | 0.30%(+1.08)#1,119 |
| 80. | Los Osos | 1.39% | 0.30%(+1.08)#80 | 0.30%(+1.08)#1,121 |
| 81. | Felton | 1.38% | 0.30%(+1.08)#81 | 0.30%(+1.07)#1,129 |
| 82. | Moraga | 1.38% | 0.30%(+1.07)#82 | 0.30%(+1.07)#1,133 |
| 83. | Orinda | 1.37% | 0.30%(+1.06)#83 | 0.30%(+1.06)#1,146 |
| 84. | Rose Hills | 1.36% | 0.30%(+1.06)#84 | 0.30%(+1.06)#1,152 |
| 85. | Sausalito | 1.35% | 0.30%(+1.05)#85 | 0.30%(+1.05)#1,160 |
| 86. | Blacklake | 1.33% | 0.30%(+1.03)#86 | 0.30%(+1.03)#1,189 |
| 87. | Sutter | 1.33% | 0.30%(+1.03)#87 | 0.30%(+1.03)#1,191 |
| 88. | Meiners Oaks | 1.33% | 0.30%(+1.03)#88 | 0.30%(+1.02)#1,194 |
| 89. | Saranap | 1.32% | 0.30%(+1.02)#89 | 0.30%(+1.02)#1,198 |
| 90. | Portola Valley | 1.30% | 0.30%(+0.995)#90 | 0.30%(+0.993)#1,225 |
| 91. | Eureka | 1.29% | 0.30%(+0.992)#91 | 0.30%(+0.990)#1,230 |
| 92. | Arcata | 1.26% | 0.30%(+0.955)#92 | 0.30%(+0.953)#1,271 |
| 93. | Trabuco Canyon | 1.25% | 0.30%(+0.953)#93 | 0.30%(+0.951)#1,275 |
| 94. | Manhattan Beach | 1.25% | 0.30%(+0.951)#94 | 0.30%(+0.949)#1,280 |
| 95. | Laguna Beach | 1.24% | 0.30%(+0.941)#95 | 0.30%(+0.938)#1,294 |
| 96. | Bella Vista | 1.24% | 0.30%(+0.937)#96 | 0.30%(+0.935)#1,302 |
| 97. | Encinitas | 1.21% | 0.30%(+0.911)#97 | 0.30%(+0.909)#1,345 |
| 98. | Lafayette | 1.21% | 0.30%(+0.907)#98 | 0.30%(+0.905)#1,351 |
| 99. | La Honda | 1.20% | 0.30%(+0.894)#99 | 0.30%(+0.892)#1,369 |
| 100. | Woodside | 1.18% | 0.30%(+0.878)#100 | 0.30%(+0.876)#1,381 |
Common Questions
What are the Top 10 Cities with the Highest Percentage of Eastern European Population in California?
Top 10 Cities with the Highest Percentage of Eastern European Population in California are:
#1
63.53%
#2
44.84%
#3
35.71%
#4
33.90%
#5
30.26%
#6
20.43%
#7
14.04%
#8
12.56%
#9
6.87%
#10
6.32%
What city has the Highest Percentage of Eastern European Population in California?
Kingvale has the Highest Percentage of Eastern European Population in California with 63.53%.
What is the Percentage of Eastern European Population in the State of California?
Percentage of Eastern European Population in California is 0.30%.
What is the Percentage of Eastern European Population in the United States?
Percentage of Eastern European Population in the United States is 0.30%.