Cities with the Highest Percentage of Population Employed in Public Administration in California
RELATED REPORTS & OPTIONS
Public Administration
California
Compare Cities
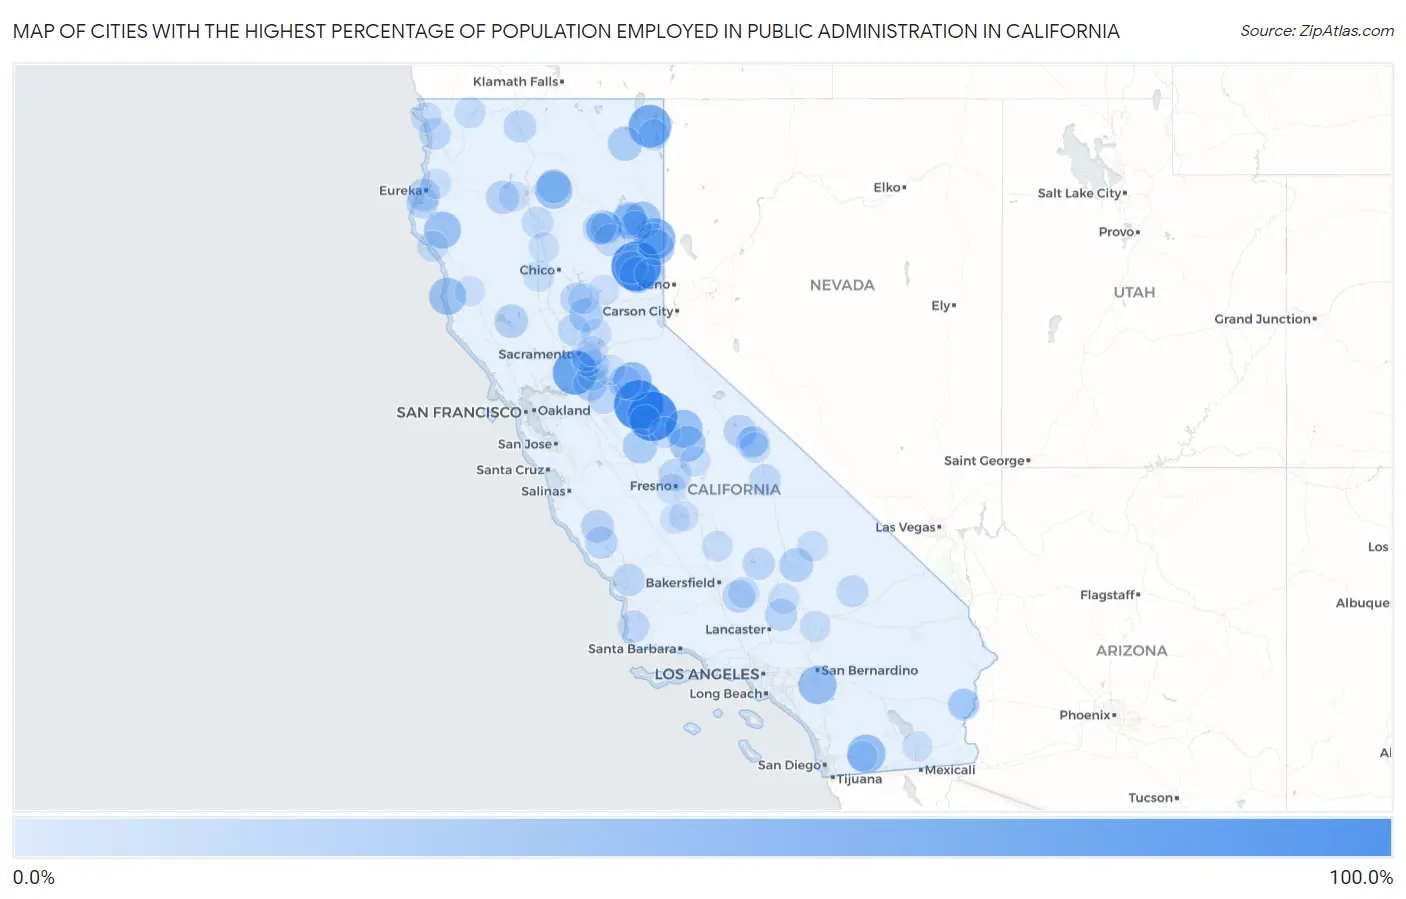
Map of Cities with the Highest Percentage of Population Employed in Public Administration in California
0.0%
100.0%
Cities with the Highest Percentage of Population Employed in Public Administration in California
| City | % Employed | vs State | vs National | |
| 1. | Iron Horse | 100.0% | 4.7%(+95.3)#1 | 4.7%(+95.3)#1 |
| 2. | Chinese Camp | 100.0% | 4.7%(+95.3)#2 | 4.7%(+95.3)#15 |
| 3. | Tancred | 100.0% | 4.7%(+95.3)#3 | 4.7%(+95.3)#17 |
| 4. | Coulterville | 100.0% | 4.7%(+95.3)#4 | 4.7%(+95.3)#22 |
| 5. | Courtland | 77.4% | 4.7%(+72.7)#5 | 4.7%(+72.7)#44 |
| 6. | Igo | 73.8% | 4.7%(+69.1)#6 | 4.7%(+69.1)#51 |
| 7. | Lake City | 70.0% | 4.7%(+65.3)#7 | 4.7%(+65.3)#59 |
| 8. | Herlong | 61.2% | 4.7%(+56.5)#8 | 4.7%(+56.5)#78 |
| 9. | Stones Landing | 59.3% | 4.7%(+54.6)#9 | 4.7%(+54.6)#85 |
| 10. | Mountain Ranch | 50.0% | 4.7%(+45.3)#10 | 4.7%(+45.3)#127 |
| 11. | Mount Laguna | 50.0% | 4.7%(+45.3)#11 | 4.7%(+45.3)#134 |
| 12. | March Arb | 49.3% | 4.7%(+44.6)#12 | 4.7%(+44.6)#151 |
| 13. | Wawona | 47.0% | 4.7%(+42.3)#13 | 4.7%(+42.3)#171 |
| 14. | Round Mountain | 46.7% | 4.7%(+42.0)#14 | 4.7%(+42.0)#172 |
| 15. | Caspar | 45.1% | 4.7%(+40.4)#15 | 4.7%(+40.4)#186 |
| 16. | Myers Flat | 44.0% | 4.7%(+39.4)#16 | 4.7%(+39.4)#198 |
| 17. | Litchfield | 43.3% | 4.7%(+38.6)#17 | 4.7%(+38.6)#217 |
| 18. | Mountain Meadows | 40.8% | 4.7%(+36.1)#18 | 4.7%(+36.1)#253 |
| 19. | Calpine | 40.6% | 4.7%(+35.9)#19 | 4.7%(+35.9)#254 |
| 20. | Rumsey | 40.4% | 4.7%(+35.7)#20 | 4.7%(+35.7)#257 |
| 21. | Bass Lake | 39.6% | 4.7%(+35.0)#21 | 4.7%(+35.0)#265 |
| 22. | Doyle | 39.6% | 4.7%(+34.9)#22 | 4.7%(+34.9)#267 |
| 23. | Johnstonville | 35.1% | 4.7%(+30.4)#23 | 4.7%(+30.4)#340 |
| 24. | Clear Creek | 34.6% | 4.7%(+29.9)#24 | 4.7%(+29.9)#346 |
| 25. | Bear Creek | 33.3% | 4.7%(+28.7)#25 | 4.7%(+28.6)#369 |
| 26. | California Pines | 32.8% | 4.7%(+28.1)#26 | 4.7%(+28.1)#395 |
| 27. | Susanville | 30.8% | 4.7%(+26.1)#27 | 4.7%(+26.1)#450 |
| 28. | Ridgecrest | 30.8% | 4.7%(+26.1)#28 | 4.7%(+26.1)#451 |
| 29. | Montgomery Creek | 30.7% | 4.7%(+26.0)#29 | 4.7%(+26.0)#457 |
| 30. | Acampo | 30.3% | 4.7%(+25.6)#30 | 4.7%(+25.6)#468 |
| 31. | Beale Afb | 30.3% | 4.7%(+25.6)#31 | 4.7%(+25.6)#474 |
| 32. | Clearlake Oaks | 29.7% | 4.7%(+25.0)#32 | 4.7%(+25.0)#498 |
| 33. | Lewiston | 28.3% | 4.7%(+23.6)#33 | 4.7%(+23.6)#550 |
| 34. | Janesville | 27.0% | 4.7%(+22.3)#34 | 4.7%(+22.3)#614 |
| 35. | San Andreas | 26.9% | 4.7%(+22.2)#35 | 4.7%(+22.2)#616 |
| 36. | Swall Meadows | 26.7% | 4.7%(+22.0)#36 | 4.7%(+22.0)#624 |
| 37. | Pine Canyon | 26.4% | 4.7%(+21.7)#37 | 4.7%(+21.7)#645 |
| 38. | Fields Landing | 25.8% | 4.7%(+21.1)#38 | 4.7%(+21.1)#679 |
| 39. | Bear Valley Springs | 25.5% | 4.7%(+20.8)#39 | 4.7%(+20.8)#691 |
| 40. | Peters | 25.4% | 4.7%(+20.7)#40 | 4.7%(+20.7)#701 |
| 41. | Rolling Hills | 25.4% | 4.7%(+20.7)#41 | 4.7%(+20.7)#702 |
| 42. | Grenada | 25.0% | 4.7%(+20.3)#42 | 4.7%(+20.3)#725 |
| 43. | Lockwood | 24.7% | 4.7%(+20.0)#43 | 4.7%(+20.0)#763 |
| 44. | Lake Almanor Peninsula | 24.0% | 4.7%(+19.4)#44 | 4.7%(+19.4)#815 |
| 45. | Edwards Afb | 24.0% | 4.7%(+19.3)#45 | 4.7%(+19.3)#817 |
| 46. | C Road | 24.0% | 4.7%(+19.3)#46 | 4.7%(+19.3)#819 |
| 47. | Loleta | 23.8% | 4.7%(+19.1)#47 | 4.7%(+19.1)#835 |
| 48. | Weldon | 23.8% | 4.7%(+19.1)#48 | 4.7%(+19.1)#840 |
| 49. | Garden Farms | 23.7% | 4.7%(+19.1)#49 | 4.7%(+19.1)#843 |
| 50. | Honcut | 22.9% | 4.7%(+18.2)#50 | 4.7%(+18.2)#903 |
| 51. | Nicolaus | 22.4% | 4.7%(+17.8)#51 | 4.7%(+17.8)#941 |
| 52. | Fort Irwin | 22.4% | 4.7%(+17.7)#52 | 4.7%(+17.7)#951 |
| 53. | Klamath | 22.3% | 4.7%(+17.6)#53 | 4.7%(+17.6)#953 |
| 54. | Westwood | 22.3% | 4.7%(+17.6)#54 | 4.7%(+17.6)#958 |
| 55. | Vandenberg Afb | 22.2% | 4.7%(+17.5)#55 | 4.7%(+17.5)#972 |
| 56. | Independence | 21.8% | 4.7%(+17.1)#56 | 4.7%(+17.1)#995 |
| 57. | Greenville | 21.5% | 4.7%(+16.8)#57 | 4.7%(+16.8)#1,019 |
| 58. | West Bishop | 21.3% | 4.7%(+16.6)#58 | 4.7%(+16.6)#1,045 |
| 59. | Mesa Verde | 20.9% | 4.7%(+16.2)#59 | 4.7%(+16.2)#1,093 |
| 60. | Lake California | 20.6% | 4.7%(+15.9)#60 | 4.7%(+15.9)#1,123 |
| 61. | Mariposa | 20.3% | 4.7%(+15.6)#61 | 4.7%(+15.6)#1,154 |
| 62. | Cedarville | 20.0% | 4.7%(+15.3)#62 | 4.7%(+15.3)#1,178 |
| 63. | Herald | 19.7% | 4.7%(+15.0)#63 | 4.7%(+15.0)#1,241 |
| 64. | Patton Village | 19.7% | 4.7%(+15.0)#64 | 4.7%(+15.0)#1,242 |
| 65. | Happy Camp | 19.5% | 4.7%(+14.8)#65 | 4.7%(+14.8)#1,271 |
| 66. | Bishop | 19.4% | 4.7%(+14.7)#66 | 4.7%(+14.7)#1,280 |
| 67. | Ridgecrest Heights | 19.0% | 4.7%(+14.4)#67 | 4.7%(+14.4)#1,324 |
| 68. | Loma Rica | 18.8% | 4.7%(+14.1)#68 | 4.7%(+14.1)#1,363 |
| 69. | Keene | 18.6% | 4.7%(+13.9)#69 | 4.7%(+13.9)#1,389 |
| 70. | Silver Lakes | 18.2% | 4.7%(+13.5)#70 | 4.7%(+13.5)#1,441 |
| 71. | Knights Ferry | 18.2% | 4.7%(+13.5)#71 | 4.7%(+13.5)#1,457 |
| 72. | California City | 18.1% | 4.7%(+13.4)#72 | 4.7%(+13.4)#1,472 |
| 73. | Shelter Cove | 18.0% | 4.7%(+13.4)#73 | 4.7%(+13.4)#1,479 |
| 74. | Ducor | 17.9% | 4.7%(+13.2)#74 | 4.7%(+13.2)#1,502 |
| 75. | Artois | 17.9% | 4.7%(+13.2)#75 | 4.7%(+13.2)#1,508 |
| 76. | Blythe | 17.7% | 4.7%(+13.0)#76 | 4.7%(+13.0)#1,530 |
| 77. | Homewood Canyon | 17.4% | 4.7%(+12.7)#77 | 4.7%(+12.7)#1,585 |
| 78. | Loyalton | 17.2% | 4.7%(+12.5)#78 | 4.7%(+12.5)#1,624 |
| 79. | Wilkerson | 17.2% | 4.7%(+12.5)#79 | 4.7%(+12.5)#1,625 |
| 80. | Wilton | 17.2% | 4.7%(+12.5)#80 | 4.7%(+12.5)#1,636 |
| 81. | Hamilton Branch | 17.1% | 4.7%(+12.4)#81 | 4.7%(+12.4)#1,657 |
| 82. | Bertsch Oceanview | 16.9% | 4.7%(+12.2)#82 | 4.7%(+12.2)#1,686 |
| 83. | Penryn | 16.8% | 4.7%(+12.1)#83 | 4.7%(+12.1)#1,699 |
| 84. | Camptonville | 16.7% | 4.7%(+12.0)#84 | 4.7%(+12.0)#1,724 |
| 85. | Weitchpec | 16.7% | 4.7%(+12.0)#85 | 4.7%(+12.0)#1,731 |
| 86. | Pine Valley | 16.6% | 4.7%(+11.9)#86 | 4.7%(+11.9)#1,745 |
| 87. | French Gulch | 16.5% | 4.7%(+11.8)#87 | 4.7%(+11.8)#1,762 |
| 88. | Ione | 16.2% | 4.7%(+11.5)#88 | 4.7%(+11.5)#1,817 |
| 89. | Auberry | 16.0% | 4.7%(+11.3)#89 | 4.7%(+11.3)#1,857 |
| 90. | Los Molinos | 15.9% | 4.7%(+11.2)#90 | 4.7%(+11.2)#1,886 |
| 91. | Brawley | 15.7% | 4.7%(+11.0)#91 | 4.7%(+11.0)#1,945 |
| 92. | Brooktrails | 15.5% | 4.7%(+10.9)#92 | 4.7%(+10.9)#1,975 |
| 93. | Vineyard | 15.4% | 4.7%(+10.7)#93 | 4.7%(+10.7)#2,025 |
| 94. | West Park | 15.3% | 4.7%(+10.6)#94 | 4.7%(+10.6)#2,042 |
| 95. | Lake Don Pedro | 14.9% | 4.7%(+10.3)#95 | 4.7%(+10.3)#2,143 |
| 96. | Blue Lake | 14.9% | 4.7%(+10.2)#96 | 4.7%(+10.2)#2,150 |
| 97. | Lemoore | 14.9% | 4.7%(+10.2)#97 | 4.7%(+10.2)#2,160 |
| 98. | Rosemont | 14.9% | 4.7%(+10.2)#98 | 4.7%(+10.2)#2,162 |
| 99. | Gold River | 14.8% | 4.7%(+10.1)#99 | 4.7%(+10.1)#2,172 |
| 100. | Hanford | 14.8% | 4.7%(+10.1)#100 | 4.7%(+10.1)#2,173 |
Common Questions
What are the Top 10 Cities with the Highest Percentage of Population Employed in Public Administration in California?
Top 10 Cities with the Highest Percentage of Population Employed in Public Administration in California are:
#1
100.0%
#2
100.0%
#3
100.0%
#4
77.4%
#5
70.0%
#6
61.2%
#7
50.0%
#8
50.0%
#9
49.3%
#10
47.0%
What city has the Highest Percentage of Population Employed in Public Administration in California?
Iron Horse has the Highest Percentage of Population Employed in Public Administration in California with 100.0%.
What is the Percentage of Population Employed in Public Administration in the State of California?
Percentage of Population Employed in Public Administration in California is 4.7%.
What is the Percentage of Population Employed in Public Administration in the United States?
Percentage of Population Employed in Public Administration in the United States is 4.7%.