Bertsch Oceanview, CA Map & Demographics
Bertsch Oceanview Map
Bertsch Oceanview Overview
$29,875
PER CAPITA INCOME
$82,000
AVG FAMILY INCOME
$67,250
AVG HOUSEHOLD INCOME
0.34
INEQUALITY / GINI INDEX
2,222
TOTAL POPULATION
1,105
MALE POPULATION
1,117
FEMALE POPULATION
98.93
MALES / 100 FEMALES
101.09
FEMALES / 100 MALES
39.8
MEDIAN AGE
3.1
AVG FAMILY SIZE
2.7
AVG HOUSEHOLD SIZE
1,092
LABOR FORCE [ PEOPLE ]
64.6%
PERCENT IN LABOR FORCE
5.0%
UNEMPLOYMENT RATE
Income in Bertsch Oceanview
Income Overview in Bertsch Oceanview
Per Capita Income in Bertsch Oceanview is $29,875, while median incomes of families and households are $82,000 and $67,250 respectively.
| Characteristic | Number | Measure |
| Per Capita Income | 2,222 | $29,875 |
| Median Family Income | 584 | $82,000 |
| Mean Family Income | 584 | $84,786 |
| Median Household Income | 827 | $67,250 |
| Mean Household Income | 827 | $76,945 |
| Income Deficit | 584 | $0 |
| Wage / Income Gap (%) | 2,222 | 0.00% |
| Wage / Income Gap ($) | 2,222 | 100.00¢ per $1 |
| Gini / Inequality Index | 2,222 | 0.34 |
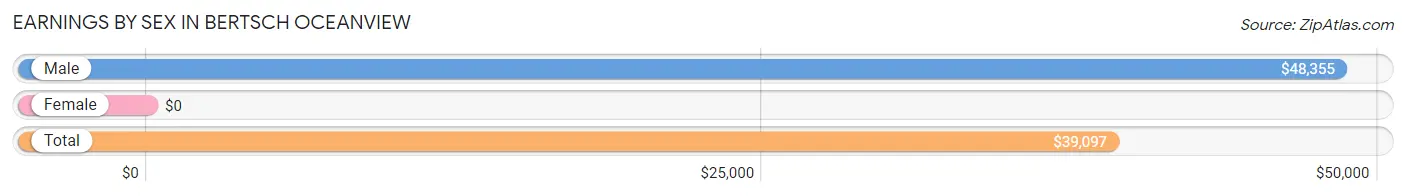
Earnings by Sex in Bertsch Oceanview
| Sex | Number | Average Earnings |
| Male | 548 (49.0%) | $48,355 |
| Female | 571 (51.0%) | $0 |
| Total | 1,119 (100.0%) | $39,097 |
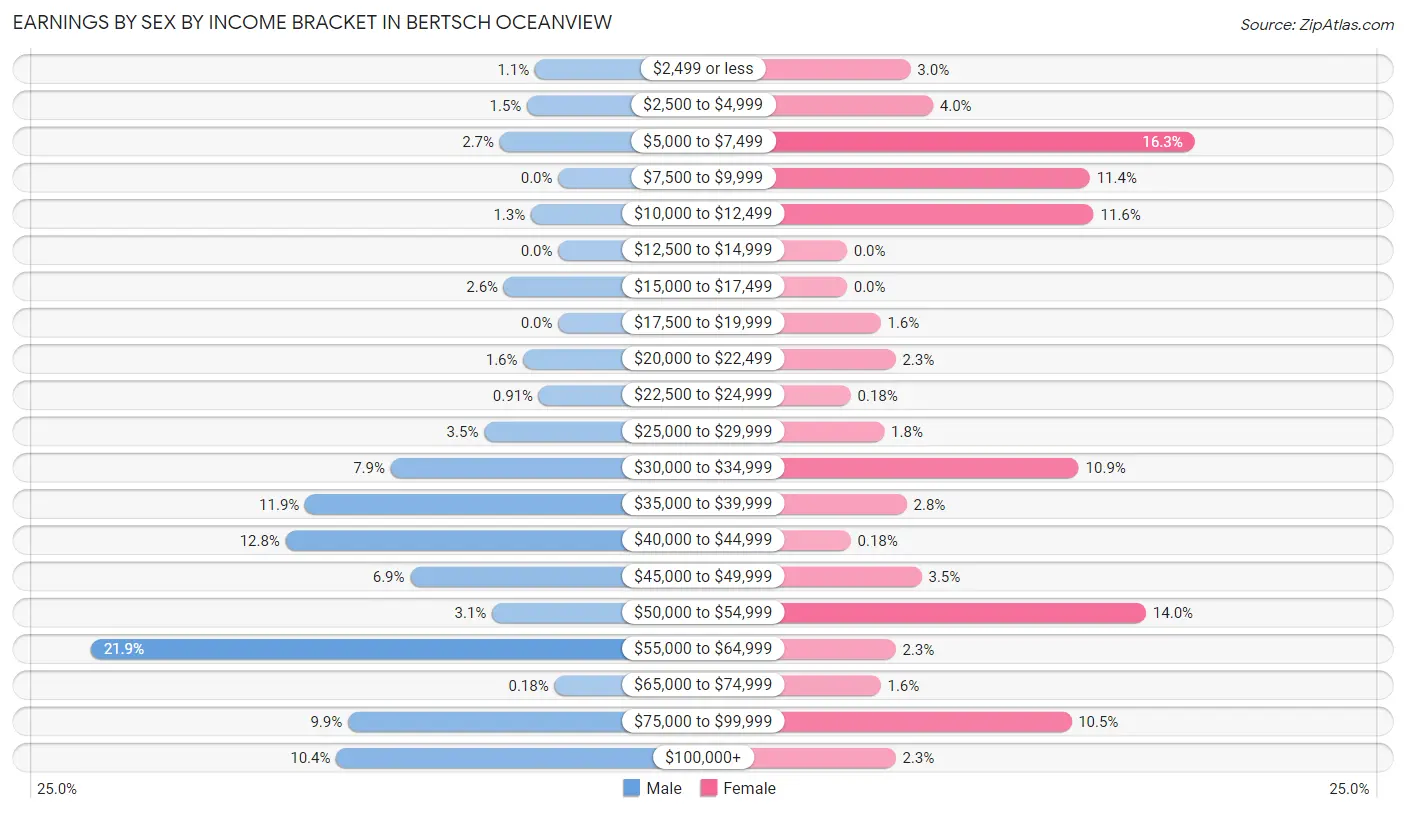
Earnings by Sex by Income Bracket in Bertsch Oceanview
The most common earnings brackets in Bertsch Oceanview are $55,000 to $64,999 for men (120 | 21.9%) and $5,000 to $7,499 for women (93 | 16.3%).
| Income | Male | Female |
| $2,499 or less | 6 (1.1%) | 17 (3.0%) |
| $2,500 to $4,999 | 8 (1.5%) | 23 (4.0%) |
| $5,000 to $7,499 | 15 (2.7%) | 93 (16.3%) |
| $7,500 to $9,999 | 0 (0.0%) | 65 (11.4%) |
| $10,000 to $12,499 | 7 (1.3%) | 66 (11.6%) |
| $12,500 to $14,999 | 0 (0.0%) | 0 (0.0%) |
| $15,000 to $17,499 | 14 (2.5%) | 0 (0.0%) |
| $17,500 to $19,999 | 0 (0.0%) | 9 (1.6%) |
| $20,000 to $22,499 | 9 (1.6%) | 13 (2.3%) |
| $22,500 to $24,999 | 5 (0.9%) | 1 (0.2%) |
| $25,000 to $29,999 | 19 (3.5%) | 10 (1.8%) |
| $30,000 to $34,999 | 43 (7.9%) | 62 (10.9%) |
| $35,000 to $39,999 | 65 (11.9%) | 16 (2.8%) |
| $40,000 to $44,999 | 70 (12.8%) | 1 (0.2%) |
| $45,000 to $49,999 | 38 (6.9%) | 20 (3.5%) |
| $50,000 to $54,999 | 17 (3.1%) | 80 (14.0%) |
| $55,000 to $64,999 | 120 (21.9%) | 13 (2.3%) |
| $65,000 to $74,999 | 1 (0.2%) | 9 (1.6%) |
| $75,000 to $99,999 | 54 (9.9%) | 60 (10.5%) |
| $100,000+ | 57 (10.4%) | 13 (2.3%) |
| Total | 548 (100.0%) | 571 (100.0%) |
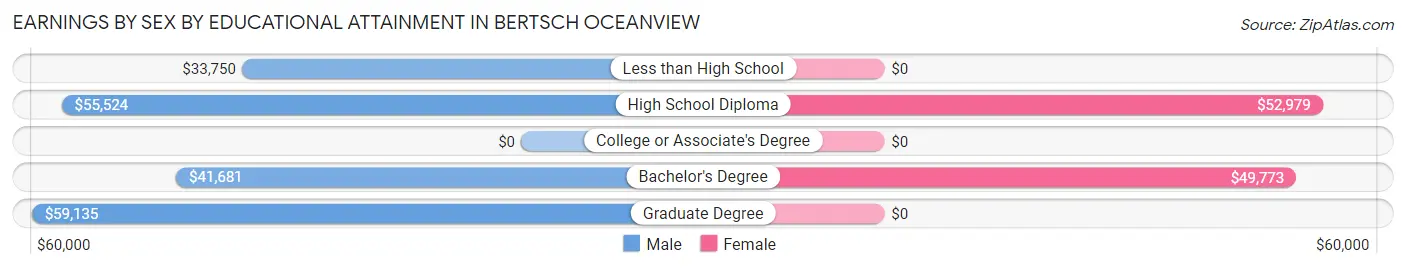
Earnings by Sex by Educational Attainment in Bertsch Oceanview
Average earnings in Bertsch Oceanview are $48,980 for men and $46,111 for women, a difference of 5.9%. Men with an educational attainment of graduate degree enjoy the highest average annual earnings of $59,135, while those with less than high school education earn the least with $33,750. Women with an educational attainment of high school diploma earn the most with the average annual earnings of $52,979, while those with bachelor's degree education have the smallest earnings of $49,773.
| Educational Attainment | Male Income | Female Income |
| Less than High School | $33,750 | $0 |
| High School Diploma | $55,524 | $52,979 |
| College or Associate's Degree | - | - |
| Bachelor's Degree | $41,681 | $49,773 |
| Graduate Degree | $59,135 | $0 |
| Total | $48,980 | $46,111 |
Family Income in Bertsch Oceanview
Family Income Brackets in Bertsch Oceanview
According to the Bertsch Oceanview family income data, there are 196 families falling into the $75,000 to $99,999 income range, which is the most common income bracket and makes up 33.6% of all families.
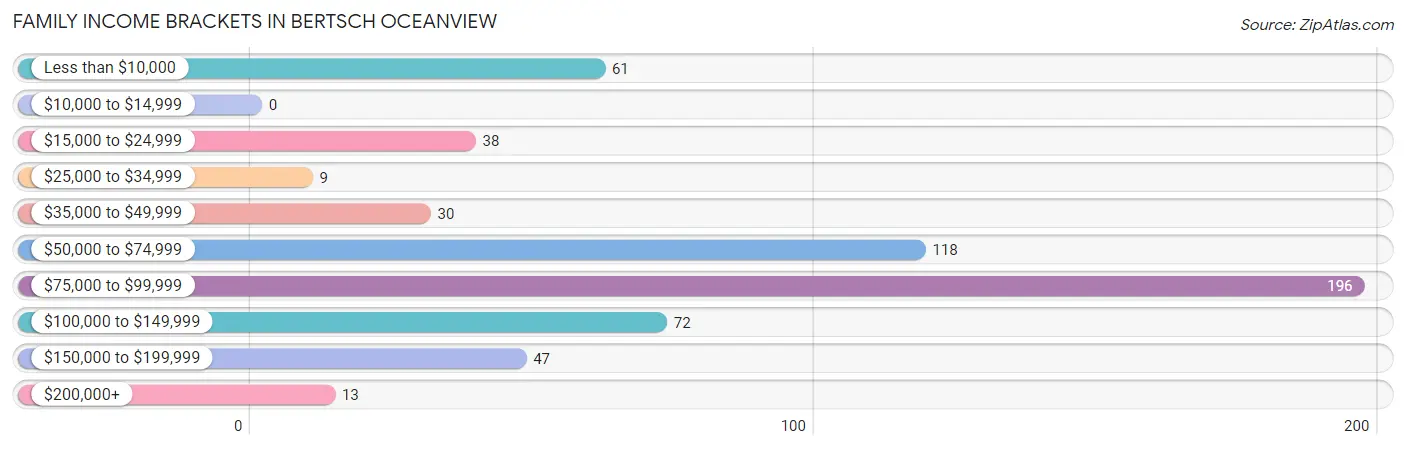
| Income Bracket | # Families | % Families |
| Less than $10,000 | 61 | 10.4% |
| $10,000 to $14,999 | 0 | 0.0% |
| $15,000 to $24,999 | 38 | 6.5% |
| $25,000 to $34,999 | 9 | 1.5% |
| $35,000 to $49,999 | 30 | 5.1% |
| $50,000 to $74,999 | 118 | 20.2% |
| $75,000 to $99,999 | 196 | 33.6% |
| $100,000 to $149,999 | 72 | 12.3% |
| $150,000 to $199,999 | 47 | 8.0% |
| $200,000+ | 13 | 2.2% |
Family Income by Famaliy Size in Bertsch Oceanview
5-person families (104 | 17.8%) account for the highest median family income in Bertsch Oceanview with $96,062 per family, while 3-person families (176 | 30.1%) have the highest median income of $28,763 per family member.
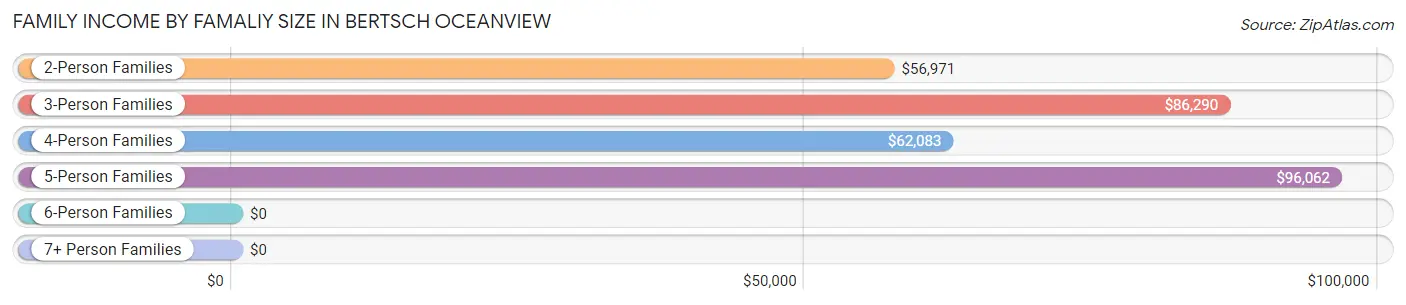
| Income Bracket | # Families | Median Income |
| 2-Person Families | 253 (43.3%) | $56,971 |
| 3-Person Families | 176 (30.1%) | $86,290 |
| 4-Person Families | 49 (8.4%) | $62,083 |
| 5-Person Families | 104 (17.8%) | $96,062 |
| 6-Person Families | 0 (0.0%) | $0 |
| 7+ Person Families | 2 (0.3%) | $0 |
| Total | 584 (100.0%) | $82,000 |
Family Income by Number of Earners in Bertsch Oceanview
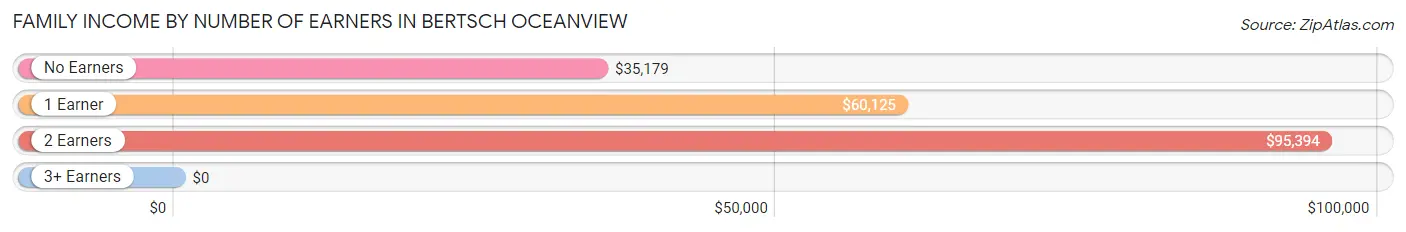
| Number of Earners | # Families | Median Income |
| No Earners | 51 (8.7%) | $35,179 |
| 1 Earner | 241 (41.3%) | $60,125 |
| 2 Earners | 275 (47.1%) | $95,394 |
| 3+ Earners | 17 (2.9%) | $0 |
| Total | 584 (100.0%) | $82,000 |
Household Income in Bertsch Oceanview
Household Income Brackets in Bertsch Oceanview
With 211 households falling in the category, the $75,000 to $99,999 income range is the most frequent in Bertsch Oceanview, accounting for 25.5% of all households. In contrast, only 2 households (0.2%) fall into the less than $10,000 income bracket, making it the least populous group.
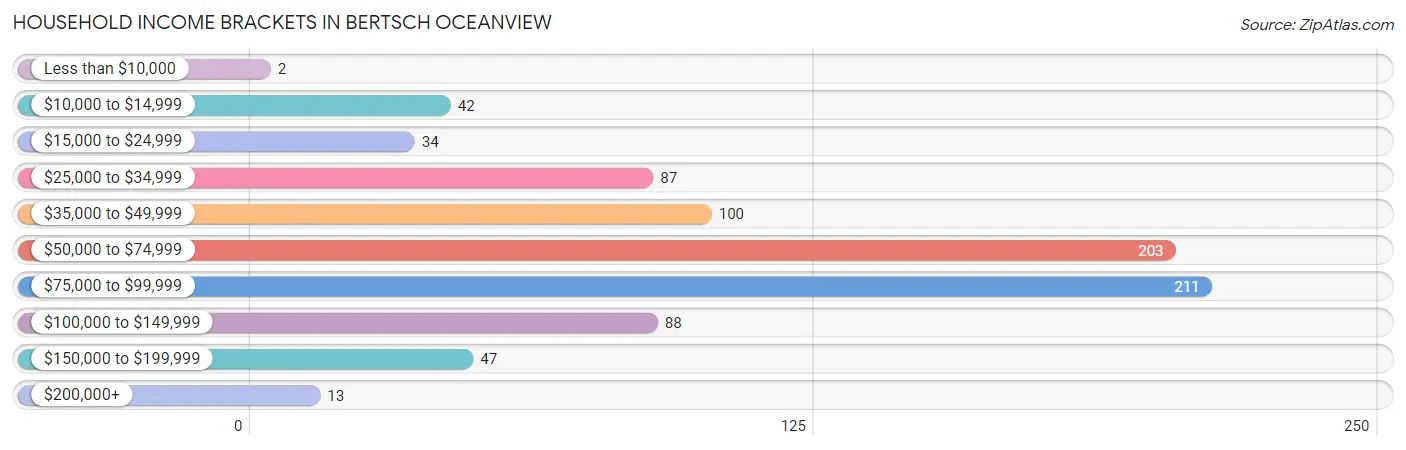
| Income Bracket | # Households | % Households |
| Less than $10,000 | 2 | 0.2% |
| $10,000 to $14,999 | 42 | 5.1% |
| $15,000 to $24,999 | 34 | 4.1% |
| $25,000 to $34,999 | 87 | 10.5% |
| $35,000 to $49,999 | 100 | 12.1% |
| $50,000 to $74,999 | 203 | 24.5% |
| $75,000 to $99,999 | 211 | 25.5% |
| $100,000 to $149,999 | 88 | 10.6% |
| $150,000 to $199,999 | 47 | 5.7% |
| $200,000+ | 13 | 1.6% |
Household Income by Householder Age in Bertsch Oceanview
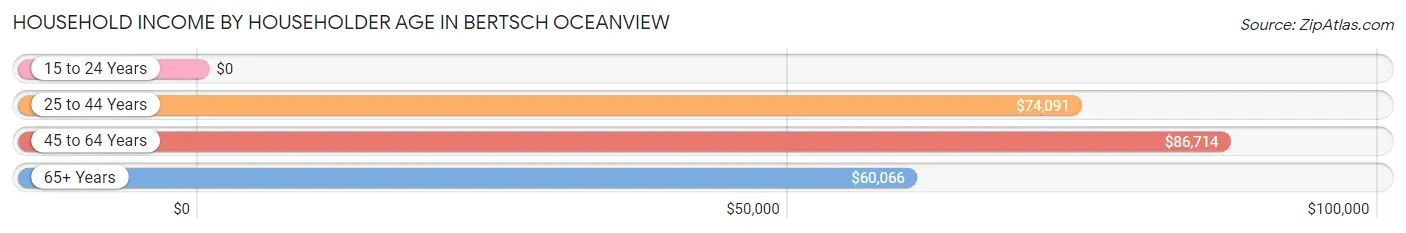
The median household income in Bertsch Oceanview is $67,250, with the highest median household income of $86,714 found in the 45 to 64 years age bracket for the primary householder. A total of 325 households (39.3%) fall into this category. Meanwhile, the 15 to 24 years age bracket for the primary householder has the lowest median household income of $0, with 63 households (7.6%) in this group.
| Income Bracket | # Households | Median Income |
| 15 to 24 Years | 63 (7.6%) | $0 |
| 25 to 44 Years | 150 (18.1%) | $74,091 |
| 45 to 64 Years | 325 (39.3%) | $86,714 |
| 65+ Years | 289 (34.9%) | $60,066 |
| Total | 827 (100.0%) | $67,250 |
Poverty in Bertsch Oceanview
Income Below Poverty by Sex and Age in Bertsch Oceanview
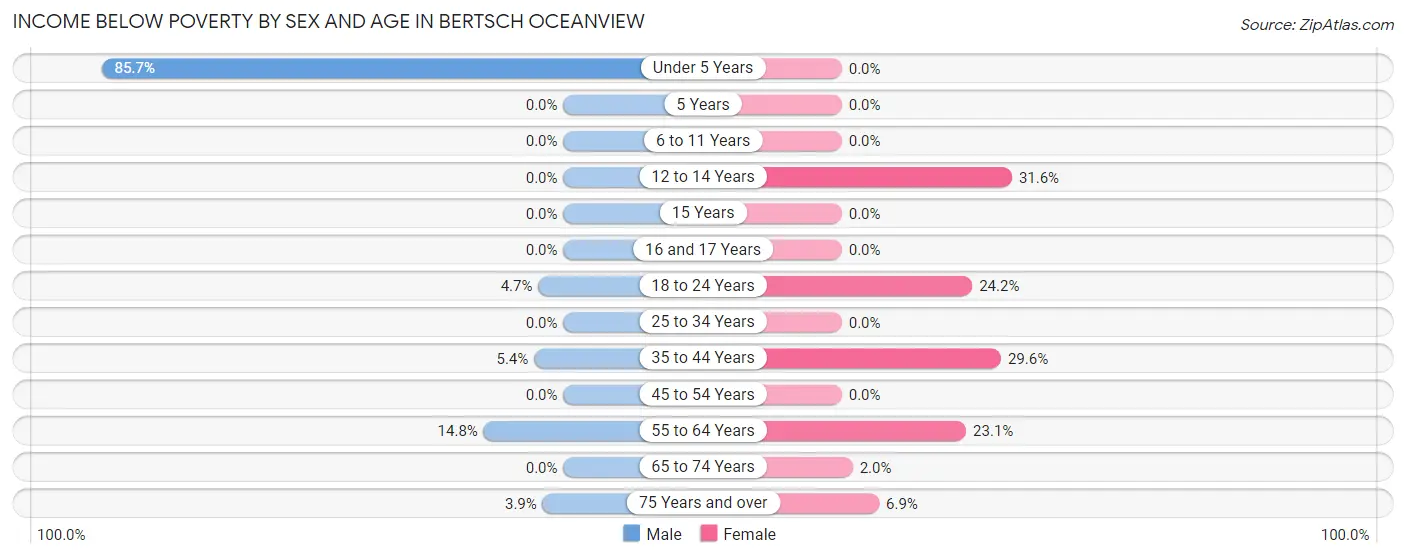
With 8.6% poverty level for males and 10.5% for females among the residents of Bertsch Oceanview, under 5 year old males and 12 to 14 year old females are the most vulnerable to poverty, with 60 males (85.7%) and 12 females (31.6%) in their respective age groups living below the poverty level.
| Age Bracket | Male | Female |
| Under 5 Years | 60 (85.7%) | 0 (0.0%) |
| 5 Years | 0 (0.0%) | 0 (0.0%) |
| 6 to 11 Years | 0 (0.0%) | 0 (0.0%) |
| 12 to 14 Years | 0 (0.0%) | 12 (31.6%) |
| 15 Years | 0 (0.0%) | 0 (0.0%) |
| 16 and 17 Years | 0 (0.0%) | 0 (0.0%) |
| 18 to 24 Years | 2 (4.6%) | 61 (24.2%) |
| 25 to 34 Years | 0 (0.0%) | 0 (0.0%) |
| 35 to 44 Years | 7 (5.4%) | 13 (29.5%) |
| 45 to 54 Years | 0 (0.0%) | 0 (0.0%) |
| 55 to 64 Years | 21 (14.8%) | 21 (23.1%) |
| 65 to 74 Years | 0 (0.0%) | 3 (2.0%) |
| 75 Years and over | 3 (3.8%) | 7 (6.9%) |
| Total | 93 (8.6%) | 117 (10.5%) |
Income Above Poverty by Sex and Age in Bertsch Oceanview
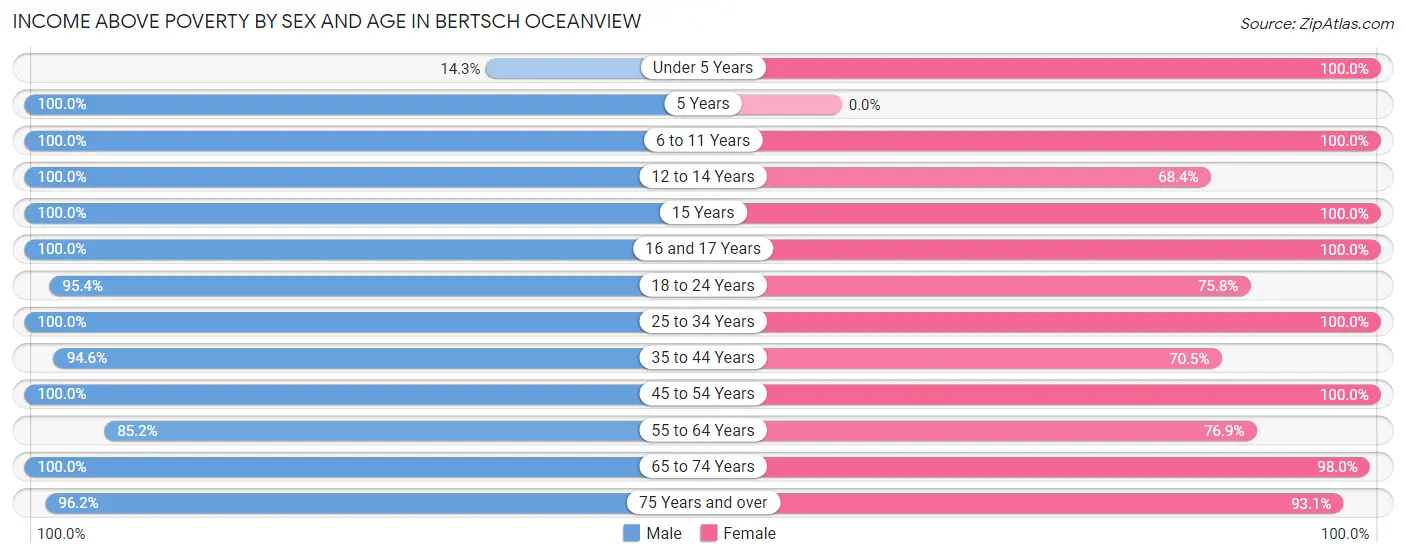
According to the poverty statistics in Bertsch Oceanview, males aged 5 years and females aged under 5 years are the age groups that are most secure financially, with 100.0% of males and 100.0% of females in these age groups living above the poverty line.
| Age Bracket | Male | Female |
| Under 5 Years | 10 (14.3%) | 67 (100.0%) |
| 5 Years | 20 (100.0%) | 0 (0.0%) |
| 6 to 11 Years | 56 (100.0%) | 71 (100.0%) |
| 12 to 14 Years | 152 (100.0%) | 26 (68.4%) |
| 15 Years | 11 (100.0%) | 28 (100.0%) |
| 16 and 17 Years | 1 (100.0%) | 28 (100.0%) |
| 18 to 24 Years | 41 (95.4%) | 191 (75.8%) |
| 25 to 34 Years | 94 (100.0%) | 98 (100.0%) |
| 35 to 44 Years | 122 (94.6%) | 31 (70.5%) |
| 45 to 54 Years | 167 (100.0%) | 151 (100.0%) |
| 55 to 64 Years | 121 (85.2%) | 70 (76.9%) |
| 65 to 74 Years | 124 (100.0%) | 145 (98.0%) |
| 75 Years and over | 75 (96.2%) | 94 (93.1%) |
| Total | 994 (91.4%) | 1,000 (89.5%) |
Income Below Poverty Among Married-Couple Families in Bertsch Oceanview
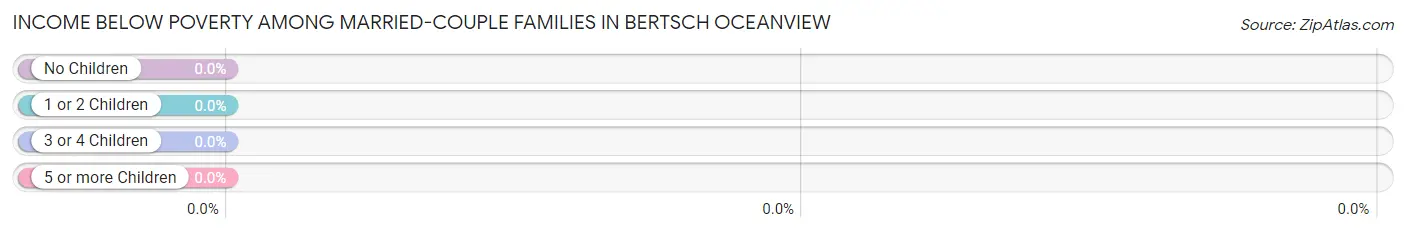
| Children | Above Poverty | Below Poverty |
| No Children | 171 (100.0%) | 0 (0.0%) |
| 1 or 2 Children | 109 (100.0%) | 0 (0.0%) |
| 3 or 4 Children | 21 (100.0%) | 0 (0.0%) |
| 5 or more Children | 2 (100.0%) | 0 (0.0%) |
| Total | 303 (100.0%) | 0 (0.0%) |
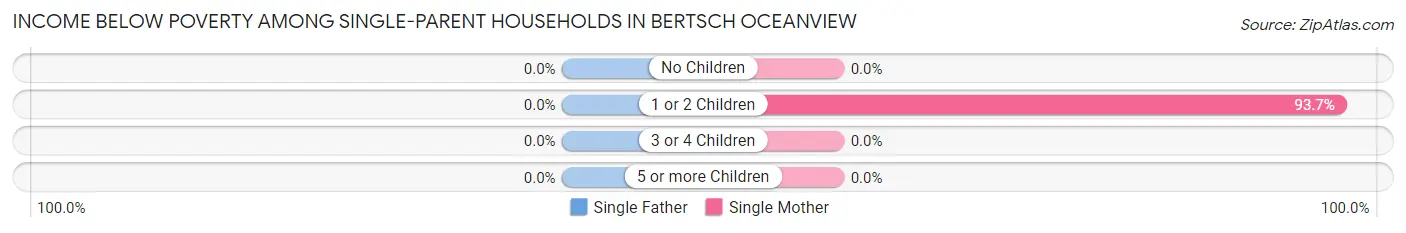
Income Below Poverty Among Single-Parent Households in Bertsch Oceanview
| Children | Single Father | Single Mother |
| No Children | 0 (0.0%) | 0 (0.0%) |
| 1 or 2 Children | 0 (0.0%) | 74 (93.7%) |
| 3 or 4 Children | 0 (0.0%) | 0 (0.0%) |
| 5 or more Children | 0 (0.0%) | 0 (0.0%) |
| Total | 0 (0.0%) | 74 (59.2%) |
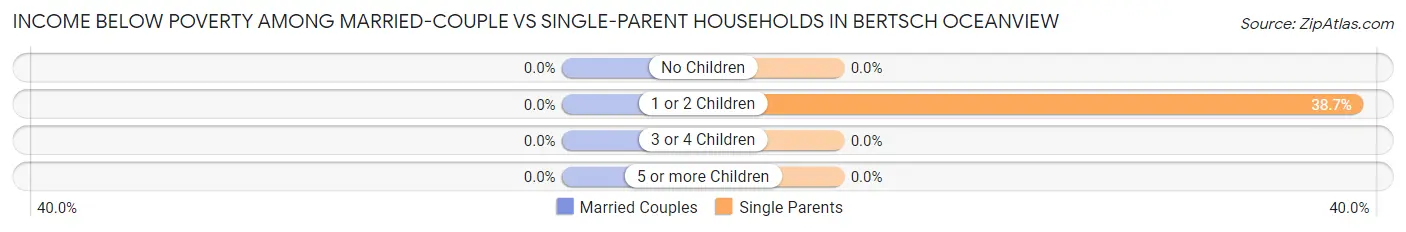
Income Below Poverty Among Married-Couple vs Single-Parent Households in Bertsch Oceanview
| Children | Married-Couple Families | Single-Parent Households |
| No Children | 0 (0.0%) | 0 (0.0%) |
| 1 or 2 Children | 0 (0.0%) | 74 (38.7%) |
| 3 or 4 Children | 0 (0.0%) | 0 (0.0%) |
| 5 or more Children | 0 (0.0%) | 0 (0.0%) |
| Total | 0 (0.0%) | 74 (26.3%) |
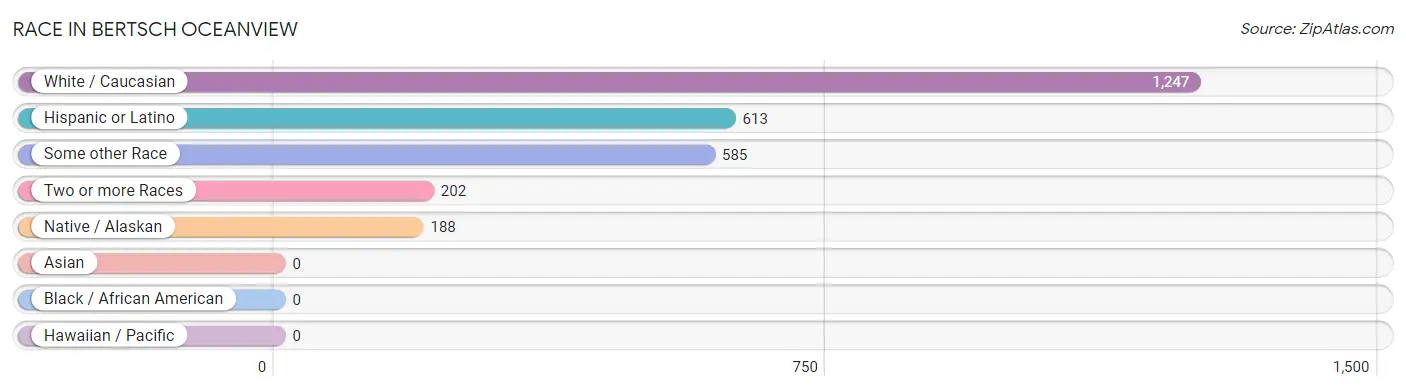
Race in Bertsch Oceanview
The most populous races in Bertsch Oceanview are White / Caucasian (1,247 | 56.1%), Hispanic or Latino (613 | 27.6%), and Some other Race (585 | 26.3%).
| Race | # Population | % Population |
| Asian | 0 | 0.0% |
| Black / African American | 0 | 0.0% |
| Hawaiian / Pacific | 0 | 0.0% |
| Hispanic or Latino | 613 | 27.6% |
| Native / Alaskan | 188 | 8.5% |
| White / Caucasian | 1,247 | 56.1% |
| Two or more Races | 202 | 9.1% |
| Some other Race | 585 | 26.3% |
| Total | 2,222 | 100.0% |
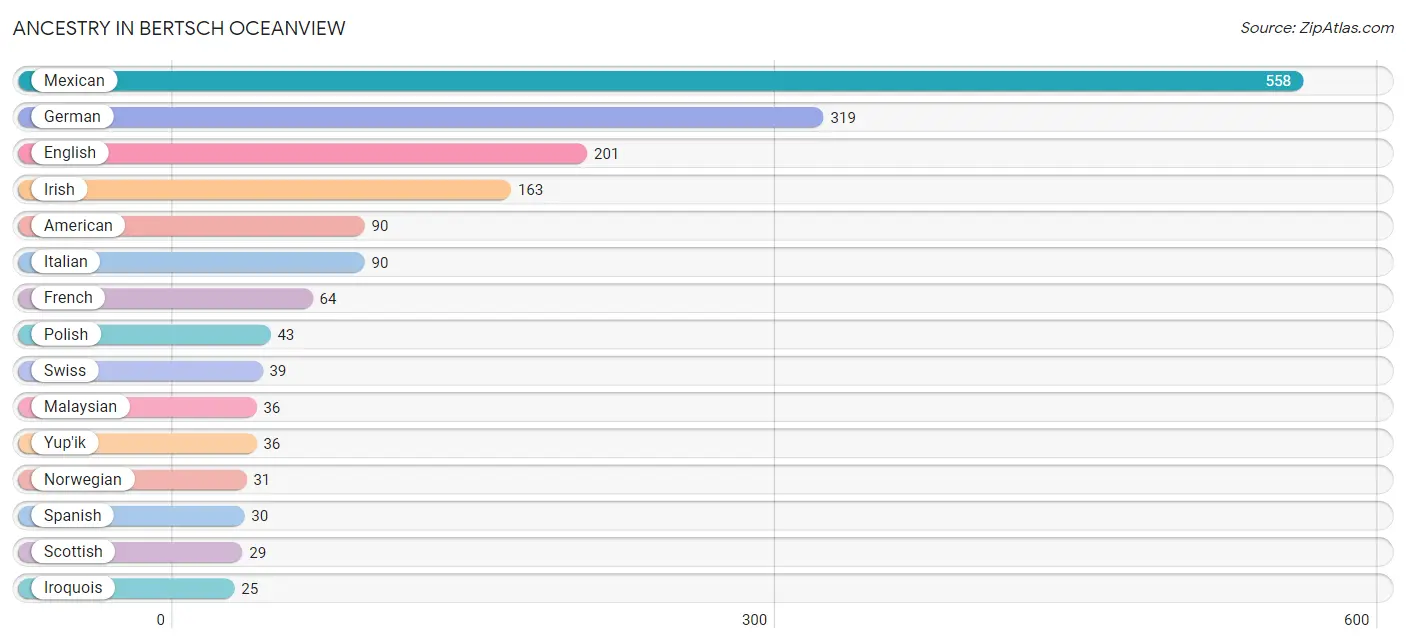
Ancestry in Bertsch Oceanview
The most populous ancestries reported in Bertsch Oceanview are Mexican (558 | 25.1%), German (319 | 14.4%), English (201 | 9.0%), Irish (163 | 7.3%), and American (90 | 4.1%), together accounting for 59.9% of all Bertsch Oceanview residents.
| Ancestry | # Population | % Population |
| American | 90 | 4.1% |
| Central American Indian | 5 | 0.2% |
| Czech | 19 | 0.9% |
| Dutch | 24 | 1.1% |
| English | 201 | 9.0% |
| European | 9 | 0.4% |
| French | 64 | 2.9% |
| French Canadian | 17 | 0.8% |
| German | 319 | 14.4% |
| Irish | 163 | 7.3% |
| Iroquois | 25 | 1.1% |
| Italian | 90 | 4.1% |
| Malaysian | 36 | 1.6% |
| Mexican | 558 | 25.1% |
| Norwegian | 31 | 1.4% |
| Polish | 43 | 1.9% |
| Portuguese | 7 | 0.3% |
| Puerto Rican | 14 | 0.6% |
| Samoan | 13 | 0.6% |
| Scandinavian | 10 | 0.4% |
| Scottish | 29 | 1.3% |
| Spanish | 30 | 1.3% |
| Swedish | 10 | 0.4% |
| Swiss | 39 | 1.8% |
| Ukrainian | 13 | 0.6% |
| Yup'ik | 36 | 1.6% | View All 26 Rows |
Immigrants in Bertsch Oceanview
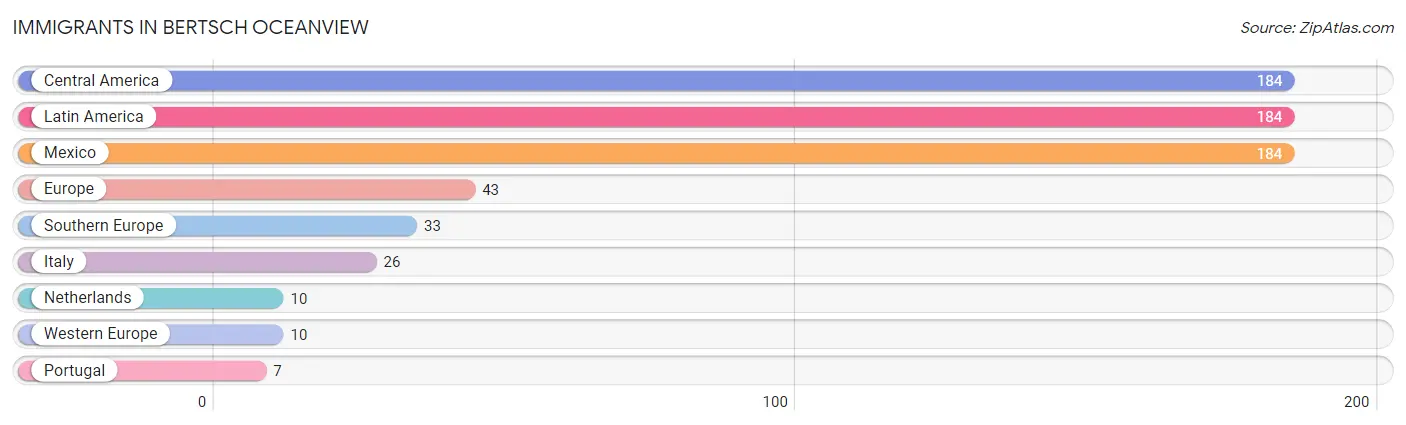
The most numerous immigrant groups reported in Bertsch Oceanview came from Central America (184 | 8.3%), Latin America (184 | 8.3%), Mexico (184 | 8.3%), Europe (43 | 1.9%), and Southern Europe (33 | 1.5%), together accounting for 28.3% of all Bertsch Oceanview residents.
| Immigration Origin | # Population | % Population |
| Central America | 184 | 8.3% |
| Europe | 43 | 1.9% |
| Italy | 26 | 1.2% |
| Latin America | 184 | 8.3% |
| Mexico | 184 | 8.3% |
| Netherlands | 10 | 0.4% |
| Portugal | 7 | 0.3% |
| Southern Europe | 33 | 1.5% |
| Western Europe | 10 | 0.4% | View All 9 Rows |
Sex and Age in Bertsch Oceanview
Sex and Age in Bertsch Oceanview
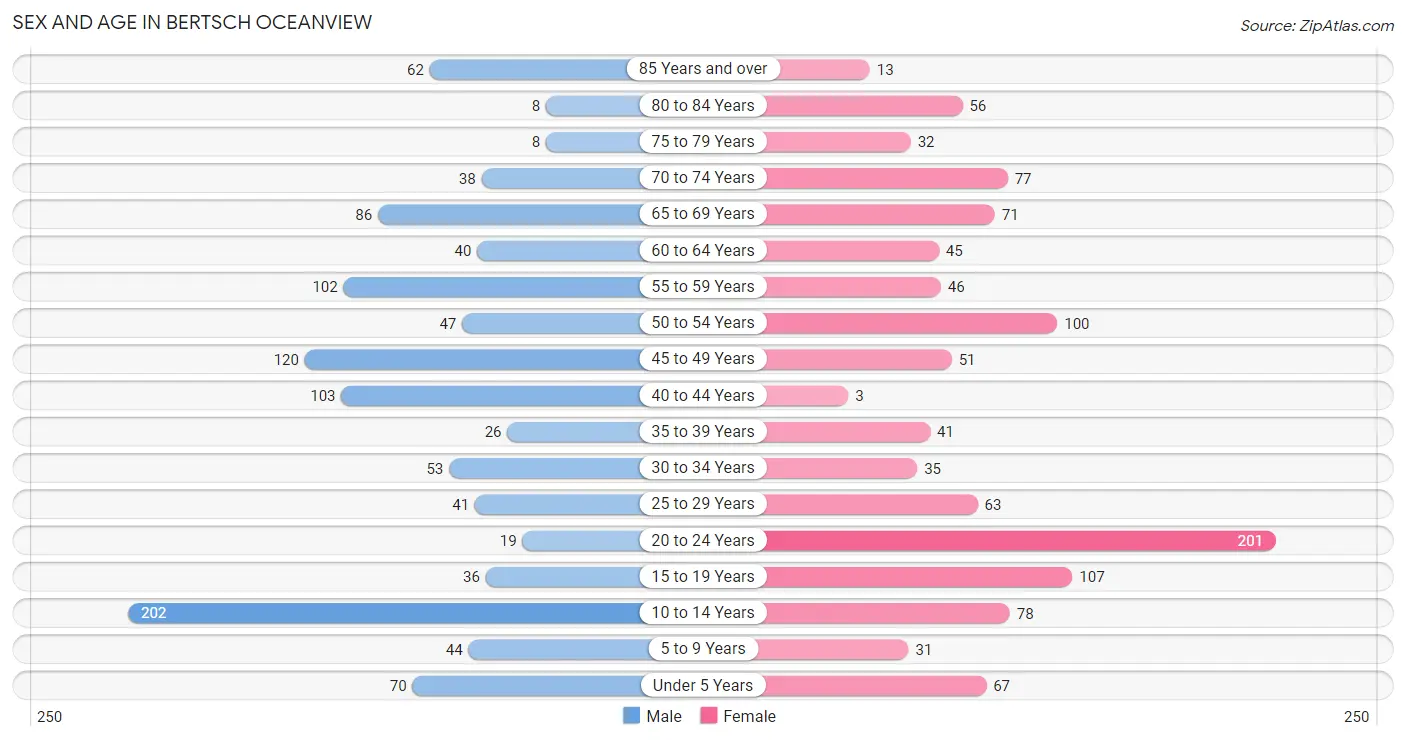
The most populous age groups in Bertsch Oceanview are 10 to 14 Years (202 | 18.3%) for men and 20 to 24 Years (201 | 18.0%) for women.
| Age Bracket | Male | Female |
| Under 5 Years | 70 (6.3%) | 67 (6.0%) |
| 5 to 9 Years | 44 (4.0%) | 31 (2.8%) |
| 10 to 14 Years | 202 (18.3%) | 78 (7.0%) |
| 15 to 19 Years | 36 (3.3%) | 107 (9.6%) |
| 20 to 24 Years | 19 (1.7%) | 201 (18.0%) |
| 25 to 29 Years | 41 (3.7%) | 63 (5.6%) |
| 30 to 34 Years | 53 (4.8%) | 35 (3.1%) |
| 35 to 39 Years | 26 (2.4%) | 41 (3.7%) |
| 40 to 44 Years | 103 (9.3%) | 3 (0.3%) |
| 45 to 49 Years | 120 (10.9%) | 51 (4.6%) |
| 50 to 54 Years | 47 (4.3%) | 100 (8.9%) |
| 55 to 59 Years | 102 (9.2%) | 46 (4.1%) |
| 60 to 64 Years | 40 (3.6%) | 45 (4.0%) |
| 65 to 69 Years | 86 (7.8%) | 71 (6.4%) |
| 70 to 74 Years | 38 (3.4%) | 77 (6.9%) |
| 75 to 79 Years | 8 (0.7%) | 32 (2.9%) |
| 80 to 84 Years | 8 (0.7%) | 56 (5.0%) |
| 85 Years and over | 62 (5.6%) | 13 (1.2%) |
| Total | 1,105 (100.0%) | 1,117 (100.0%) |
Families and Households in Bertsch Oceanview
Median Family Size in Bertsch Oceanview
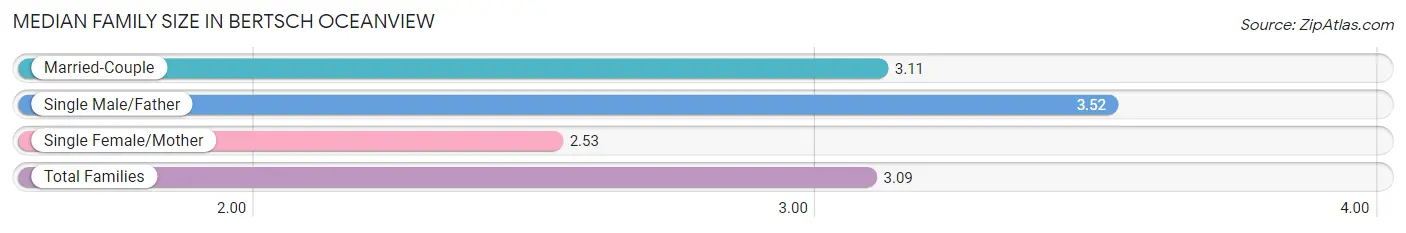
The median family size in Bertsch Oceanview is 3.09 persons per family, with single male/father families (156 | 26.7%) accounting for the largest median family size of 3.52 persons per family. On the other hand, single female/mother families (125 | 21.4%) represent the smallest median family size with 2.53 persons per family.
| Family Type | # Families | Family Size |
| Married-Couple | 303 (51.9%) | 3.11 |
| Single Male/Father | 156 (26.7%) | 3.52 |
| Single Female/Mother | 125 (21.4%) | 2.53 |
| Total Families | 584 (100.0%) | 3.09 |
Median Household Size in Bertsch Oceanview
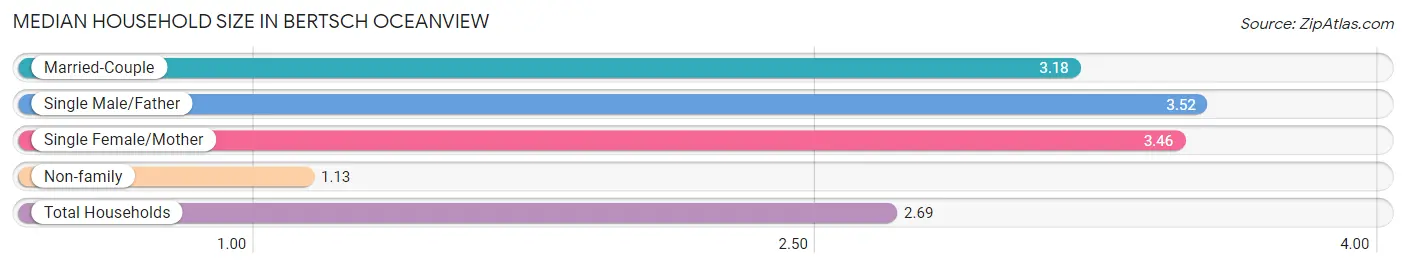
The median household size in Bertsch Oceanview is 2.69 persons per household, with single male/father households (156 | 18.9%) accounting for the largest median household size of 3.52 persons per household. non-family households (243 | 29.4%) represent the smallest median household size with 1.13 persons per household.
| Household Type | # Households | Household Size |
| Married-Couple | 303 (36.6%) | 3.18 |
| Single Male/Father | 156 (18.9%) | 3.52 |
| Single Female/Mother | 125 (15.1%) | 3.46 |
| Non-family | 243 (29.4%) | 1.13 |
| Total Households | 827 (100.0%) | 2.69 |
Household Size by Marriage Status in Bertsch Oceanview
Out of a total of 827 households in Bertsch Oceanview, 584 (70.6%) are family households, while 243 (29.4%) are nonfamily households. The most numerous type of family households are 3-person households, comprising 229, and the most common type of nonfamily households are 1-person households, comprising 217.
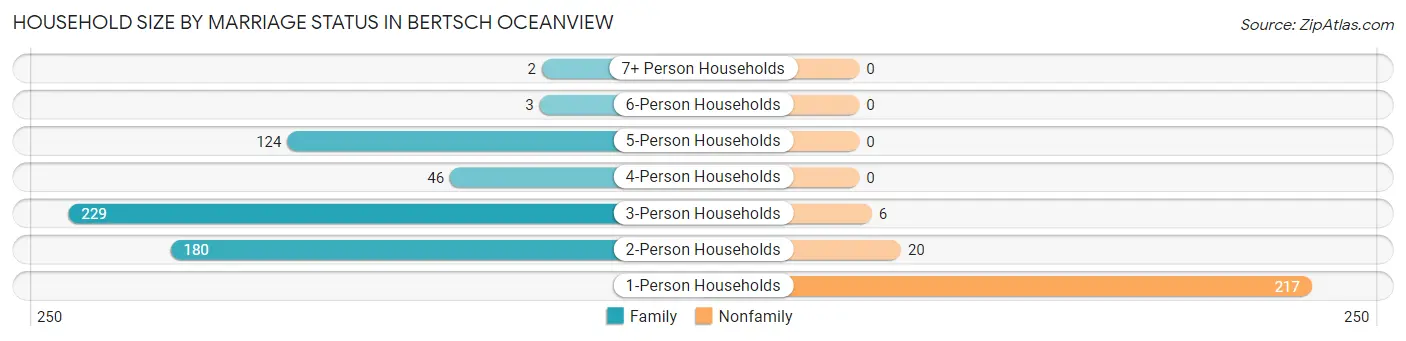
| Household Size | Family Households | Nonfamily Households |
| 1-Person Households | - | 217 (26.2%) |
| 2-Person Households | 180 (21.8%) | 20 (2.4%) |
| 3-Person Households | 229 (27.7%) | 6 (0.7%) |
| 4-Person Households | 46 (5.6%) | 0 (0.0%) |
| 5-Person Households | 124 (15.0%) | 0 (0.0%) |
| 6-Person Households | 3 (0.4%) | 0 (0.0%) |
| 7+ Person Households | 2 (0.2%) | 0 (0.0%) |
| Total | 584 (70.6%) | 243 (29.4%) |
Female Fertility in Bertsch Oceanview
Fertility by Age in Bertsch Oceanview
| Age Bracket | Women with Births | Births / 1,000 Women |
| 15 to 19 years | 0 (0.0%) | 0.0 |
| 20 to 34 years | 0 (0.0%) | 0.0 |
| 35 to 50 years | 0 (0.0%) | 0.0 |
| Total | 0 (0.0%) | 0.0 |
Fertility by Age by Marriage Status in Bertsch Oceanview
| Age Bracket | Married | Unmarried |
| 15 to 19 years | 0 (0.0%) | 0 (0.0%) |
| 20 to 34 years | 0 (0.0%) | 0 (0.0%) |
| 35 to 50 years | 0 (0.0%) | 0 (0.0%) |
| Total | 0 (0.0%) | 0 (0.0%) |
Fertility by Education in Bertsch Oceanview
| Educational Attainment | Women with Births | Births / 1,000 Women |
| Less than High School | 0 (0.0%) | 0.0 |
| High School Diploma | 0 (0.0%) | 0.0 |
| College or Associate's Degree | 0 (0.0%) | 0.0 |
| Bachelor's Degree | 0 (0.0%) | 0.0 |
| Graduate Degree | 0 (0.0%) | 0.0 |
| Total | 0 (0.0%) | 0.0 |
Fertility by Education by Marriage Status in Bertsch Oceanview
| Educational Attainment | Married | Unmarried |
| Less than High School | 0 (0.0%) | 0 (0.0%) |
| High School Diploma | 0 (0.0%) | 0 (0.0%) |
| College or Associate's Degree | 0 (0.0%) | 0 (0.0%) |
| Bachelor's Degree | 0 (0.0%) | 0 (0.0%) |
| Graduate Degree | 0 (0.0%) | 0 (0.0%) |
| Total | 0 (0.0%) | 0 (0.0%) |
Employment Characteristics in Bertsch Oceanview
Employment by Class of Employer in Bertsch Oceanview
Among the 976 employed individuals in Bertsch Oceanview, private company employees (553 | 56.7%), local government employees (120 | 12.3%), and self-employed (not incorporated) (107 | 11.0%) make up the most common classes of employment.
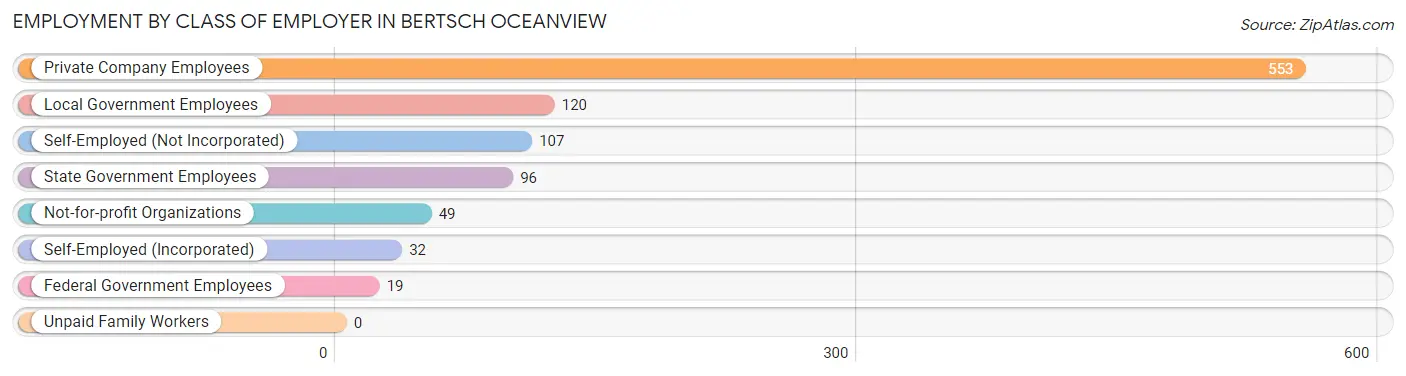
| Employer Class | # Employees | % Employees |
| Private Company Employees | 553 | 56.7% |
| Self-Employed (Incorporated) | 32 | 3.3% |
| Self-Employed (Not Incorporated) | 107 | 11.0% |
| Not-for-profit Organizations | 49 | 5.0% |
| Local Government Employees | 120 | 12.3% |
| State Government Employees | 96 | 9.8% |
| Federal Government Employees | 19 | 1.9% |
| Unpaid Family Workers | 0 | 0.0% |
| Total | 976 | 100.0% |
Employment Status by Age in Bertsch Oceanview
According to the labor force statistics for Bertsch Oceanview, out of the total population over 16 years of age (1,691), 64.6% or 1,092 individuals are in the labor force, with 5.0% or 55 of them unemployed. The age group with the highest labor force participation rate is 25 to 29 years, with 100.0% or 104 individuals in the labor force. Within the labor force, the 20 to 24 years age range has the highest percentage of unemployed individuals, with 20.2% or 37 of them being unemployed.
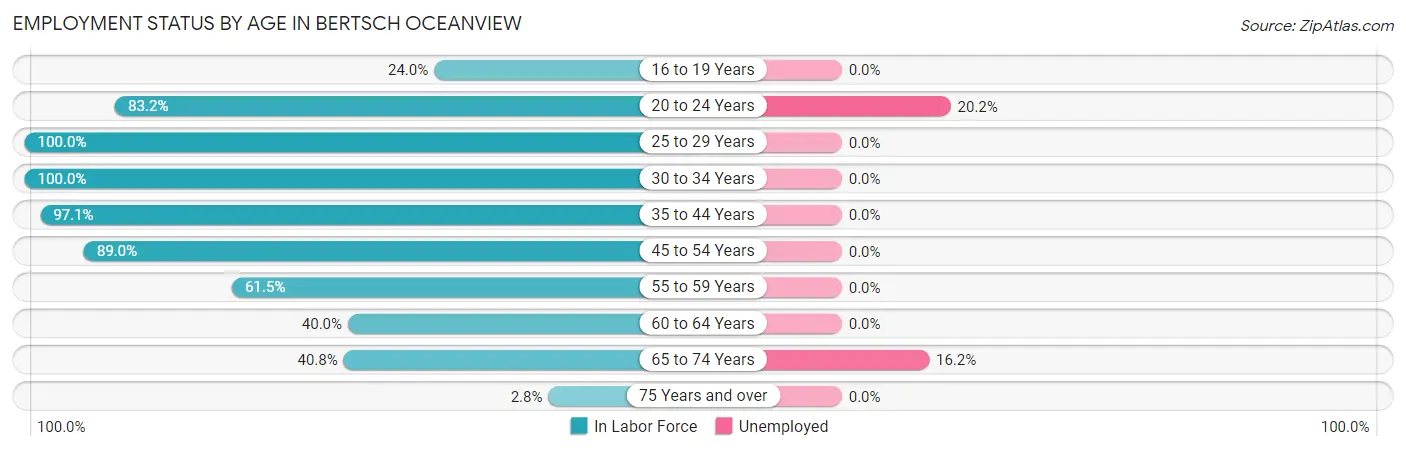
| Age Bracket | In Labor Force | Unemployed |
| 16 to 19 Years | 25 (24.0%) | 0 (0.0%) |
| 20 to 24 Years | 183 (83.2%) | 37 (20.2%) |
| 25 to 29 Years | 104 (100.0%) | 0 (0.0%) |
| 30 to 34 Years | 88 (100.0%) | 0 (0.0%) |
| 35 to 44 Years | 168 (97.1%) | 0 (0.0%) |
| 45 to 54 Years | 283 (89.0%) | 0 (0.0%) |
| 55 to 59 Years | 91 (61.5%) | 0 (0.0%) |
| 60 to 64 Years | 34 (40.0%) | 0 (0.0%) |
| 65 to 74 Years | 111 (40.8%) | 18 (16.2%) |
| 75 Years and over | 5 (2.8%) | 0 (0.0%) |
| Total | 1,092 (64.6%) | 55 (5.0%) |
Employment Status by Educational Attainment in Bertsch Oceanview
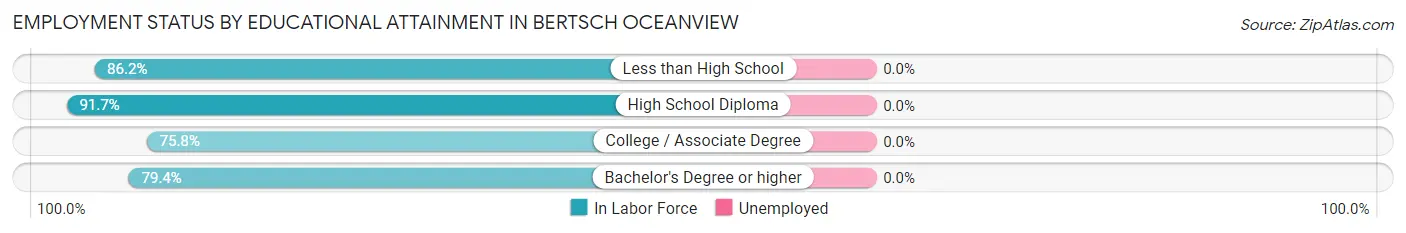
| Educational Attainment | In Labor Force | Unemployed |
| Less than High School | 81 (86.2%) | 0 (0.0%) |
| High School Diploma | 333 (91.7%) | 0 (0.0%) |
| College / Associate Degree | 219 (75.8%) | 0 (0.0%) |
| Bachelor's Degree or higher | 135 (79.4%) | 0 (0.0%) |
| Total | 768 (83.8%) | 0 (0.0%) |
Employment Occupations by Sex in Bertsch Oceanview
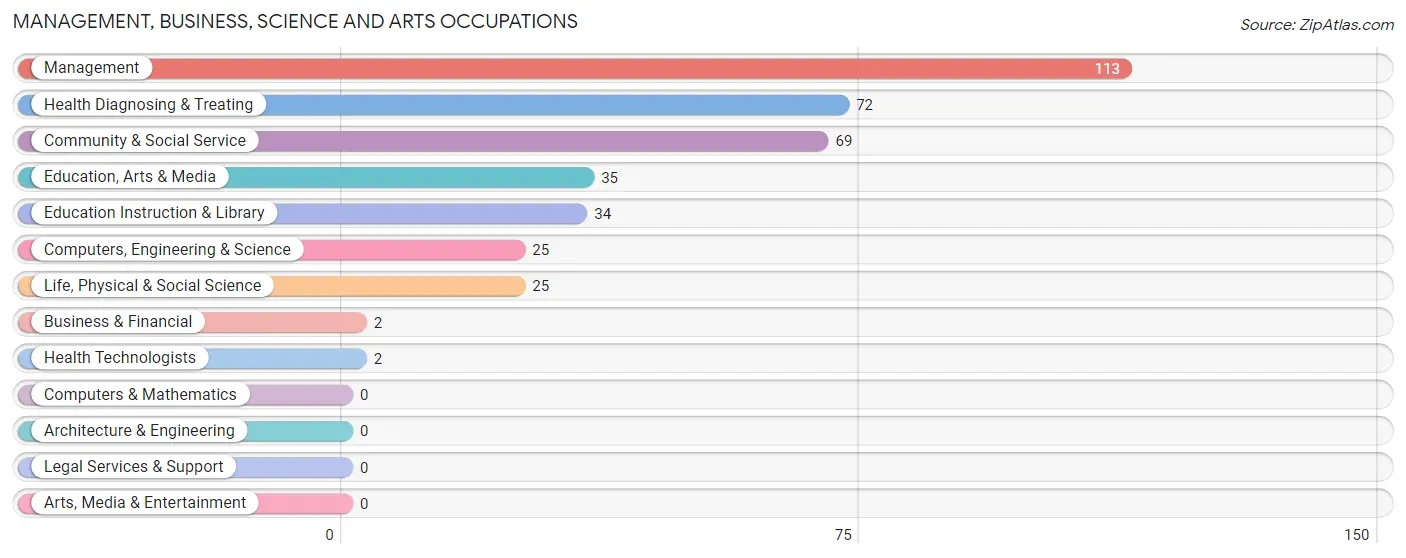
Management, Business, Science and Arts Occupations
The most common Management, Business, Science and Arts occupations in Bertsch Oceanview are Management (113 | 10.9%), Health Diagnosing & Treating (72 | 6.9%), Community & Social Service (69 | 6.7%), Education, Arts & Media (35 | 3.4%), and Education Instruction & Library (34 | 3.3%).
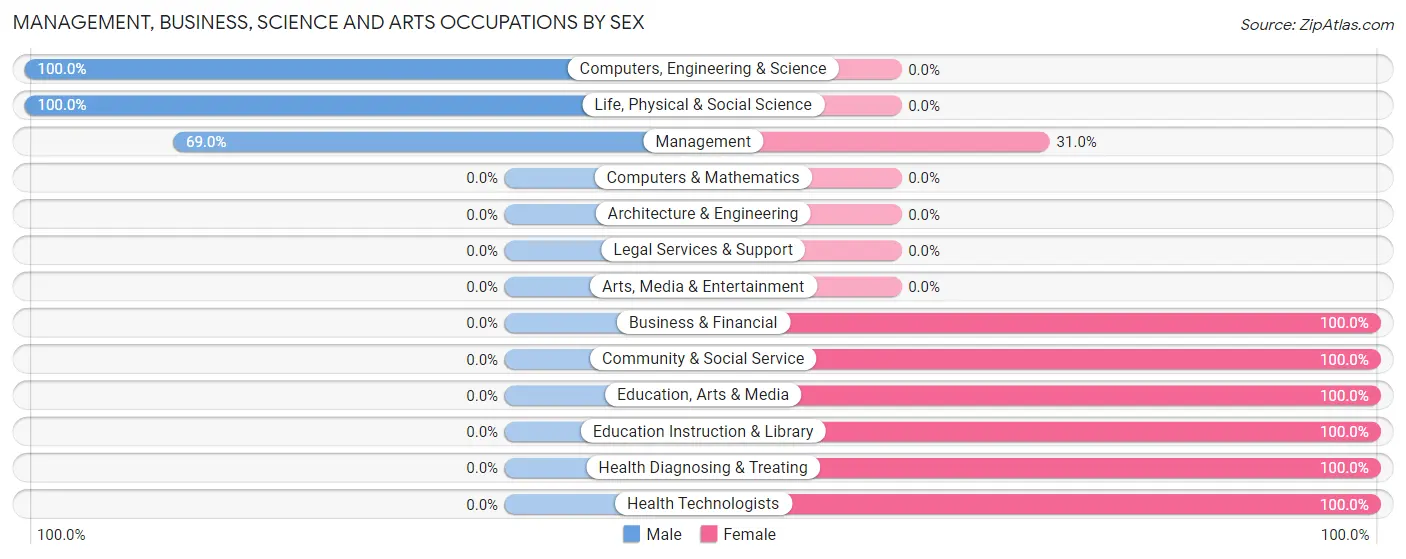
Management, Business, Science and Arts Occupations by Sex
Within the Management, Business, Science and Arts occupations in Bertsch Oceanview, the most male-oriented occupations are Computers, Engineering & Science (100.0%), Life, Physical & Social Science (100.0%), and Management (69.0%), while the most female-oriented occupations are Business & Financial (100.0%), Community & Social Service (100.0%), and Education, Arts & Media (100.0%).
| Occupation | Male | Female |
| Management | 78 (69.0%) | 35 (31.0%) |
| Business & Financial | 0 (0.0%) | 2 (100.0%) |
| Computers, Engineering & Science | 25 (100.0%) | 0 (0.0%) |
| Computers & Mathematics | 0 (0.0%) | 0 (0.0%) |
| Architecture & Engineering | 0 (0.0%) | 0 (0.0%) |
| Life, Physical & Social Science | 25 (100.0%) | 0 (0.0%) |
| Community & Social Service | 0 (0.0%) | 69 (100.0%) |
| Education, Arts & Media | 0 (0.0%) | 35 (100.0%) |
| Legal Services & Support | 0 (0.0%) | 0 (0.0%) |
| Education Instruction & Library | 0 (0.0%) | 34 (100.0%) |
| Arts, Media & Entertainment | 0 (0.0%) | 0 (0.0%) |
| Health Diagnosing & Treating | 0 (0.0%) | 72 (100.0%) |
| Health Technologists | 0 (0.0%) | 2 (100.0%) |
| Total (Category) | 103 (36.6%) | 178 (63.3%) |
| Total (Overall) | 528 (50.9%) | 509 (49.1%) |
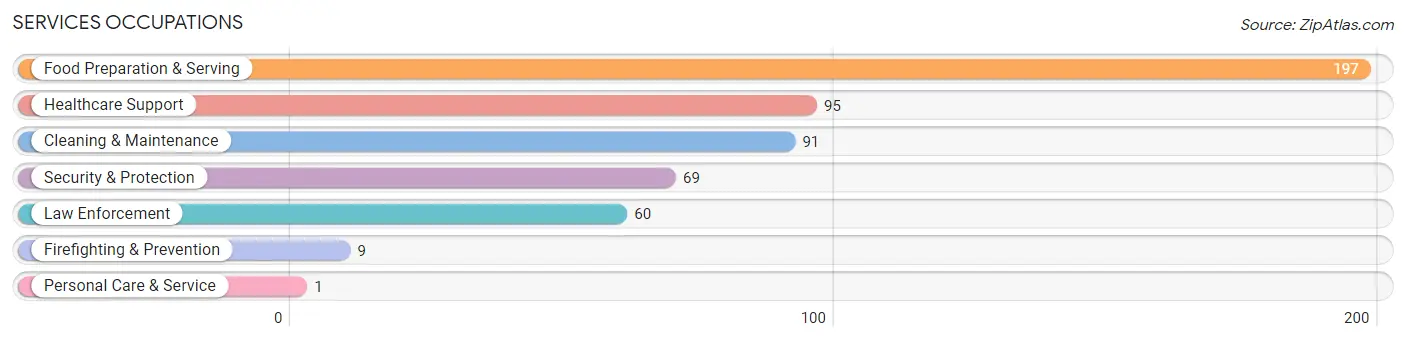
Services Occupations
The most common Services occupations in Bertsch Oceanview are Food Preparation & Serving (197 | 19.0%), Healthcare Support (95 | 9.2%), Cleaning & Maintenance (91 | 8.8%), Security & Protection (69 | 6.7%), and Law Enforcement (60 | 5.8%).
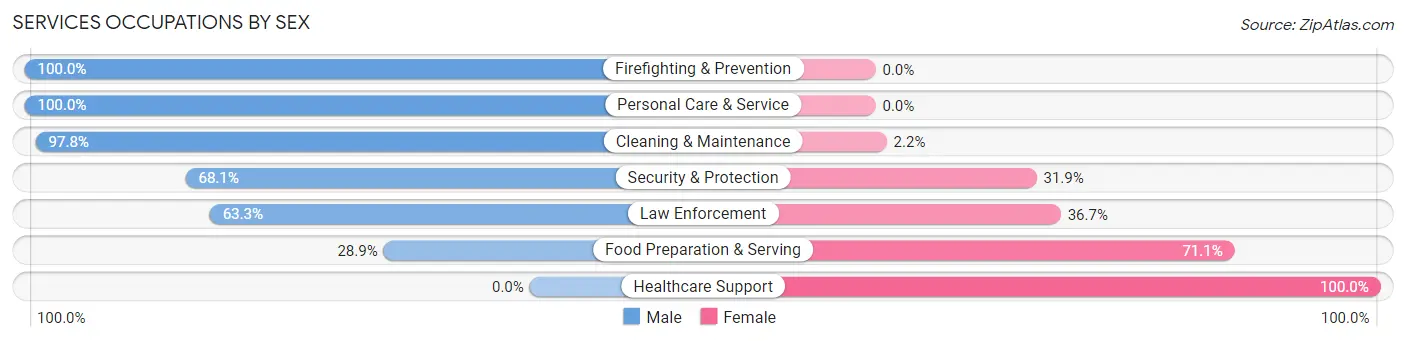
Services Occupations by Sex
Within the Services occupations in Bertsch Oceanview, the most male-oriented occupations are Firefighting & Prevention (100.0%), Personal Care & Service (100.0%), and Cleaning & Maintenance (97.8%), while the most female-oriented occupations are Healthcare Support (100.0%), Food Preparation & Serving (71.1%), and Law Enforcement (36.7%).
| Occupation | Male | Female |
| Healthcare Support | 0 (0.0%) | 95 (100.0%) |
| Security & Protection | 47 (68.1%) | 22 (31.9%) |
| Firefighting & Prevention | 9 (100.0%) | 0 (0.0%) |
| Law Enforcement | 38 (63.3%) | 22 (36.7%) |
| Food Preparation & Serving | 57 (28.9%) | 140 (71.1%) |
| Cleaning & Maintenance | 89 (97.8%) | 2 (2.2%) |
| Personal Care & Service | 1 (100.0%) | 0 (0.0%) |
| Total (Category) | 194 (42.8%) | 259 (57.2%) |
| Total (Overall) | 528 (50.9%) | 509 (49.1%) |
Sales and Office Occupations
The most common Sales and Office occupations in Bertsch Oceanview are Office & Administration (84 | 8.1%), and Sales & Related (36 | 3.5%).
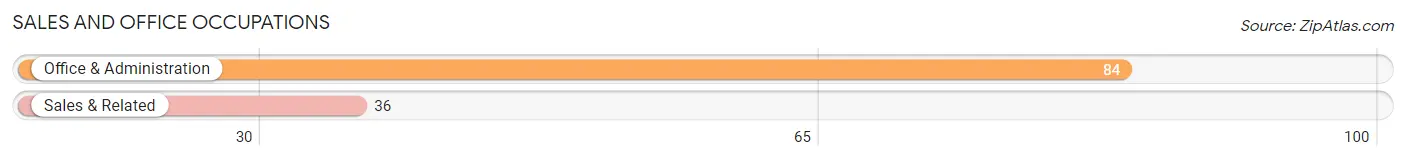
Sales and Office Occupations by Sex
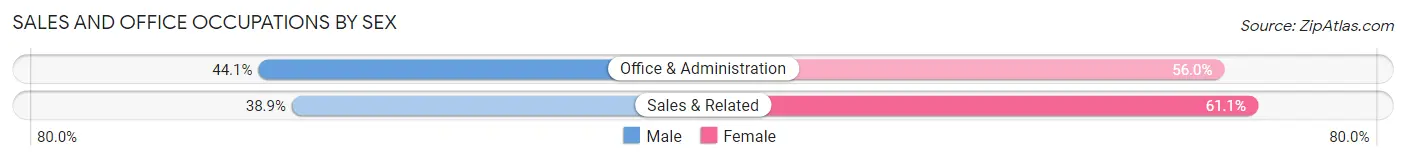
| Occupation | Male | Female |
| Sales & Related | 14 (38.9%) | 22 (61.1%) |
| Office & Administration | 37 (44.1%) | 47 (55.9%) |
| Total (Category) | 51 (42.5%) | 69 (57.5%) |
| Total (Overall) | 528 (50.9%) | 509 (49.1%) |
Natural Resources, Construction and Maintenance Occupations
The most common Natural Resources, Construction and Maintenance occupations in Bertsch Oceanview are Installation, Maintenance & Repair (108 | 10.4%), Farming, Fishing & Forestry (56 | 5.4%), and Construction & Extraction (13 | 1.3%).
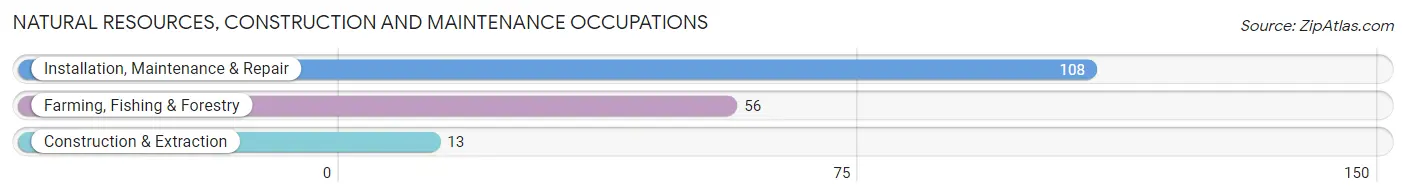
Natural Resources, Construction and Maintenance Occupations by Sex

| Occupation | Male | Female |
| Farming, Fishing & Forestry | 56 (100.0%) | 0 (0.0%) |
| Construction & Extraction | 13 (100.0%) | 0 (0.0%) |
| Installation, Maintenance & Repair | 108 (100.0%) | 0 (0.0%) |
| Total (Category) | 177 (100.0%) | 0 (0.0%) |
| Total (Overall) | 528 (50.9%) | 509 (49.1%) |
Production, Transportation and Moving Occupations
The most common Production, Transportation and Moving occupations in Bertsch Oceanview are , and Production (6 | 0.6%).
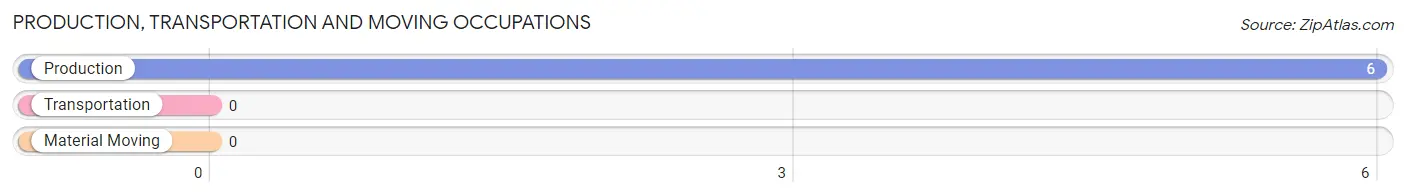
Production, Transportation and Moving Occupations by Sex
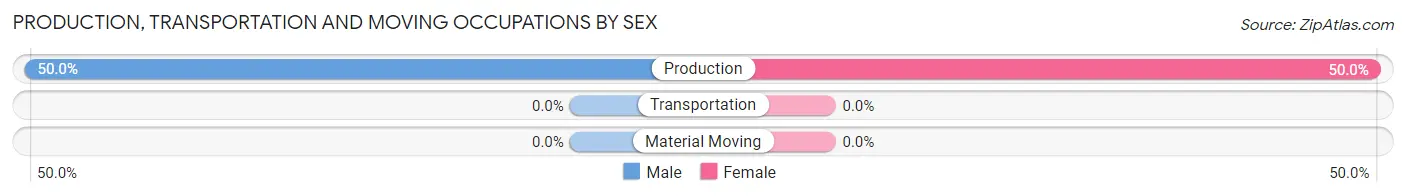
| Occupation | Male | Female |
| Production | 3 (50.0%) | 3 (50.0%) |
| Transportation | 0 (0.0%) | 0 (0.0%) |
| Material Moving | 0 (0.0%) | 0 (0.0%) |
| Total (Category) | 3 (50.0%) | 3 (50.0%) |
| Total (Overall) | 528 (50.9%) | 509 (49.1%) |
Employment Industries by Sex in Bertsch Oceanview
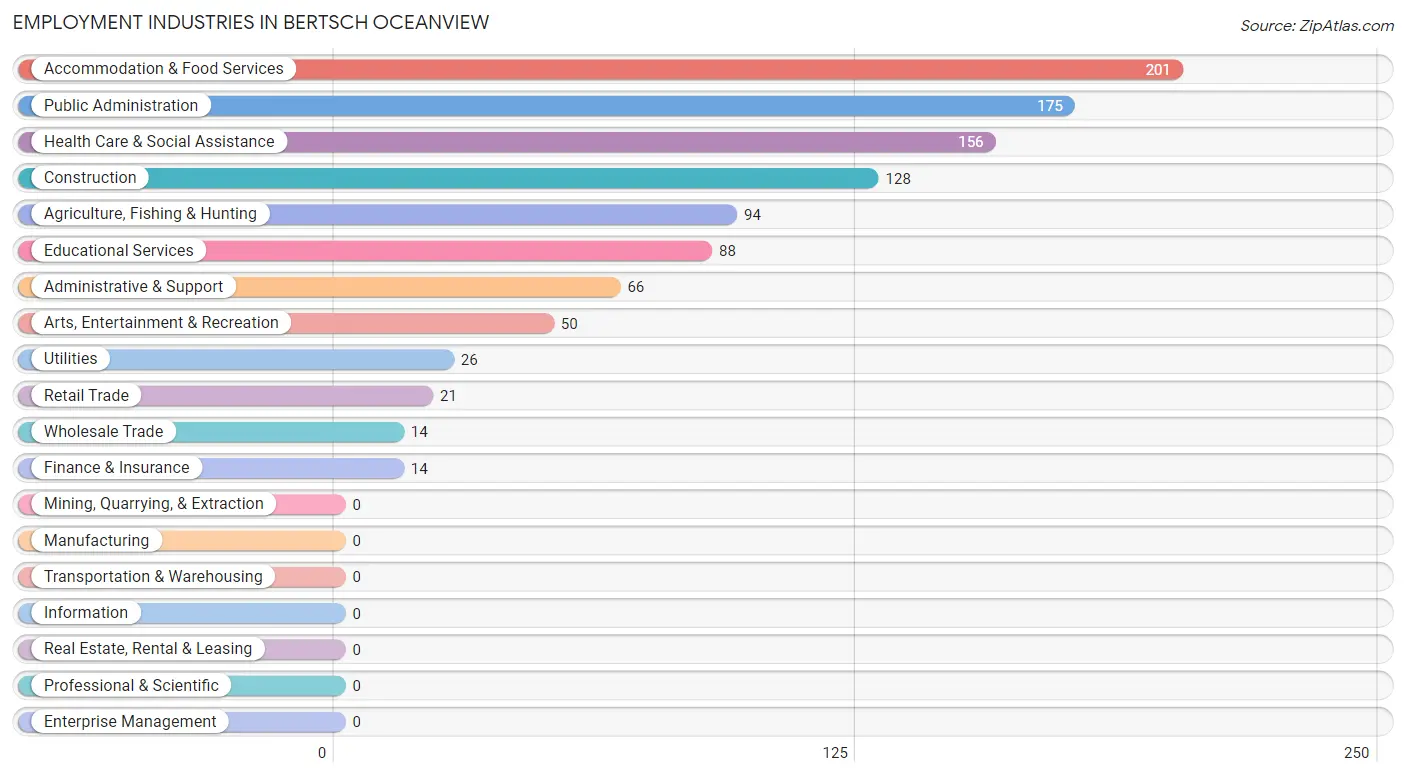
Employment Industries in Bertsch Oceanview
The major employment industries in Bertsch Oceanview include Accommodation & Food Services (201 | 19.4%), Public Administration (175 | 16.9%), Health Care & Social Assistance (156 | 15.0%), Construction (128 | 12.3%), and Agriculture, Fishing & Hunting (94 | 9.1%).
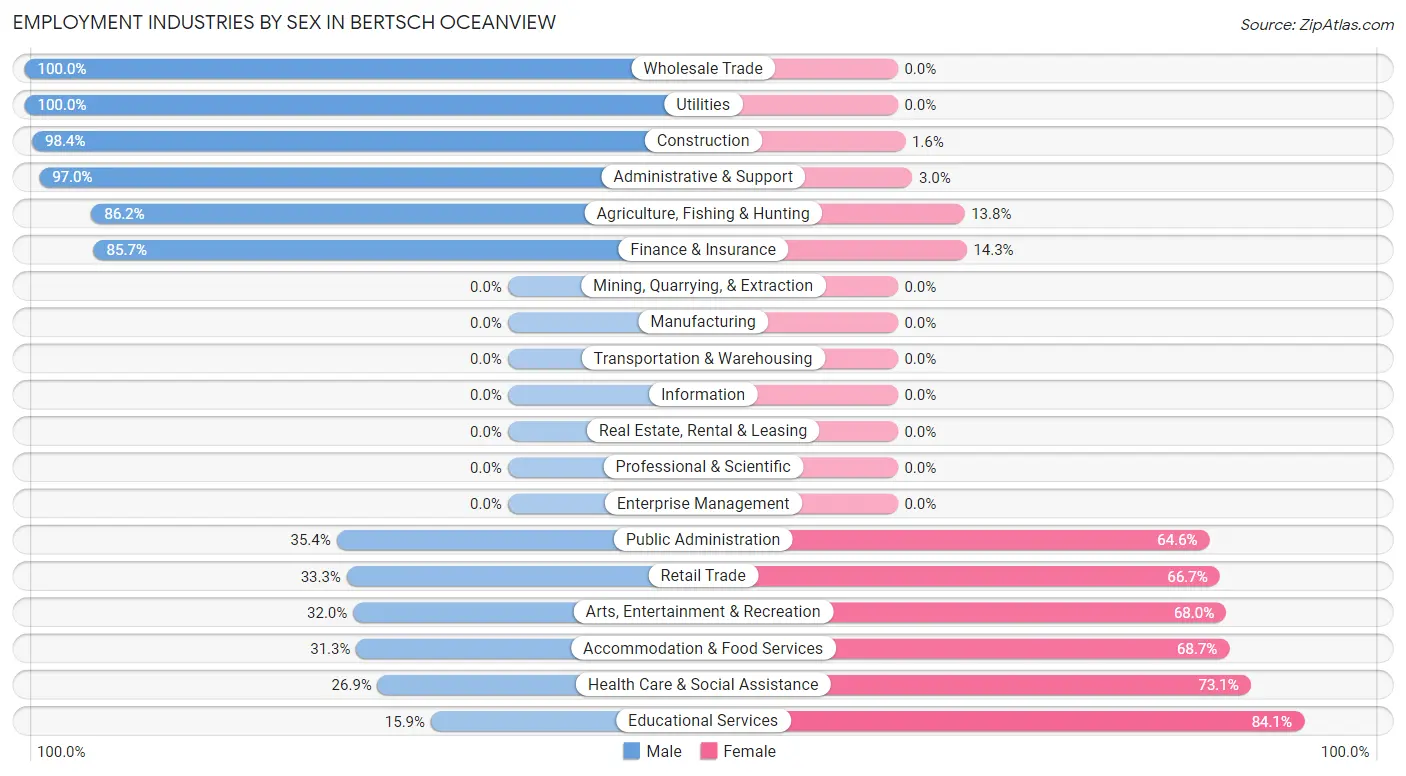
Employment Industries by Sex in Bertsch Oceanview
The Bertsch Oceanview industries that see more men than women are Wholesale Trade (100.0%), Utilities (100.0%), and Construction (98.4%), whereas the industries that tend to have a higher number of women are Educational Services (84.1%), Health Care & Social Assistance (73.1%), and Accommodation & Food Services (68.7%).
| Industry | Male | Female |
| Agriculture, Fishing & Hunting | 81 (86.2%) | 13 (13.8%) |
| Mining, Quarrying, & Extraction | 0 (0.0%) | 0 (0.0%) |
| Construction | 126 (98.4%) | 2 (1.6%) |
| Manufacturing | 0 (0.0%) | 0 (0.0%) |
| Wholesale Trade | 14 (100.0%) | 0 (0.0%) |
| Retail Trade | 7 (33.3%) | 14 (66.7%) |
| Transportation & Warehousing | 0 (0.0%) | 0 (0.0%) |
| Utilities | 26 (100.0%) | 0 (0.0%) |
| Information | 0 (0.0%) | 0 (0.0%) |
| Finance & Insurance | 12 (85.7%) | 2 (14.3%) |
| Real Estate, Rental & Leasing | 0 (0.0%) | 0 (0.0%) |
| Professional & Scientific | 0 (0.0%) | 0 (0.0%) |
| Enterprise Management | 0 (0.0%) | 0 (0.0%) |
| Administrative & Support | 64 (97.0%) | 2 (3.0%) |
| Educational Services | 14 (15.9%) | 74 (84.1%) |
| Health Care & Social Assistance | 42 (26.9%) | 114 (73.1%) |
| Arts, Entertainment & Recreation | 16 (32.0%) | 34 (68.0%) |
| Accommodation & Food Services | 63 (31.3%) | 138 (68.7%) |
| Public Administration | 62 (35.4%) | 113 (64.6%) |
| Total | 528 (50.9%) | 509 (49.1%) |
Education in Bertsch Oceanview
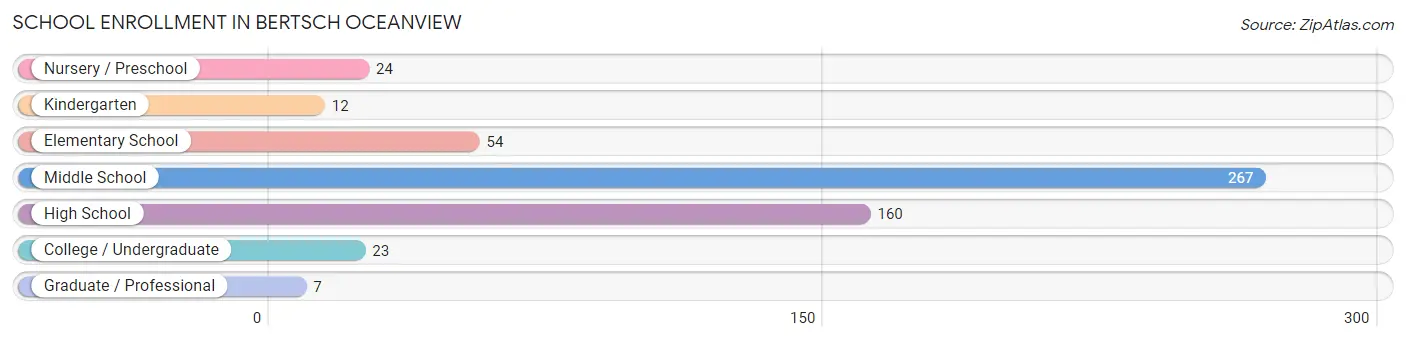
School Enrollment in Bertsch Oceanview
The most common levels of schooling among the 547 students in Bertsch Oceanview are middle school (267 | 48.8%), high school (160 | 29.2%), and elementary school (54 | 9.9%).
| School Level | # Students | % Students |
| Nursery / Preschool | 24 | 4.4% |
| Kindergarten | 12 | 2.2% |
| Elementary School | 54 | 9.9% |
| Middle School | 267 | 48.8% |
| High School | 160 | 29.2% |
| College / Undergraduate | 23 | 4.2% |
| Graduate / Professional | 7 | 1.3% |
| Total | 547 | 100.0% |
School Enrollment by Age by Funding Source in Bertsch Oceanview
Out of a total of 547 students who are enrolled in schools in Bertsch Oceanview, 27 (4.9%) attend a private institution, while the remaining 520 (95.1%) are enrolled in public schools. The age group of 5 to 9 year old has the highest likelihood of being enrolled in private schools, with 20 (26.7% in the age bracket) enrolled. Conversely, the age group of 3 to 4 year olds has the lowest likelihood of being enrolled in a private school, with 15 (100.0% in the age bracket) attending a public institution.
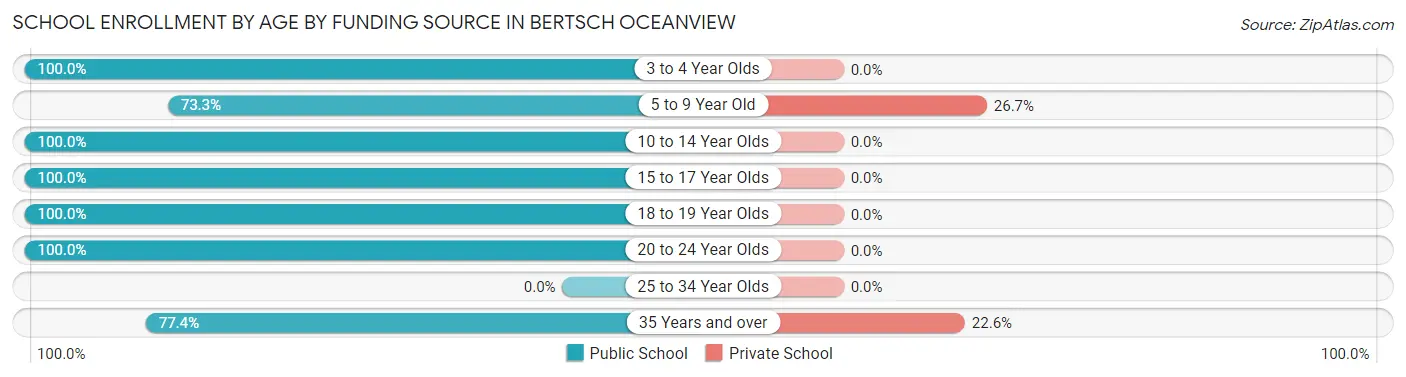
| Age Bracket | Public School | Private School |
| 3 to 4 Year Olds | 15 (100.0%) | 0 (0.0%) |
| 5 to 9 Year Old | 55 (73.3%) | 20 (26.7%) |
| 10 to 14 Year Olds | 267 (100.0%) | 0 (0.0%) |
| 15 to 17 Year Olds | 68 (100.0%) | 0 (0.0%) |
| 18 to 19 Year Olds | 72 (100.0%) | 0 (0.0%) |
| 20 to 24 Year Olds | 19 (100.0%) | 0 (0.0%) |
| 25 to 34 Year Olds | 0 (0.0%) | 0 (0.0%) |
| 35 Years and over | 24 (77.4%) | 7 (22.6%) |
| Total | 520 (95.1%) | 27 (4.9%) |
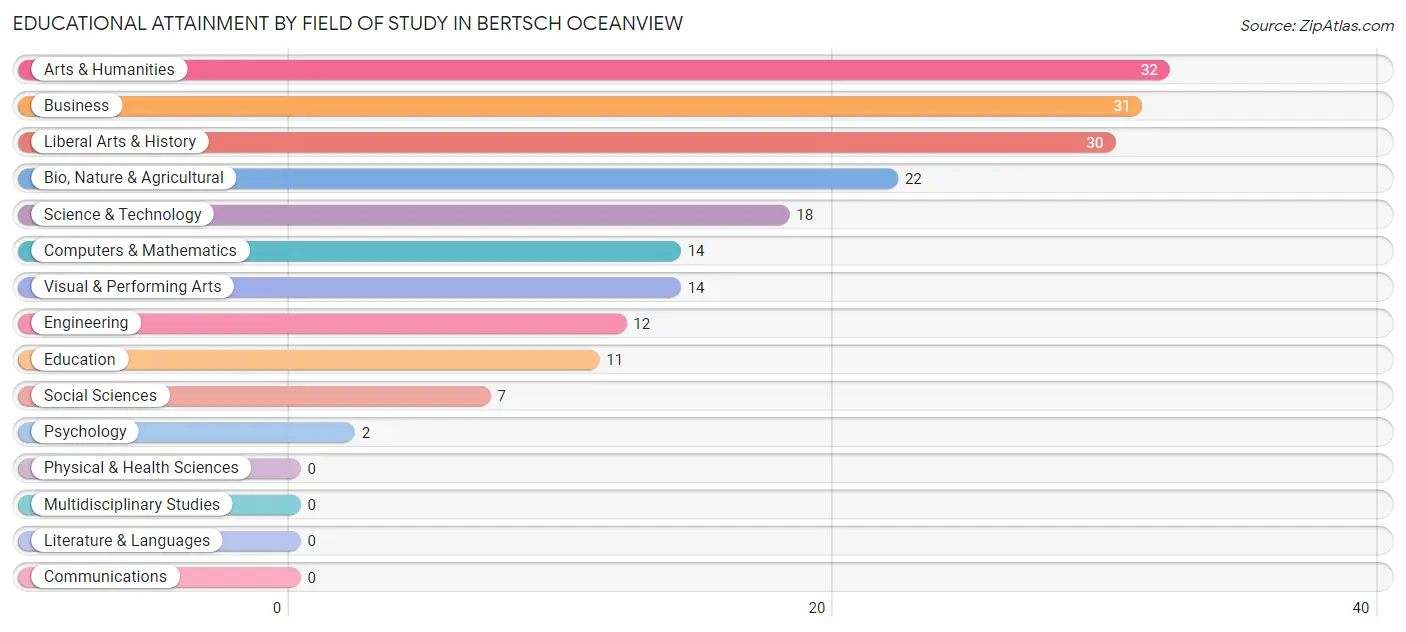
Educational Attainment by Field of Study in Bertsch Oceanview
Arts & humanities (32 | 16.6%), business (31 | 16.1%), liberal arts & history (30 | 15.5%), bio, nature & agricultural (22 | 11.4%), and science & technology (18 | 9.3%) are the most common fields of study among 193 individuals in Bertsch Oceanview who have obtained a bachelor's degree or higher.
| Field of Study | # Graduates | % Graduates |
| Computers & Mathematics | 14 | 7.2% |
| Bio, Nature & Agricultural | 22 | 11.4% |
| Physical & Health Sciences | 0 | 0.0% |
| Psychology | 2 | 1.0% |
| Social Sciences | 7 | 3.6% |
| Engineering | 12 | 6.2% |
| Multidisciplinary Studies | 0 | 0.0% |
| Science & Technology | 18 | 9.3% |
| Business | 31 | 16.1% |
| Education | 11 | 5.7% |
| Literature & Languages | 0 | 0.0% |
| Liberal Arts & History | 30 | 15.5% |
| Visual & Performing Arts | 14 | 7.2% |
| Communications | 0 | 0.0% |
| Arts & Humanities | 32 | 16.6% |
| Total | 193 | 100.0% |
Transportation & Commute in Bertsch Oceanview
Vehicle Availability by Sex in Bertsch Oceanview
The most prevalent vehicle ownership categories in Bertsch Oceanview are males with 2 vehicles (230, accounting for 45.7%) and females with 2 vehicles (324, making up 48.6%).
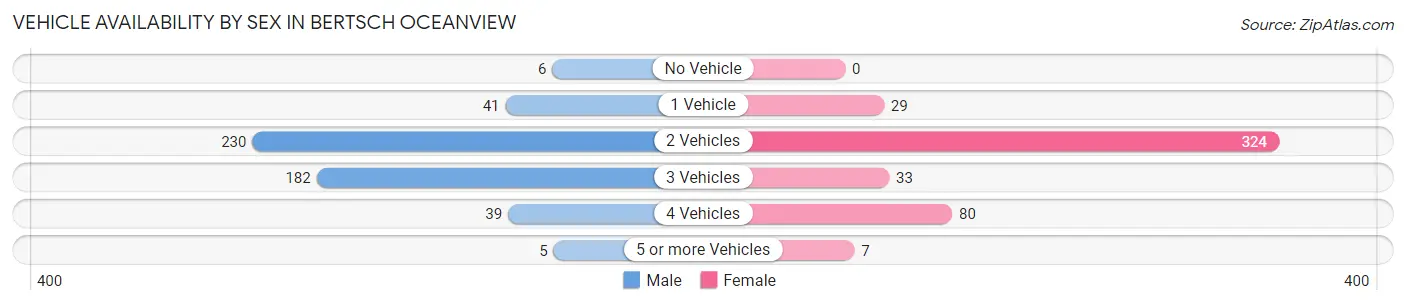
| Vehicles Available | Male | Female |
| No Vehicle | 6 (1.2%) | 0 (0.0%) |
| 1 Vehicle | 41 (8.2%) | 29 (6.1%) |
| 2 Vehicles | 230 (45.7%) | 324 (68.5%) |
| 3 Vehicles | 182 (36.2%) | 33 (7.0%) |
| 4 Vehicles | 39 (7.7%) | 80 (16.9%) |
| 5 or more Vehicles | 5 (1.0%) | 7 (1.5%) |
| Total | 503 (100.0%) | 473 (100.0%) |
Commute Time in Bertsch Oceanview
The most frequently occuring commute durations in Bertsch Oceanview are 30 to 34 minutes (237 commuters, 27.7%), 10 to 14 minutes (175 commuters, 20.4%), and 5 to 9 minutes (159 commuters, 18.6%).
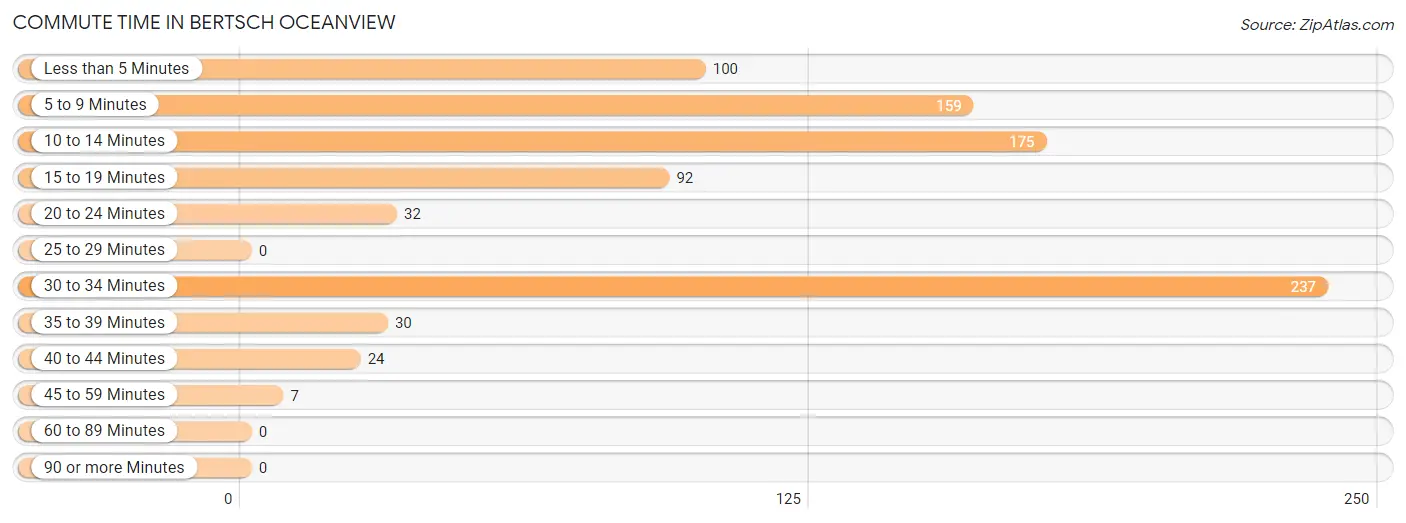
| Commute Time | # Commuters | % Commuters |
| Less than 5 Minutes | 100 | 11.7% |
| 5 to 9 Minutes | 159 | 18.6% |
| 10 to 14 Minutes | 175 | 20.4% |
| 15 to 19 Minutes | 92 | 10.7% |
| 20 to 24 Minutes | 32 | 3.7% |
| 25 to 29 Minutes | 0 | 0.0% |
| 30 to 34 Minutes | 237 | 27.7% |
| 35 to 39 Minutes | 30 | 3.5% |
| 40 to 44 Minutes | 24 | 2.8% |
| 45 to 59 Minutes | 7 | 0.8% |
| 60 to 89 Minutes | 0 | 0.0% |
| 90 or more Minutes | 0 | 0.0% |
Commute Time by Sex in Bertsch Oceanview
The most common commute times in Bertsch Oceanview are 30 to 34 minutes (108 commuters, 23.5%) for males and 30 to 34 minutes (129 commuters, 32.6%) for females.
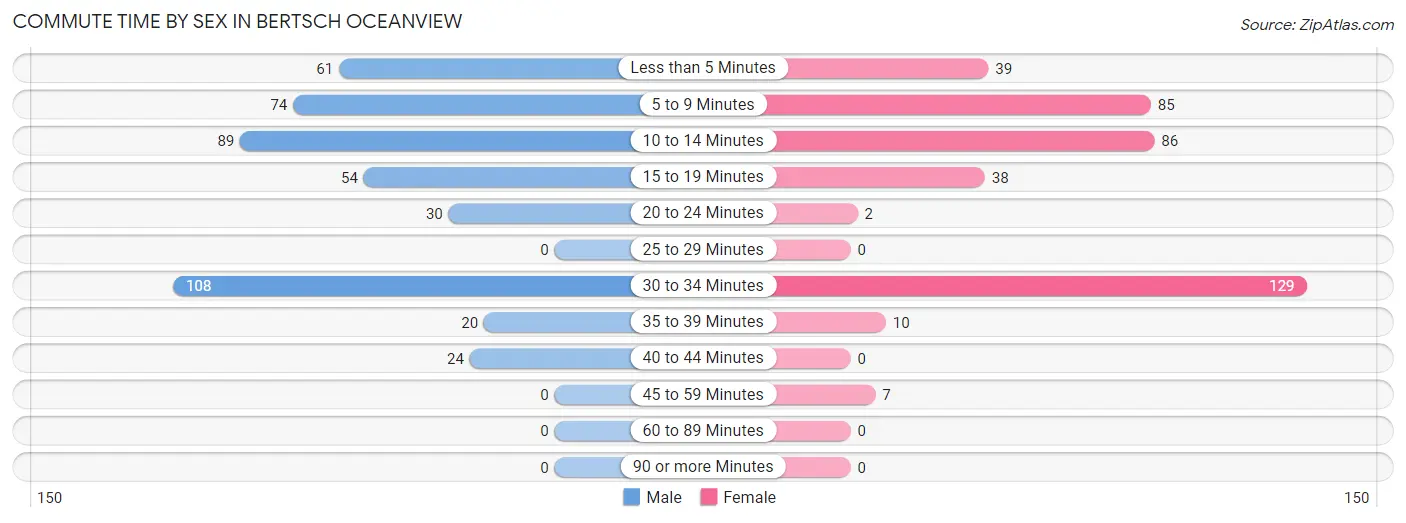
| Commute Time | Male | Female |
| Less than 5 Minutes | 61 (13.3%) | 39 (9.9%) |
| 5 to 9 Minutes | 74 (16.1%) | 85 (21.5%) |
| 10 to 14 Minutes | 89 (19.4%) | 86 (21.7%) |
| 15 to 19 Minutes | 54 (11.7%) | 38 (9.6%) |
| 20 to 24 Minutes | 30 (6.5%) | 2 (0.5%) |
| 25 to 29 Minutes | 0 (0.0%) | 0 (0.0%) |
| 30 to 34 Minutes | 108 (23.5%) | 129 (32.6%) |
| 35 to 39 Minutes | 20 (4.3%) | 10 (2.5%) |
| 40 to 44 Minutes | 24 (5.2%) | 0 (0.0%) |
| 45 to 59 Minutes | 0 (0.0%) | 7 (1.8%) |
| 60 to 89 Minutes | 0 (0.0%) | 0 (0.0%) |
| 90 or more Minutes | 0 (0.0%) | 0 (0.0%) |
Time of Departure to Work by Sex in Bertsch Oceanview
The most frequent times of departure to work in Bertsch Oceanview are 8:00 AM to 8:29 AM (174, 37.8%) for males and 7:00 AM to 7:29 AM (101, 25.5%) for females.
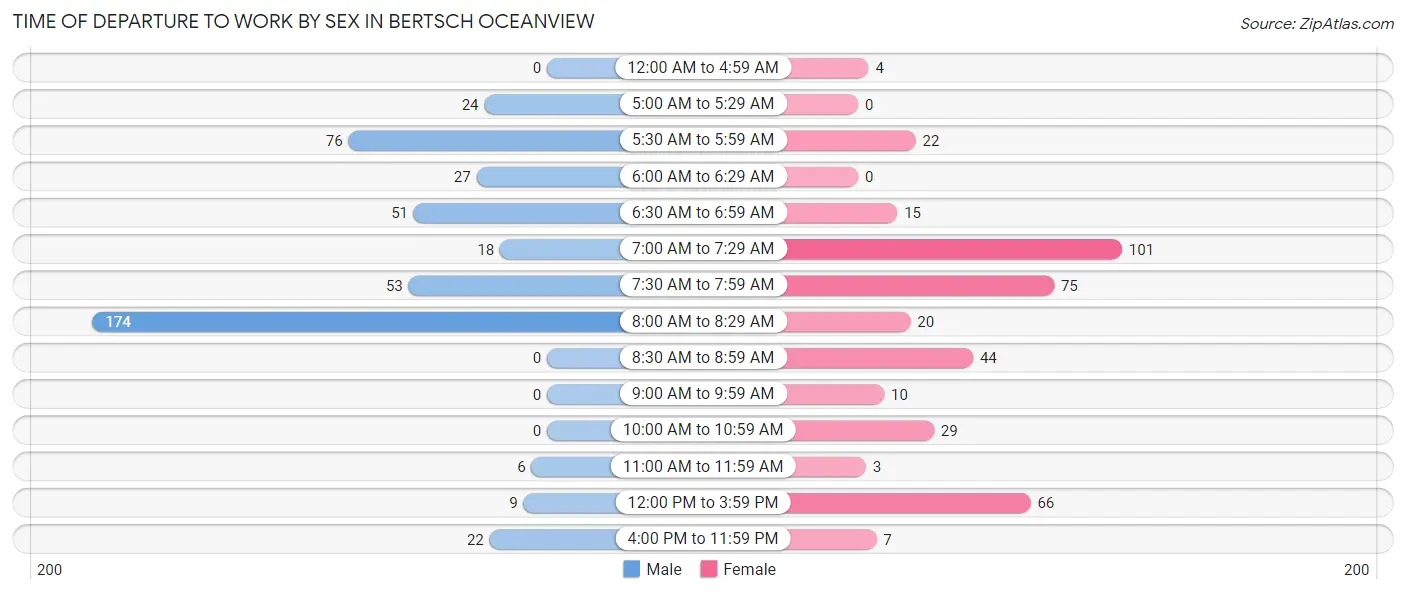
| Time of Departure | Male | Female |
| 12:00 AM to 4:59 AM | 0 (0.0%) | 4 (1.0%) |
| 5:00 AM to 5:29 AM | 24 (5.2%) | 0 (0.0%) |
| 5:30 AM to 5:59 AM | 76 (16.5%) | 22 (5.6%) |
| 6:00 AM to 6:29 AM | 27 (5.9%) | 0 (0.0%) |
| 6:30 AM to 6:59 AM | 51 (11.1%) | 15 (3.8%) |
| 7:00 AM to 7:29 AM | 18 (3.9%) | 101 (25.5%) |
| 7:30 AM to 7:59 AM | 53 (11.5%) | 75 (18.9%) |
| 8:00 AM to 8:29 AM | 174 (37.8%) | 20 (5.1%) |
| 8:30 AM to 8:59 AM | 0 (0.0%) | 44 (11.1%) |
| 9:00 AM to 9:59 AM | 0 (0.0%) | 10 (2.5%) |
| 10:00 AM to 10:59 AM | 0 (0.0%) | 29 (7.3%) |
| 11:00 AM to 11:59 AM | 6 (1.3%) | 3 (0.8%) |
| 12:00 PM to 3:59 PM | 9 (2.0%) | 66 (16.7%) |
| 4:00 PM to 11:59 PM | 22 (4.8%) | 7 (1.8%) |
| Total | 460 (100.0%) | 396 (100.0%) |
Housing Occupancy in Bertsch Oceanview
Occupancy by Ownership in Bertsch Oceanview
Of the total 827 dwellings in Bertsch Oceanview, owner-occupied units account for 668 (80.8%), while renter-occupied units make up 159 (19.2%).
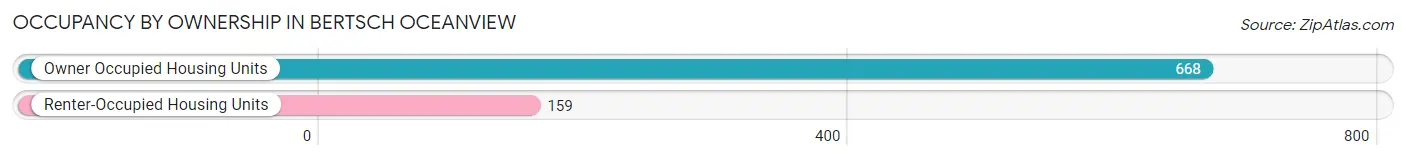
| Occupancy | # Housing Units | % Housing Units |
| Owner Occupied Housing Units | 668 | 80.8% |
| Renter-Occupied Housing Units | 159 | 19.2% |
| Total Occupied Housing Units | 827 | 100.0% |
Occupancy by Household Size in Bertsch Oceanview
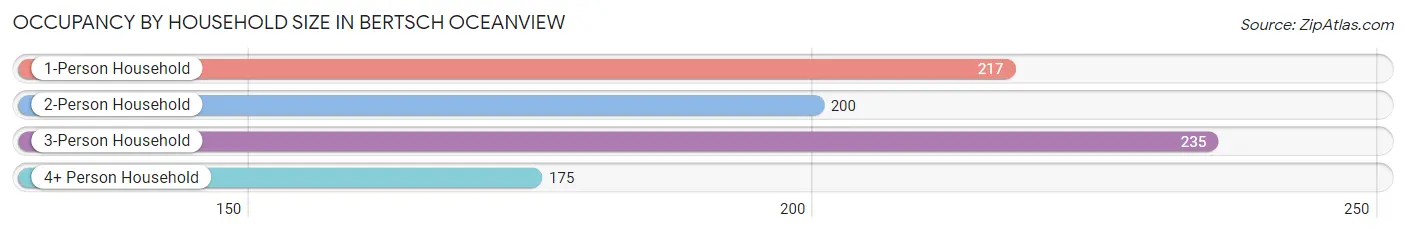
| Household Size | # Housing Units | % Housing Units |
| 1-Person Household | 217 | 26.2% |
| 2-Person Household | 200 | 24.2% |
| 3-Person Household | 235 | 28.4% |
| 4+ Person Household | 175 | 21.2% |
| Total Housing Units | 827 | 100.0% |
Occupancy by Ownership by Household Size in Bertsch Oceanview
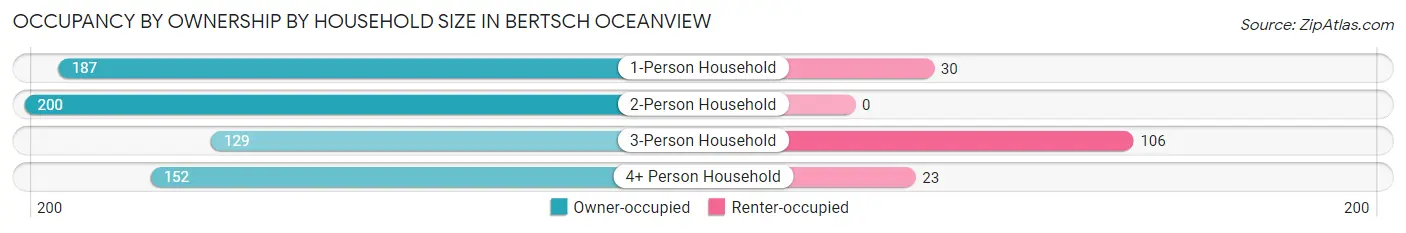
| Household Size | Owner-occupied | Renter-occupied |
| 1-Person Household | 187 (86.2%) | 30 (13.8%) |
| 2-Person Household | 200 (100.0%) | 0 (0.0%) |
| 3-Person Household | 129 (54.9%) | 106 (45.1%) |
| 4+ Person Household | 152 (86.9%) | 23 (13.1%) |
| Total Housing Units | 668 (80.8%) | 159 (19.2%) |
Occupancy by Educational Attainment in Bertsch Oceanview
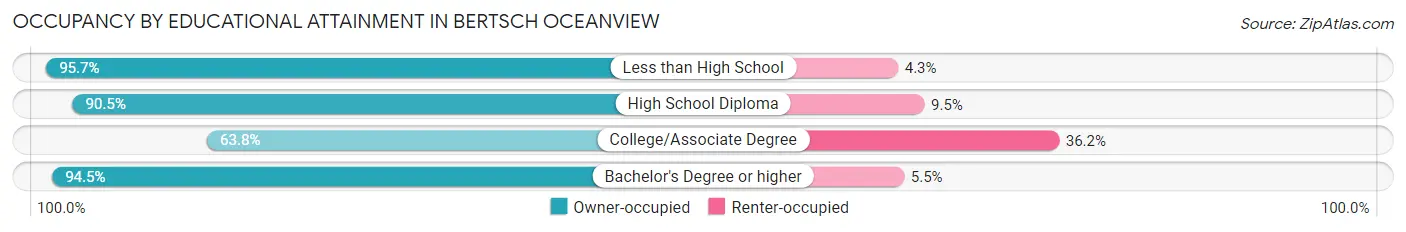
| Household Size | Owner-occupied | Renter-occupied |
| Less than High School | 67 (95.7%) | 3 (4.3%) |
| High School Diploma | 324 (90.5%) | 34 (9.5%) |
| College/Associate Degree | 208 (63.8%) | 118 (36.2%) |
| Bachelor's Degree or higher | 69 (94.5%) | 4 (5.5%) |
Occupancy by Age of Householder in Bertsch Oceanview
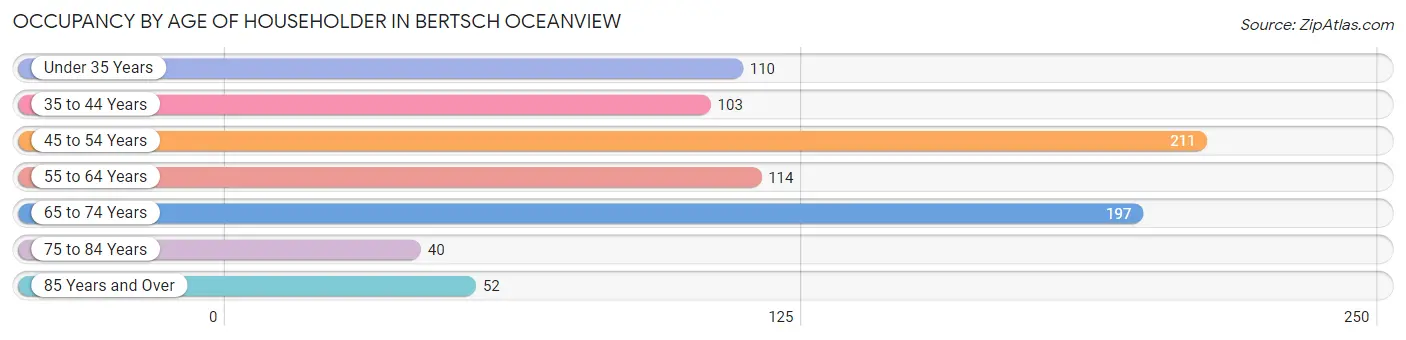
| Age Bracket | # Households | % Households |
| Under 35 Years | 110 | 13.3% |
| 35 to 44 Years | 103 | 12.4% |
| 45 to 54 Years | 211 | 25.5% |
| 55 to 64 Years | 114 | 13.8% |
| 65 to 74 Years | 197 | 23.8% |
| 75 to 84 Years | 40 | 4.8% |
| 85 Years and Over | 52 | 6.3% |
| Total | 827 | 100.0% |
Housing Finances in Bertsch Oceanview
Median Income by Occupancy in Bertsch Oceanview
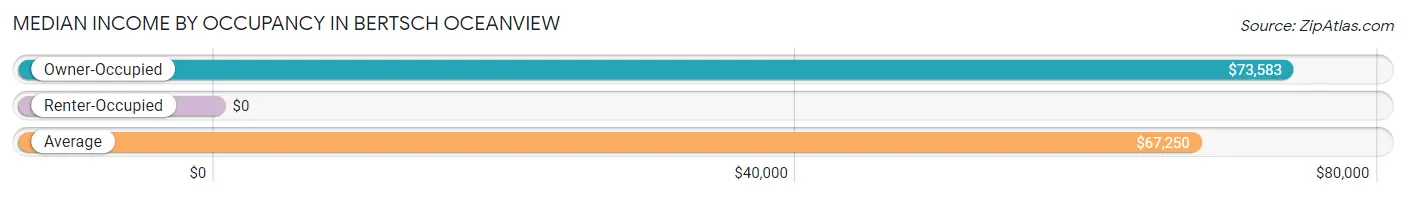
| Occupancy Type | # Households | Median Income |
| Owner-Occupied | 668 (80.8%) | $73,583 |
| Renter-Occupied | 159 (19.2%) | $0 |
| Average | 827 (100.0%) | $67,250 |
Occupancy by Householder Income Bracket in Bertsch Oceanview
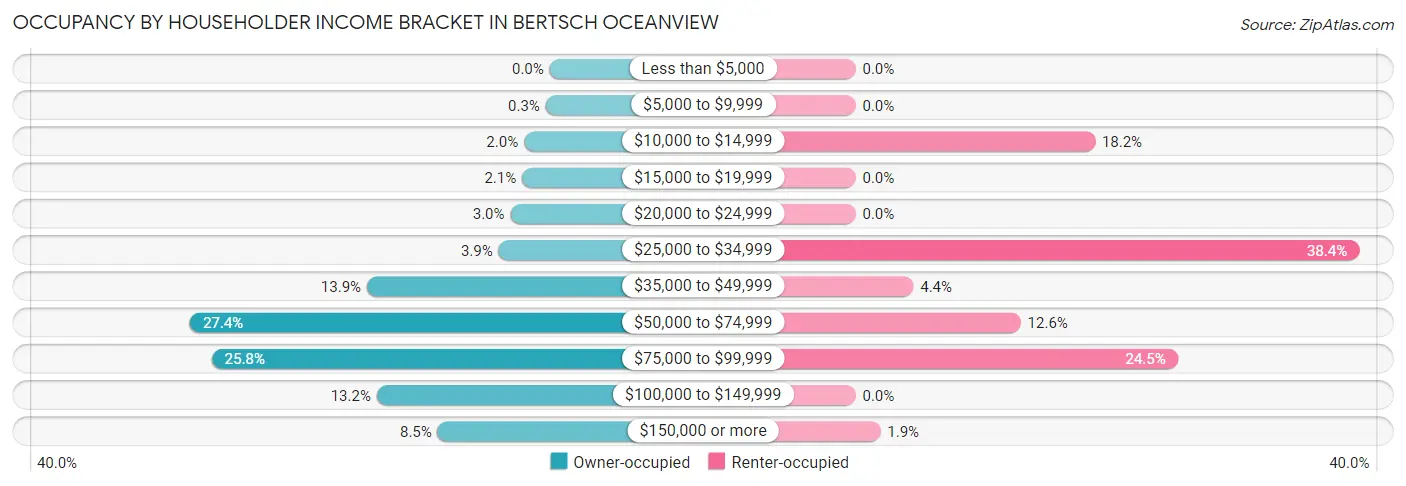
| Income Bracket | Owner-occupied | Renter-occupied |
| Less than $5,000 | 0 (0.0%) | 0 (0.0%) |
| $5,000 to $9,999 | 2 (0.3%) | 0 (0.0%) |
| $10,000 to $14,999 | 13 (1.9%) | 29 (18.2%) |
| $15,000 to $19,999 | 14 (2.1%) | 0 (0.0%) |
| $20,000 to $24,999 | 20 (3.0%) | 0 (0.0%) |
| $25,000 to $34,999 | 26 (3.9%) | 61 (38.4%) |
| $35,000 to $49,999 | 93 (13.9%) | 7 (4.4%) |
| $50,000 to $74,999 | 183 (27.4%) | 20 (12.6%) |
| $75,000 to $99,999 | 172 (25.8%) | 39 (24.5%) |
| $100,000 to $149,999 | 88 (13.2%) | 0 (0.0%) |
| $150,000 or more | 57 (8.5%) | 3 (1.9%) |
| Total | 668 (100.0%) | 159 (100.0%) |
Monthly Housing Cost Tiers in Bertsch Oceanview
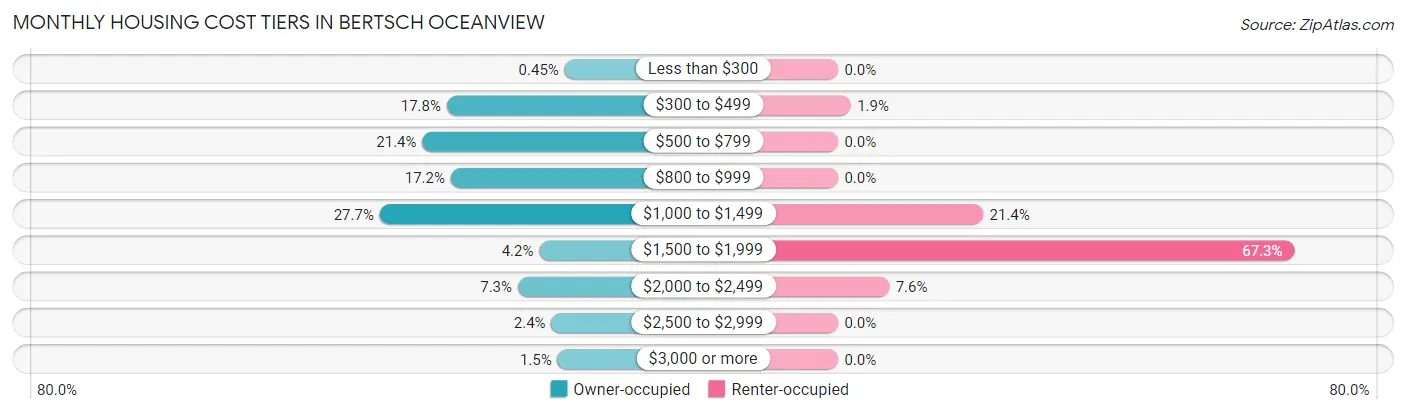
| Monthly Cost | Owner-occupied | Renter-occupied |
| Less than $300 | 3 (0.4%) | 0 (0.0%) |
| $300 to $499 | 119 (17.8%) | 3 (1.9%) |
| $500 to $799 | 143 (21.4%) | 0 (0.0%) |
| $800 to $999 | 115 (17.2%) | 0 (0.0%) |
| $1,000 to $1,499 | 185 (27.7%) | 34 (21.4%) |
| $1,500 to $1,999 | 28 (4.2%) | 107 (67.3%) |
| $2,000 to $2,499 | 49 (7.3%) | 12 (7.5%) |
| $2,500 to $2,999 | 16 (2.4%) | 0 (0.0%) |
| $3,000 or more | 10 (1.5%) | 0 (0.0%) |
| Total | 668 (100.0%) | 159 (100.0%) |
Physical Housing Characteristics in Bertsch Oceanview
Housing Structures in Bertsch Oceanview
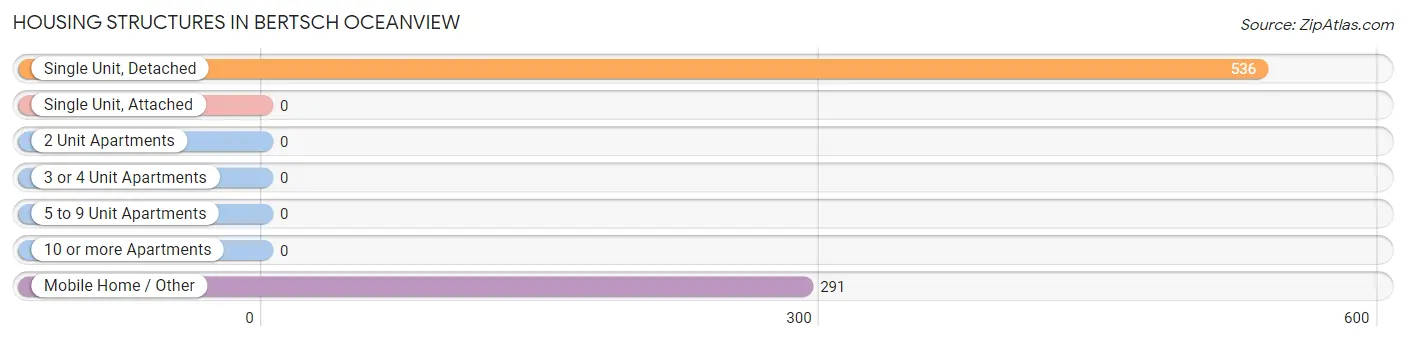
| Structure Type | # Housing Units | % Housing Units |
| Single Unit, Detached | 536 | 64.8% |
| Single Unit, Attached | 0 | 0.0% |
| 2 Unit Apartments | 0 | 0.0% |
| 3 or 4 Unit Apartments | 0 | 0.0% |
| 5 to 9 Unit Apartments | 0 | 0.0% |
| 10 or more Apartments | 0 | 0.0% |
| Mobile Home / Other | 291 | 35.2% |
| Total | 827 | 100.0% |
Housing Structures by Occupancy in Bertsch Oceanview
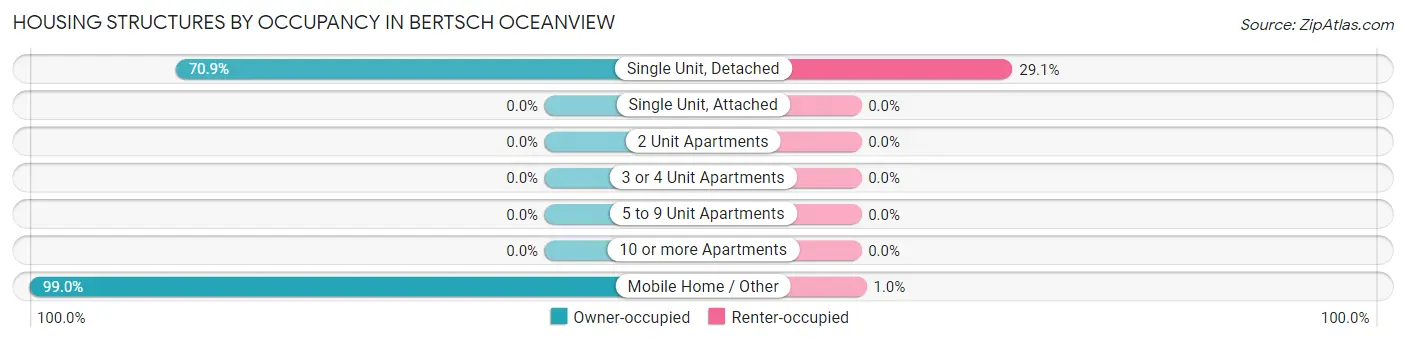
| Structure Type | Owner-occupied | Renter-occupied |
| Single Unit, Detached | 380 (70.9%) | 156 (29.1%) |
| Single Unit, Attached | 0 (0.0%) | 0 (0.0%) |
| 2 Unit Apartments | 0 (0.0%) | 0 (0.0%) |
| 3 or 4 Unit Apartments | 0 (0.0%) | 0 (0.0%) |
| 5 to 9 Unit Apartments | 0 (0.0%) | 0 (0.0%) |
| 10 or more Apartments | 0 (0.0%) | 0 (0.0%) |
| Mobile Home / Other | 288 (99.0%) | 3 (1.0%) |
| Total | 668 (80.8%) | 159 (19.2%) |
Housing Structures by Number of Rooms in Bertsch Oceanview
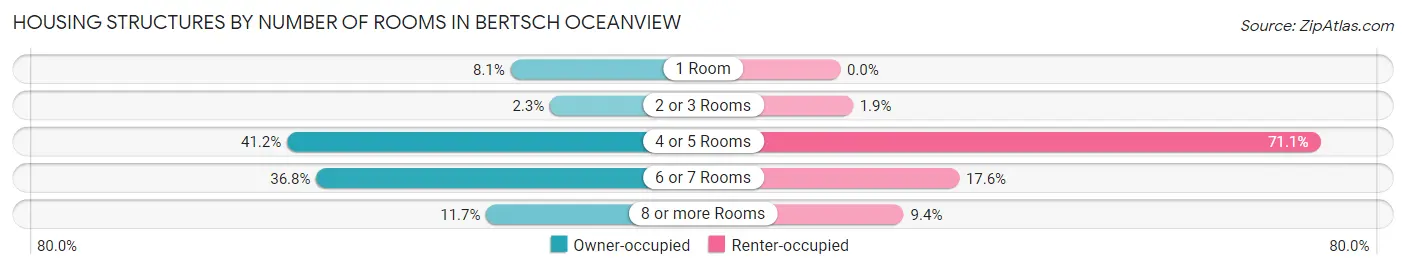
| Number of Rooms | Owner-occupied | Renter-occupied |
| 1 Room | 54 (8.1%) | 0 (0.0%) |
| 2 or 3 Rooms | 15 (2.2%) | 3 (1.9%) |
| 4 or 5 Rooms | 275 (41.2%) | 113 (71.1%) |
| 6 or 7 Rooms | 246 (36.8%) | 28 (17.6%) |
| 8 or more Rooms | 78 (11.7%) | 15 (9.4%) |
| Total | 668 (100.0%) | 159 (100.0%) |
Housing Structure by Heating Type in Bertsch Oceanview
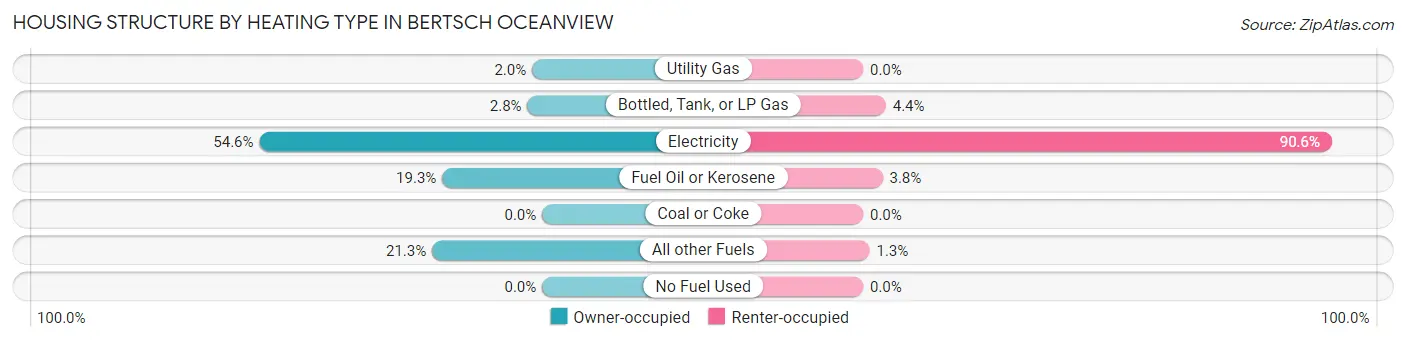
| Heating Type | Owner-occupied | Renter-occupied |
| Utility Gas | 13 (1.9%) | 0 (0.0%) |
| Bottled, Tank, or LP Gas | 19 (2.8%) | 7 (4.4%) |
| Electricity | 365 (54.6%) | 144 (90.6%) |
| Fuel Oil or Kerosene | 129 (19.3%) | 6 (3.8%) |
| Coal or Coke | 0 (0.0%) | 0 (0.0%) |
| All other Fuels | 142 (21.3%) | 2 (1.3%) |
| No Fuel Used | 0 (0.0%) | 0 (0.0%) |
| Total | 668 (100.0%) | 159 (100.0%) |
Household Vehicle Usage in Bertsch Oceanview
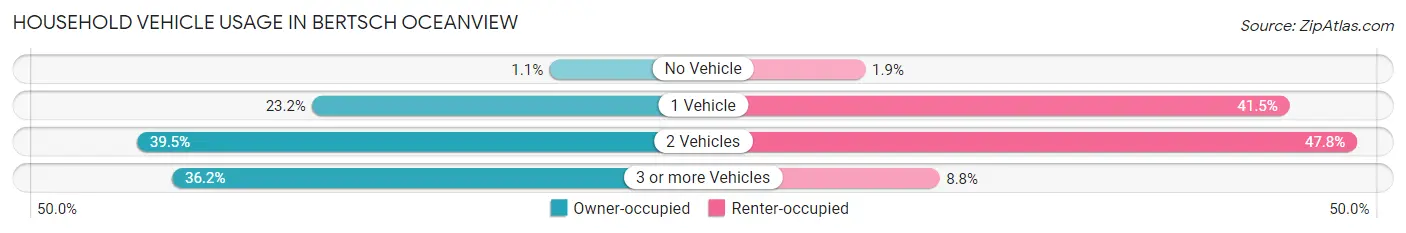
| Vehicles per Household | Owner-occupied | Renter-occupied |
| No Vehicle | 7 (1.1%) | 3 (1.9%) |
| 1 Vehicle | 155 (23.2%) | 66 (41.5%) |
| 2 Vehicles | 264 (39.5%) | 76 (47.8%) |
| 3 or more Vehicles | 242 (36.2%) | 14 (8.8%) |
| Total | 668 (100.0%) | 159 (100.0%) |
Real Estate & Mortgages in Bertsch Oceanview
Real Estate and Mortgage Overview in Bertsch Oceanview
| Characteristic | Without Mortgage | With Mortgage |
| Housing Units | 296 | 372 |
| Median Property Value | $136,300 | $232,300 |
| Median Household Income | $69,091 | $48 |
| Monthly Housing Costs | $718 | $10 |
| Real Estate Taxes | $907 | $0 |
Property Value by Mortgage Status in Bertsch Oceanview
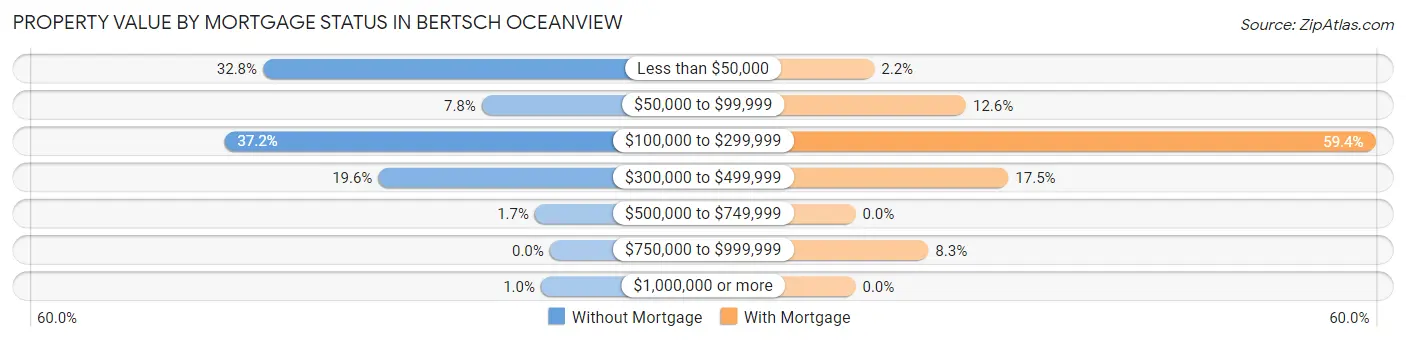
| Property Value | Without Mortgage | With Mortgage |
| Less than $50,000 | 97 (32.8%) | 8 (2.1%) |
| $50,000 to $99,999 | 23 (7.8%) | 47 (12.6%) |
| $100,000 to $299,999 | 110 (37.2%) | 221 (59.4%) |
| $300,000 to $499,999 | 58 (19.6%) | 65 (17.5%) |
| $500,000 to $749,999 | 5 (1.7%) | 0 (0.0%) |
| $750,000 to $999,999 | 0 (0.0%) | 31 (8.3%) |
| $1,000,000 or more | 3 (1.0%) | 0 (0.0%) |
| Total | 296 (100.0%) | 372 (100.0%) |
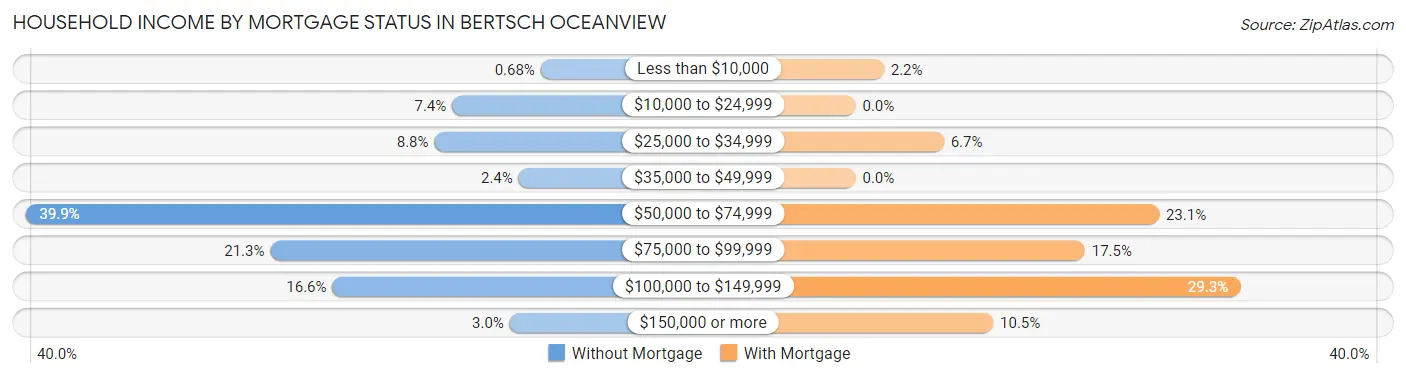
Household Income by Mortgage Status in Bertsch Oceanview
| Household Income | Without Mortgage | With Mortgage |
| Less than $10,000 | 2 (0.7%) | 8 (2.1%) |
| $10,000 to $24,999 | 22 (7.4%) | 0 (0.0%) |
| $25,000 to $34,999 | 26 (8.8%) | 25 (6.7%) |
| $35,000 to $49,999 | 7 (2.4%) | 0 (0.0%) |
| $50,000 to $74,999 | 118 (39.9%) | 86 (23.1%) |
| $75,000 to $99,999 | 63 (21.3%) | 65 (17.5%) |
| $100,000 to $149,999 | 49 (16.6%) | 109 (29.3%) |
| $150,000 or more | 9 (3.0%) | 39 (10.5%) |
| Total | 296 (100.0%) | 372 (100.0%) |
Property Value to Household Income Ratio in Bertsch Oceanview
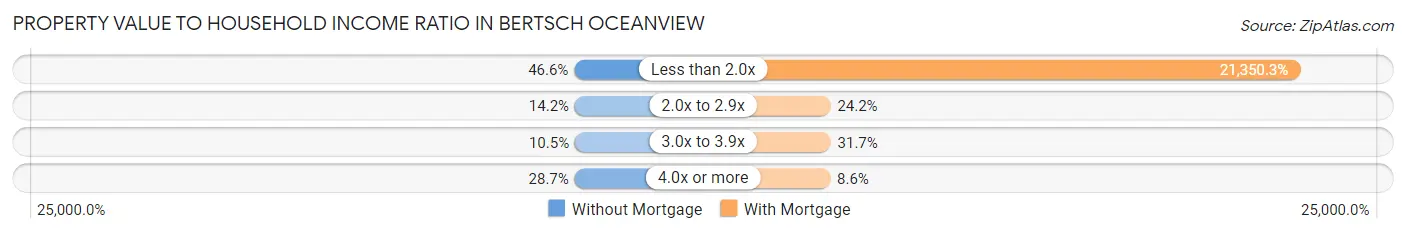
| Value-to-Income Ratio | Without Mortgage | With Mortgage |
| Less than 2.0x | 138 (46.6%) | 79,423 (21,350.3%) |
| 2.0x to 2.9x | 42 (14.2%) | 90 (24.2%) |
| 3.0x to 3.9x | 31 (10.5%) | 118 (31.7%) |
| 4.0x or more | 85 (28.7%) | 32 (8.6%) |
| Total | 296 (100.0%) | 372 (100.0%) |
Real Estate Taxes by Mortgage Status in Bertsch Oceanview
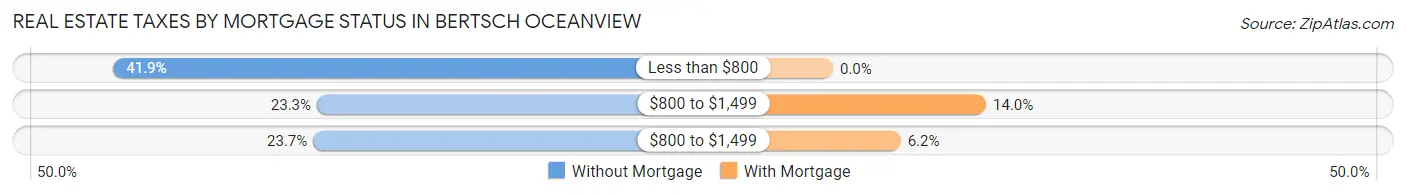
| Property Taxes | Without Mortgage | With Mortgage |
| Less than $800 | 124 (41.9%) | 0 (0.0%) |
| $800 to $1,499 | 69 (23.3%) | 52 (14.0%) |
| $800 to $1,499 | 70 (23.6%) | 23 (6.2%) |
| Total | 296 (100.0%) | 372 (100.0%) |
Health & Disability in Bertsch Oceanview
Health Insurance Coverage by Age in Bertsch Oceanview
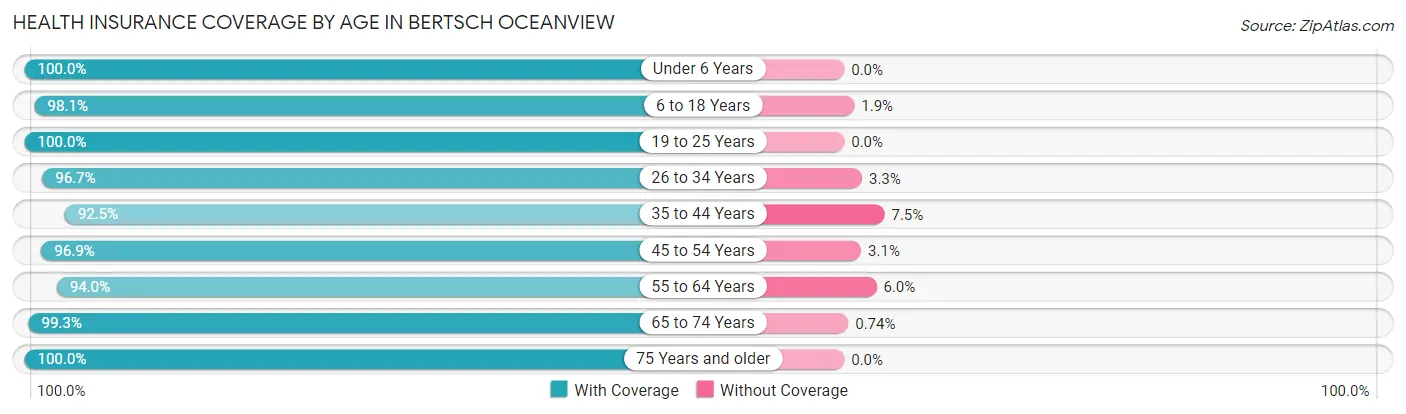
| Age Bracket | With Coverage | Without Coverage |
| Under 6 Years | 157 (100.0%) | 0 (0.0%) |
| 6 to 18 Years | 469 (98.1%) | 9 (1.9%) |
| 19 to 25 Years | 261 (100.0%) | 0 (0.0%) |
| 26 to 34 Years | 146 (96.7%) | 5 (3.3%) |
| 35 to 44 Years | 160 (92.5%) | 13 (7.5%) |
| 45 to 54 Years | 308 (96.9%) | 10 (3.1%) |
| 55 to 64 Years | 219 (94.0%) | 14 (6.0%) |
| 65 to 74 Years | 270 (99.3%) | 2 (0.7%) |
| 75 Years and older | 179 (100.0%) | 0 (0.0%) |
| Total | 2,169 (97.6%) | 53 (2.4%) |
Health Insurance Coverage by Citizenship Status in Bertsch Oceanview
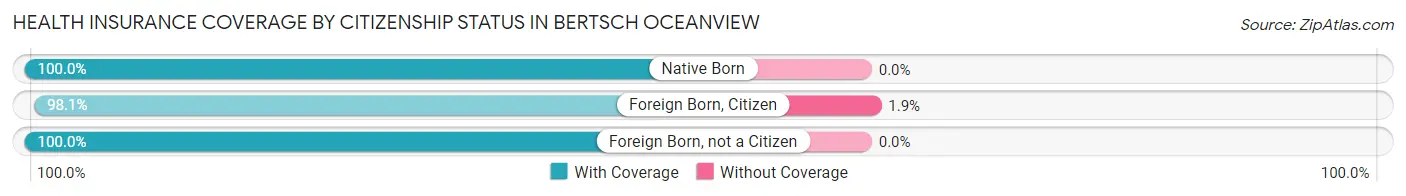
| Citizenship Status | With Coverage | Without Coverage |
| Native Born | 157 (100.0%) | 0 (0.0%) |
| Foreign Born, Citizen | 469 (98.1%) | 9 (1.9%) |
| Foreign Born, not a Citizen | 261 (100.0%) | 0 (0.0%) |
Health Insurance Coverage by Household Income in Bertsch Oceanview
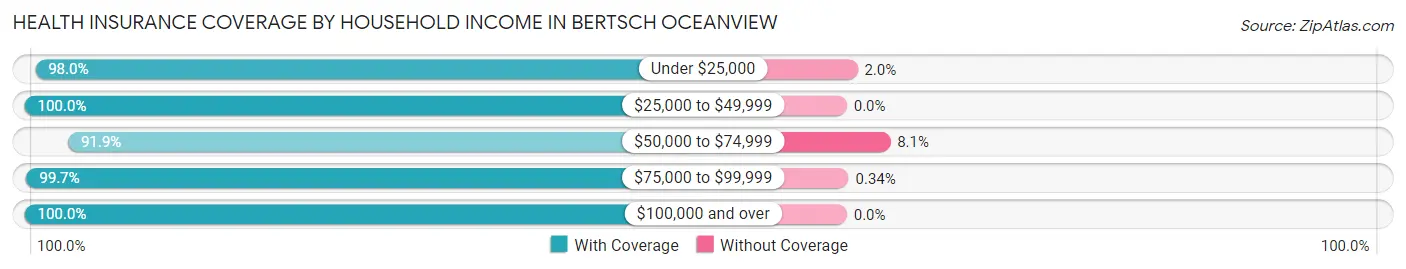
| Household Income | With Coverage | Without Coverage |
| Under $25,000 | 98 (98.0%) | 2 (2.0%) |
| $25,000 to $49,999 | 347 (100.0%) | 0 (0.0%) |
| $50,000 to $74,999 | 554 (91.9%) | 49 (8.1%) |
| $75,000 to $99,999 | 587 (99.7%) | 2 (0.3%) |
| $100,000 and over | 583 (100.0%) | 0 (0.0%) |
Public vs Private Health Insurance Coverage by Age in Bertsch Oceanview
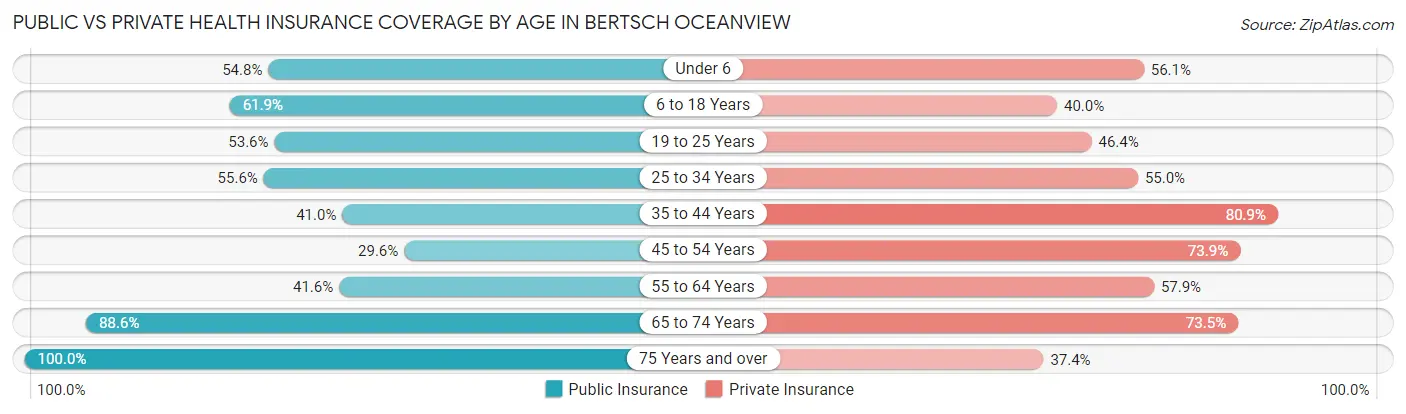
| Age Bracket | Public Insurance | Private Insurance |
| Under 6 | 86 (54.8%) | 88 (56.0%) |
| 6 to 18 Years | 296 (61.9%) | 191 (40.0%) |
| 19 to 25 Years | 140 (53.6%) | 121 (46.4%) |
| 25 to 34 Years | 84 (55.6%) | 83 (55.0%) |
| 35 to 44 Years | 71 (41.0%) | 140 (80.9%) |
| 45 to 54 Years | 94 (29.6%) | 235 (73.9%) |
| 55 to 64 Years | 97 (41.6%) | 135 (57.9%) |
| 65 to 74 Years | 241 (88.6%) | 200 (73.5%) |
| 75 Years and over | 179 (100.0%) | 67 (37.4%) |
| Total | 1,288 (58.0%) | 1,260 (56.7%) |
Disability Status by Sex by Age in Bertsch Oceanview

| Age Bracket | Male | Female |
| Under 5 Years | 0 (0.0%) | 0 (0.0%) |
| 5 to 17 Years | 24 (9.3%) | 4 (2.4%) |
| 18 to 34 Years | 0 (0.0%) | 85 (24.3%) |
| 35 to 64 Years | 45 (10.3%) | 27 (9.4%) |
| 65 to 74 Years | 25 (20.2%) | 36 (24.3%) |
| 75 Years and over | 11 (14.1%) | 74 (73.3%) |
Disability Class by Sex by Age in Bertsch Oceanview
Disability Class: Hearing Difficulty
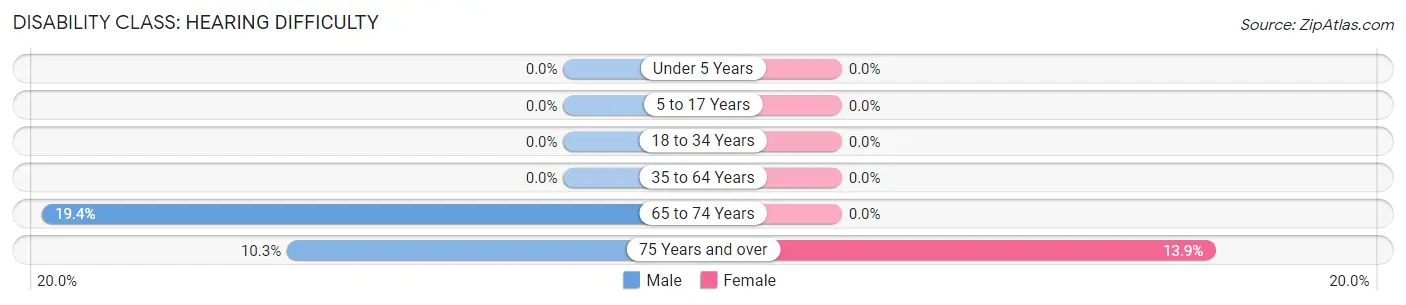
| Age Bracket | Male | Female |
| Under 5 Years | 0 (0.0%) | 0 (0.0%) |
| 5 to 17 Years | 0 (0.0%) | 0 (0.0%) |
| 18 to 34 Years | 0 (0.0%) | 0 (0.0%) |
| 35 to 64 Years | 0 (0.0%) | 0 (0.0%) |
| 65 to 74 Years | 24 (19.4%) | 0 (0.0%) |
| 75 Years and over | 8 (10.3%) | 14 (13.9%) |
Disability Class: Vision Difficulty
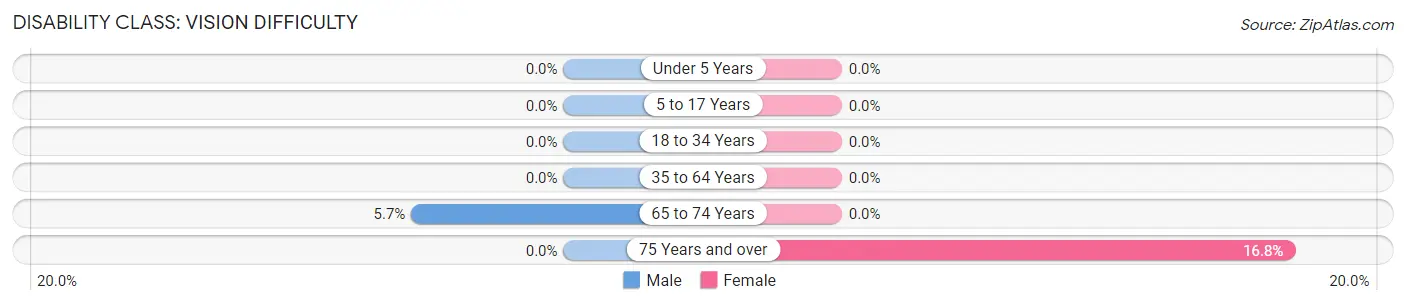
| Age Bracket | Male | Female |
| Under 5 Years | 0 (0.0%) | 0 (0.0%) |
| 5 to 17 Years | 0 (0.0%) | 0 (0.0%) |
| 18 to 34 Years | 0 (0.0%) | 0 (0.0%) |
| 35 to 64 Years | 0 (0.0%) | 0 (0.0%) |
| 65 to 74 Years | 7 (5.7%) | 0 (0.0%) |
| 75 Years and over | 0 (0.0%) | 17 (16.8%) |
Disability Class: Cognitive Difficulty
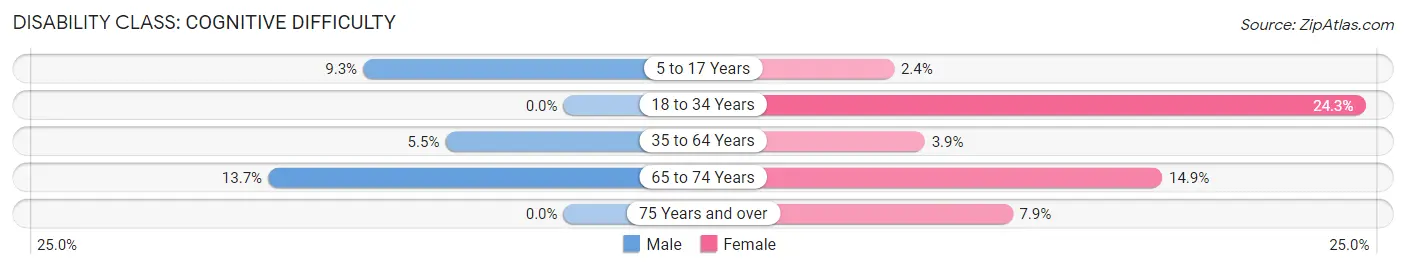
| Age Bracket | Male | Female |
| 5 to 17 Years | 24 (9.3%) | 4 (2.4%) |
| 18 to 34 Years | 0 (0.0%) | 85 (24.3%) |
| 35 to 64 Years | 24 (5.5%) | 11 (3.8%) |
| 65 to 74 Years | 17 (13.7%) | 22 (14.9%) |
| 75 Years and over | 0 (0.0%) | 8 (7.9%) |
Disability Class: Ambulatory Difficulty
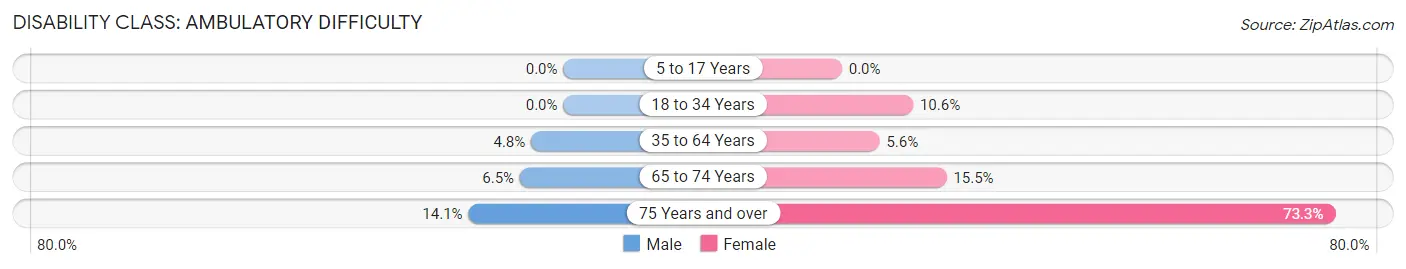
| Age Bracket | Male | Female |
| 5 to 17 Years | 0 (0.0%) | 0 (0.0%) |
| 18 to 34 Years | 0 (0.0%) | 37 (10.6%) |
| 35 to 64 Years | 21 (4.8%) | 16 (5.6%) |
| 65 to 74 Years | 8 (6.5%) | 23 (15.5%) |
| 75 Years and over | 11 (14.1%) | 74 (73.3%) |
Disability Class: Self-Care Difficulty
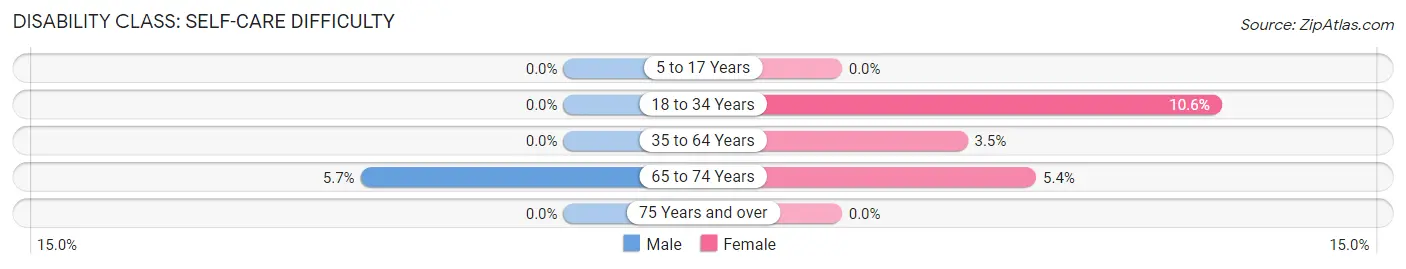
| Age Bracket | Male | Female |
| 5 to 17 Years | 0 (0.0%) | 0 (0.0%) |
| 18 to 34 Years | 0 (0.0%) | 37 (10.6%) |
| 35 to 64 Years | 0 (0.0%) | 10 (3.5%) |
| 65 to 74 Years | 7 (5.7%) | 8 (5.4%) |
| 75 Years and over | 0 (0.0%) | 0 (0.0%) |
Technology Access in Bertsch Oceanview
Computing Device Access in Bertsch Oceanview
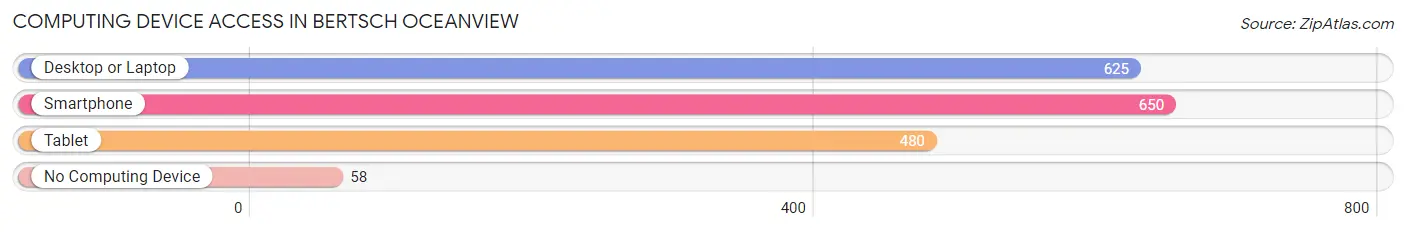
| Device Type | # Households | % Households |
| Desktop or Laptop | 625 | 75.6% |
| Smartphone | 650 | 78.6% |
| Tablet | 480 | 58.0% |
| No Computing Device | 58 | 7.0% |
| Total | 827 | 100.0% |
Internet Access in Bertsch Oceanview
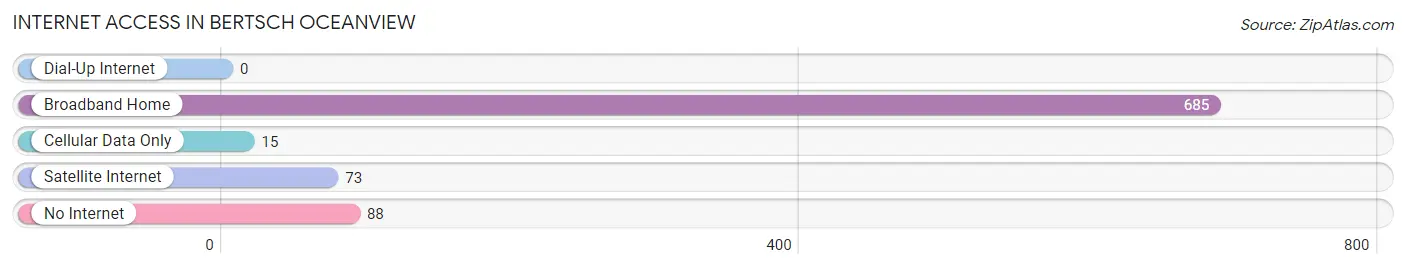
| Internet Type | # Households | % Households |
| Dial-Up Internet | 0 | 0.0% |
| Broadband Home | 685 | 82.8% |
| Cellular Data Only | 15 | 1.8% |
| Satellite Internet | 73 | 8.8% |
| No Internet | 88 | 10.6% |
| Total | 827 | 100.0% |
Bertsch Oceanview Summary
Bertsch Oceanview is a small unincorporated community located in Humboldt County, California. It is situated on the Pacific Coast, approximately 10 miles south of the city of Eureka. The community is bordered by the Pacific Ocean to the west, the Eel River to the north, and the Redwood National and State Parks to the east. The population of Bertsch Oceanview was estimated to be 1,845 in 2019.
History
The area now known as Bertsch Oceanview was originally inhabited by the Wiyot people, who lived in the area for thousands of years before the arrival of European settlers. The first European settlers arrived in the area in the late 1800s, and the community was officially established in 1892. The community was named after the Bertsch family, who were among the first settlers in the area.
Geography
Bertsch Oceanview is located in the coastal region of Humboldt County, California. It is situated on the Pacific Coast, approximately 10 miles south of the city of Eureka. The community is bordered by the Pacific Ocean to the west, the Eel River to the north, and the Redwood National and State Parks to the east. The climate in Bertsch Oceanview is mild and temperate, with average temperatures ranging from the mid-50s to the mid-70s throughout the year.
Economy
The economy of Bertsch Oceanview is largely based on tourism and fishing. The community is home to several popular tourist attractions, including the Redwood National and State Parks, the Eel River, and the Pacific Coast. Fishing is also a major industry in the area, with many local businesses offering fishing charters and other services. Additionally, the community is home to several small businesses, including restaurants, shops, and lodging.
Demographics
As of 2019, the population of Bertsch Oceanview was estimated to be 1,845. The racial makeup of the community is predominantly white (83.3%), with smaller percentages of Hispanic (7.2%), Asian (3.2%), and African American (2.2%) residents. The median household income in Bertsch Oceanview is $50,945, and the median age is 44.7 years. The majority of the population (90.2%) is over the age of 18, and the unemployment rate is 4.2%.
Common Questions
What is Per Capita Income in Bertsch Oceanview?
Per Capita income in Bertsch Oceanview is $29,875.
What is the Median Family Income in Bertsch Oceanview?
Median Family Income in Bertsch Oceanview is $82,000.
What is the Median Household income in Bertsch Oceanview?
Median Household Income in Bertsch Oceanview is $67,250.
What is Inequality or Gini Index in Bertsch Oceanview?
Inequality or Gini Index in Bertsch Oceanview is 0.34.
What is the Total Population of Bertsch Oceanview?
Total Population of Bertsch Oceanview is 2,222.
What is the Total Male Population of Bertsch Oceanview?
Total Male Population of Bertsch Oceanview is 1,105.
What is the Total Female Population of Bertsch Oceanview?
Total Female Population of Bertsch Oceanview is 1,117.
What is the Ratio of Males per 100 Females in Bertsch Oceanview?
There are 98.93 Males per 100 Females in Bertsch Oceanview.
What is the Ratio of Females per 100 Males in Bertsch Oceanview?
There are 101.09 Females per 100 Males in Bertsch Oceanview.
What is the Median Population Age in Bertsch Oceanview?
Median Population Age in Bertsch Oceanview is 39.8 Years.
What is the Average Family Size in Bertsch Oceanview
Average Family Size in Bertsch Oceanview is 3.1 People.
What is the Average Household Size in Bertsch Oceanview
Average Household Size in Bertsch Oceanview is 2.7 People.
How Large is the Labor Force in Bertsch Oceanview?
There are 1,092 People in the Labor Forcein in Bertsch Oceanview.
What is the Percentage of People in the Labor Force in Bertsch Oceanview?
64.6% of People are in the Labor Force in Bertsch Oceanview.
What is the Unemployment Rate in Bertsch Oceanview?
Unemployment Rate in Bertsch Oceanview is 5.0%.