Wisconsin Map & Demographics
Wisconsin Map
Wisconsin Overview
May 29, 1848
INCORPORATED
65,496
TOTAL AREA [ SQ MI ]
54,154
LAND AREA [ SQ MI ]
11,342
WATER AREA [ SQ MI ]
1,050
ELEVATION AVG [ FT ]
1,951
ELEVATION HIGH [ FT ]
581
ELEVATION LOW [ FT ]
108.6
POP DENSITY [ PPL / SQ MI ]
$40,130
PER CAPITA INCOME
$92,974
AVG FAMILY INCOME
$72,458
AVG HOUSEHOLD INCOME
29.4%
WAGE / INCOME GAP [ % ]
70.6¢/ $1
WAGE / INCOME GAP [ $ ]
$10,543
FAMILY INCOME DEFICIT
0.44
INEQUALITY / GINI INDEX
53215
LARGEST ZIP CODE
Milwaukee
LARGEST CITY
Milwaukee County
LARGEST COUNTY
5,882,128
TOTAL POPULATION
2,948,762
MALE POPULATION
2,933,366
FEMALE POPULATION
100.52
MALES / 100 FEMALES
99.48
FEMALES / 100 MALES
39.9
MEDIAN AGE
3.0
AVG FAMILY SIZE
2.4
AVG HOUSEHOLD SIZE
3,130,460
LABOR FORCE [ PEOPLE ]
65.7%
PERCENT IN LABOR FORCE
3.4%
UNEMPLOYMENT RATE
Income in Wisconsin
Income Overview in Wisconsin
Per Capita Income in Wisconsin is $40,130, while median incomes of families and households are $92,974 and $72,458 respectively.
| Characteristic | Number | Measure |
| Per Capita Income | 5,882,128 | $40,130 |
| Median Family Income | 1,488,300 | $92,974 |
| Mean Family Income | 1,488,300 | $115,460 |
| Median Household Income | 2,425,488 | $72,458 |
| Mean Household Income | 2,425,488 | $94,995 |
| Income Deficit | 1,488,300 | $10,543 |
| Wage / Income Gap (%) | 5,882,128 | 29.41% |
| Wage / Income Gap ($) | 5,882,128 | 70.59¢ per $1 |
| Gini / Inequality Index | 5,882,128 | 0.44 |
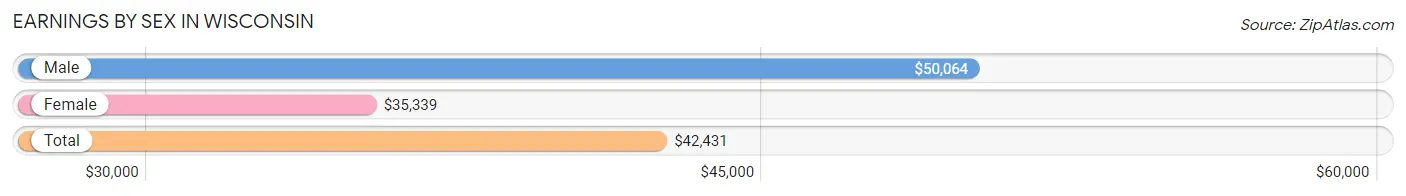
Earnings by Sex in Wisconsin
Average Earnings in Wisconsin are $42,431, $50,064 for men and $35,339 for women, a difference of 29.4%.
| Sex | Number | Average Earnings |
| Male | 1,743,020 (52.5%) | $50,064 |
| Female | 1,577,736 (47.5%) | $35,339 |
| Total | 3,320,756 (100.0%) | $42,431 |
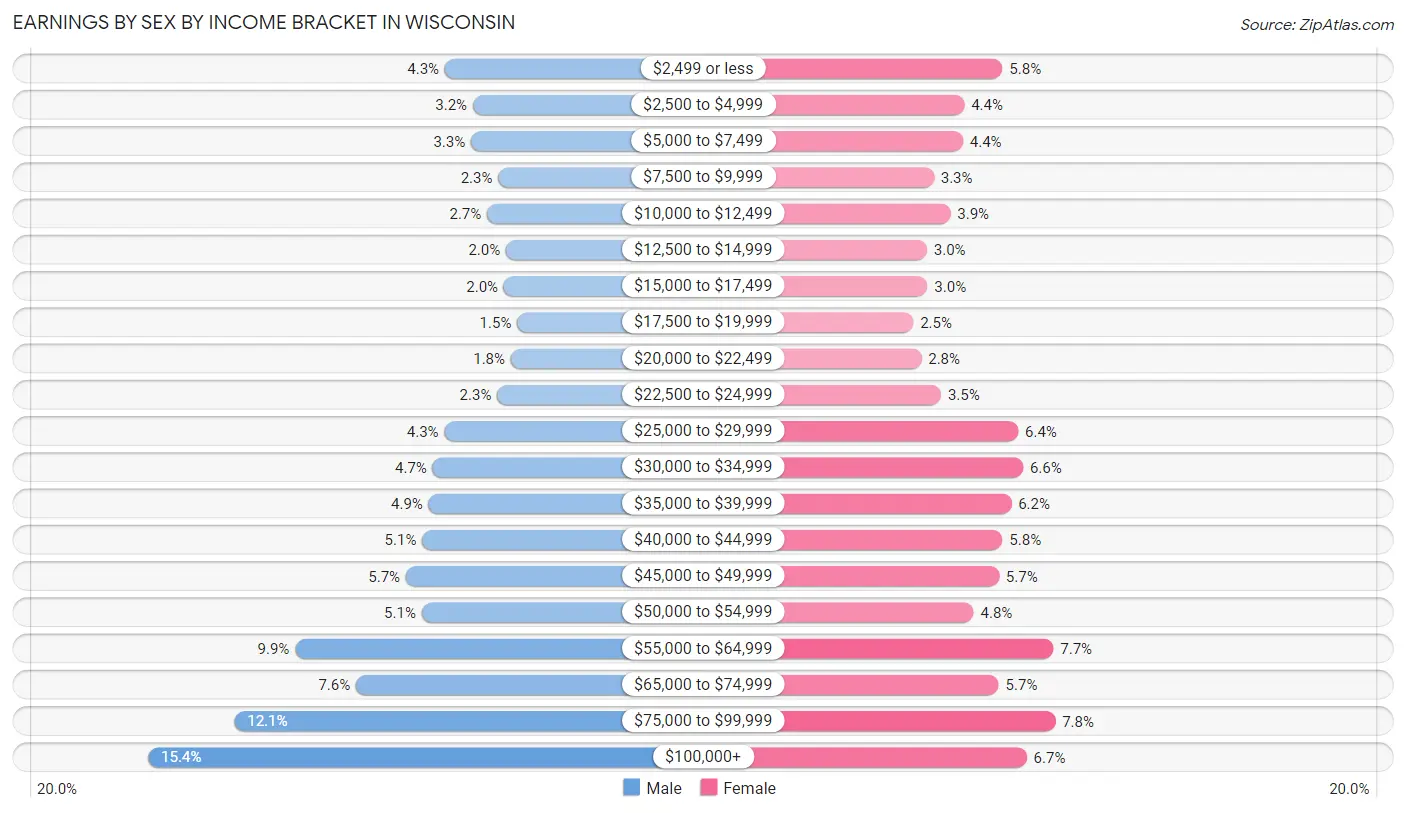
Earnings by Sex by Income Bracket in Wisconsin
The most common earnings brackets in Wisconsin are $100,000+ for men (267,817 | 15.4%) and $75,000 to $99,999 for women (123,264 | 7.8%).
| Income | Male | Female |
| $2,499 or less | 74,046 (4.3%) | 91,959 (5.8%) |
| $2,500 to $4,999 | 55,746 (3.2%) | 69,413 (4.4%) |
| $5,000 to $7,499 | 57,069 (3.3%) | 68,704 (4.3%) |
| $7,500 to $9,999 | 39,268 (2.2%) | 51,416 (3.3%) |
| $10,000 to $12,499 | 46,580 (2.7%) | 61,205 (3.9%) |
| $12,500 to $14,999 | 34,233 (2.0%) | 47,397 (3.0%) |
| $15,000 to $17,499 | 35,590 (2.0%) | 47,644 (3.0%) |
| $17,500 to $19,999 | 26,924 (1.5%) | 39,250 (2.5%) |
| $20,000 to $22,499 | 31,101 (1.8%) | 43,967 (2.8%) |
| $22,500 to $24,999 | 39,953 (2.3%) | 55,661 (3.5%) |
| $25,000 to $29,999 | 74,380 (4.3%) | 101,231 (6.4%) |
| $30,000 to $34,999 | 82,053 (4.7%) | 104,104 (6.6%) |
| $35,000 to $39,999 | 84,792 (4.9%) | 97,204 (6.2%) |
| $40,000 to $44,999 | 88,937 (5.1%) | 92,041 (5.8%) |
| $45,000 to $49,999 | 99,612 (5.7%) | 89,967 (5.7%) |
| $50,000 to $54,999 | 89,314 (5.1%) | 74,982 (4.8%) |
| $55,000 to $64,999 | 171,876 (9.9%) | 122,082 (7.7%) |
| $65,000 to $74,999 | 132,066 (7.6%) | 89,839 (5.7%) |
| $75,000 to $99,999 | 211,663 (12.1%) | 123,264 (7.8%) |
| $100,000+ | 267,817 (15.4%) | 106,406 (6.7%) |
| Total | 1,743,020 (100.0%) | 1,577,736 (100.0%) |
Earnings by Sex by Educational Attainment in Wisconsin
Average earnings in Wisconsin are $56,814 for men and $41,340 for women, a difference of 27.2%. Men with an educational attainment of graduate degree enjoy the highest average annual earnings of $91,425, while those with less than high school education earn the least with $39,363. Women with an educational attainment of graduate degree earn the most with the average annual earnings of $68,128, while those with less than high school education have the smallest earnings of $25,150.

| Educational Attainment | Male Income | Female Income |
| Less than High School | $39,363 | $25,150 |
| High School Diploma | $46,409 | $30,546 |
| College or Associate's Degree | $55,702 | $37,376 |
| Bachelor's Degree | $74,563 | $53,015 |
| Graduate Degree | $91,425 | $68,128 |
| Total | $56,814 | $41,340 |
Family Income in Wisconsin
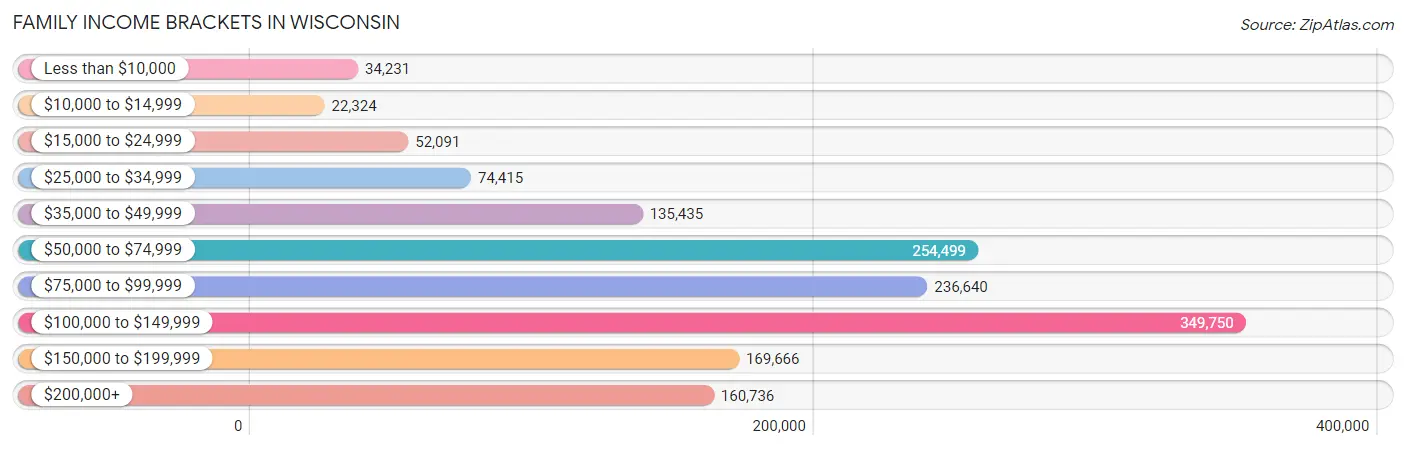
Family Income Brackets in Wisconsin
According to the Wisconsin family income data, there are 349,750 families falling into the $100,000 to $149,999 income range, which is the most common income bracket and makes up 23.5% of all families. Conversely, the $10,000 to $14,999 income bracket is the least frequent group with only 22,324 families (1.5%) belonging to this category.
| Income Bracket | # Families | % Families |
| Less than $10,000 | 34,231 | 2.3% |
| $10,000 to $14,999 | 22,324 | 1.5% |
| $15,000 to $24,999 | 52,091 | 3.5% |
| $25,000 to $34,999 | 74,415 | 5.0% |
| $35,000 to $49,999 | 135,435 | 9.1% |
| $50,000 to $74,999 | 254,499 | 17.1% |
| $75,000 to $99,999 | 236,640 | 15.9% |
| $100,000 to $149,999 | 349,750 | 23.5% |
| $150,000 to $199,999 | 169,666 | 11.4% |
| $200,000+ | 160,736 | 10.8% |
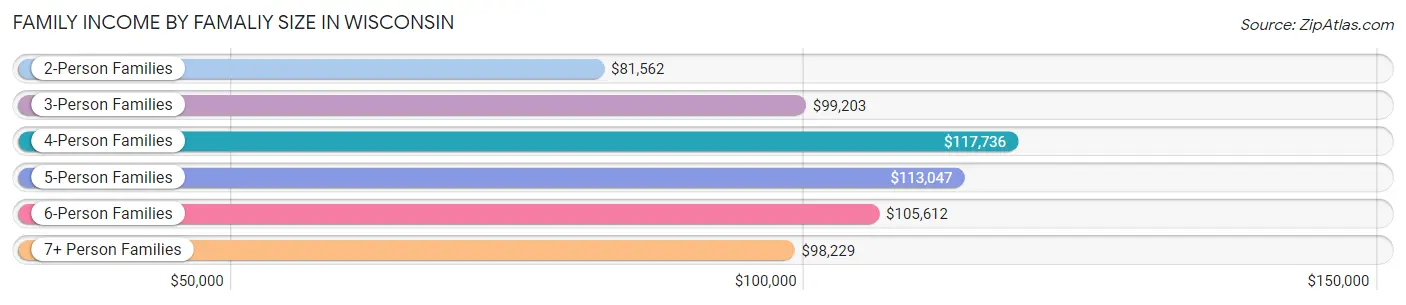
Family Income by Famaliy Size in Wisconsin
4-person families (246,644 | 16.6%) account for the highest median family income in Wisconsin with $117,736 per family, while 2-person families (786,164 | 52.8%) have the highest median income of $40,781 per family member.
| Income Bracket | # Families | Median Income |
| 2-Person Families | 786,164 (52.8%) | $81,562 |
| 3-Person Families | 294,664 (19.8%) | $99,203 |
| 4-Person Families | 246,644 (16.6%) | $117,736 |
| 5-Person Families | 103,962 (7.0%) | $113,047 |
| 6-Person Families | 37,090 (2.5%) | $105,612 |
| 7+ Person Families | 19,776 (1.3%) | $98,229 |
| Total | 1,488,300 (100.0%) | $92,974 |
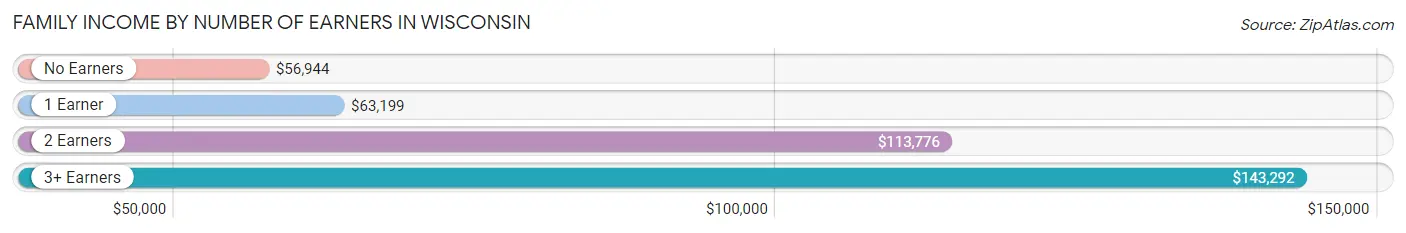
Family Income by Number of Earners in Wisconsin
The median family income in Wisconsin is $92,974, with families comprising 3+ earners (173,115) having the highest median family income of $143,292, while families with no earners (234,094) have the lowest median family income of $56,944, accounting for 11.6% and 15.7% of families, respectively.
| Number of Earners | # Families | Median Income |
| No Earners | 234,094 (15.7%) | $56,944 |
| 1 Earner | 422,633 (28.4%) | $63,199 |
| 2 Earners | 658,458 (44.2%) | $113,776 |
| 3+ Earners | 173,115 (11.6%) | $143,292 |
| Total | 1,488,300 (100.0%) | $92,974 |
Household Income in Wisconsin
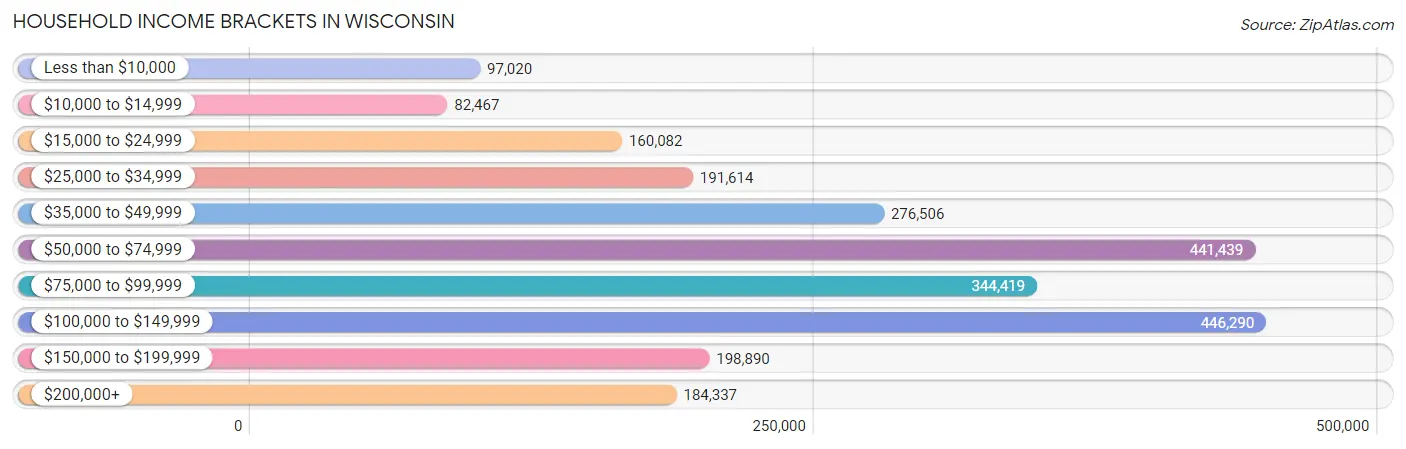
Household Income Brackets in Wisconsin
With 446,290 households falling in the category, the $100,000 to $149,999 income range is the most frequent in Wisconsin, accounting for 18.4% of all households. In contrast, only 82,467 households (3.4%) fall into the $10,000 to $14,999 income bracket, making it the least populous group.
| Income Bracket | # Households | % Households |
| Less than $10,000 | 97,020 | 4.0% |
| $10,000 to $14,999 | 82,467 | 3.4% |
| $15,000 to $24,999 | 160,082 | 6.6% |
| $25,000 to $34,999 | 191,614 | 7.9% |
| $35,000 to $49,999 | 276,506 | 11.4% |
| $50,000 to $74,999 | 441,439 | 18.2% |
| $75,000 to $99,999 | 344,419 | 14.2% |
| $100,000 to $149,999 | 446,290 | 18.4% |
| $150,000 to $199,999 | 198,890 | 8.2% |
| $200,000+ | 184,337 | 7.6% |
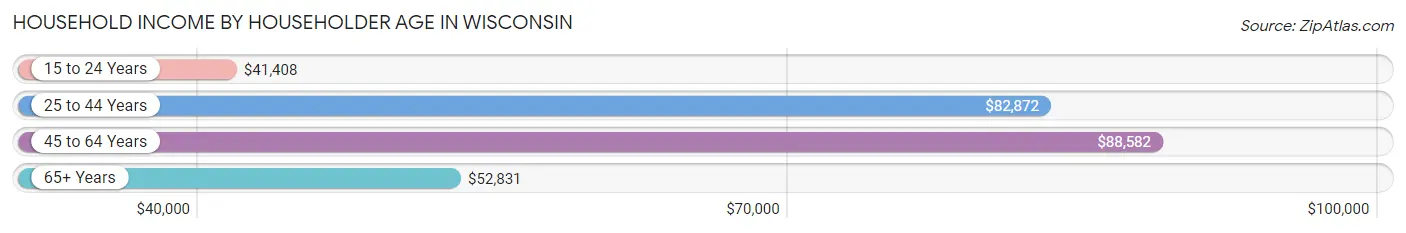
Household Income by Householder Age in Wisconsin
The median household income in Wisconsin is $72,458, with the highest median household income of $88,582 found in the 45 to 64 years age bracket for the primary householder. A total of 887,921 households (36.6%) fall into this category. Meanwhile, the 15 to 24 years age bracket for the primary householder has the lowest median household income of $41,408, with 117,504 households (4.8%) in this group.
| Income Bracket | # Households | Median Income |
| 15 to 24 Years | 117,504 (4.8%) | $41,408 |
| 25 to 44 Years | 752,525 (31.0%) | $82,872 |
| 45 to 64 Years | 887,921 (36.6%) | $88,582 |
| 65+ Years | 667,538 (27.5%) | $52,831 |
| Total | 2,425,488 (100.0%) | $72,458 |
Poverty in Wisconsin
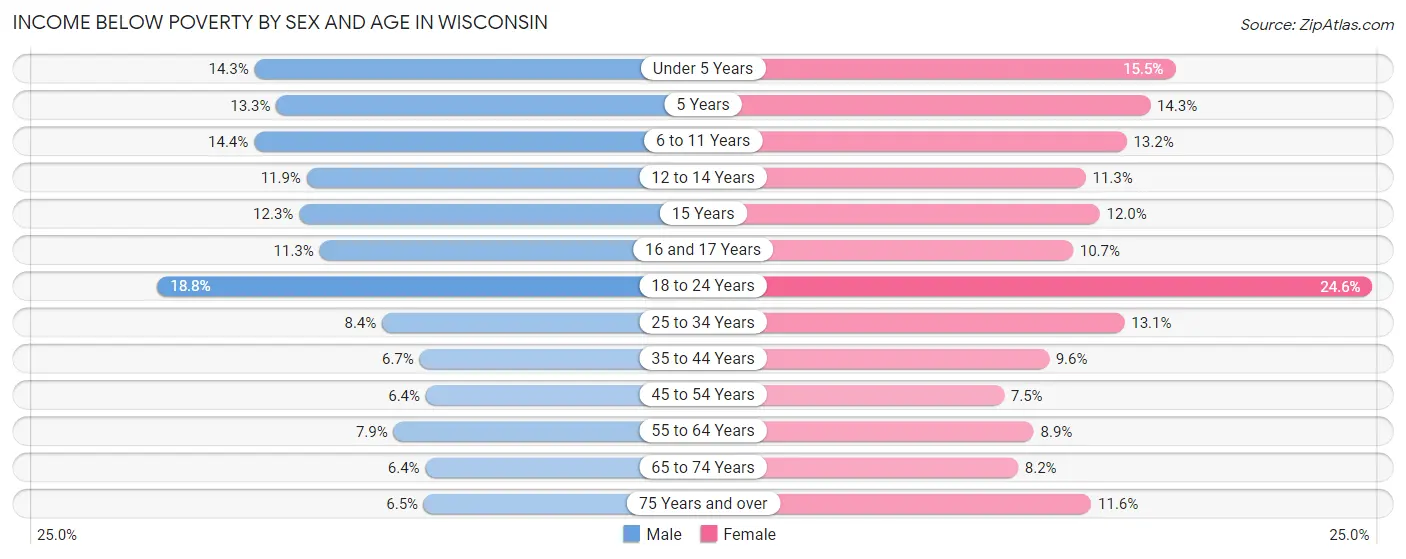
Income Below Poverty by Sex and Age in Wisconsin
With 9.6% poverty level for males and 11.7% for females among the residents of Wisconsin, 18 to 24 year old males and 18 to 24 year old females are the most vulnerable to poverty, with 49,168 males (18.8%) and 60,423 females (24.6%) in their respective age groups living below the poverty level.
| Age Bracket | Male | Female |
| Under 5 Years | 23,183 (14.3%) | 23,872 (15.5%) |
| 5 Years | 4,587 (13.3%) | 4,714 (14.3%) |
| 6 to 11 Years | 30,724 (14.3%) | 26,987 (13.2%) |
| 12 to 14 Years | 13,421 (11.9%) | 11,923 (11.3%) |
| 15 Years | 4,748 (12.3%) | 4,532 (12.0%) |
| 16 and 17 Years | 8,793 (11.3%) | 7,854 (10.7%) |
| 18 to 24 Years | 49,168 (18.8%) | 60,423 (24.6%) |
| 25 to 34 Years | 30,902 (8.4%) | 46,537 (13.1%) |
| 35 to 44 Years | 24,434 (6.7%) | 34,237 (9.6%) |
| 45 to 54 Years | 22,959 (6.4%) | 26,279 (7.5%) |
| 55 to 64 Years | 32,377 (7.9%) | 36,706 (8.9%) |
| 65 to 74 Years | 19,174 (6.4%) | 25,490 (8.2%) |
| 75 Years and over | 10,943 (6.5%) | 26,694 (11.6%) |
| Total | 275,413 (9.6%) | 336,248 (11.7%) |
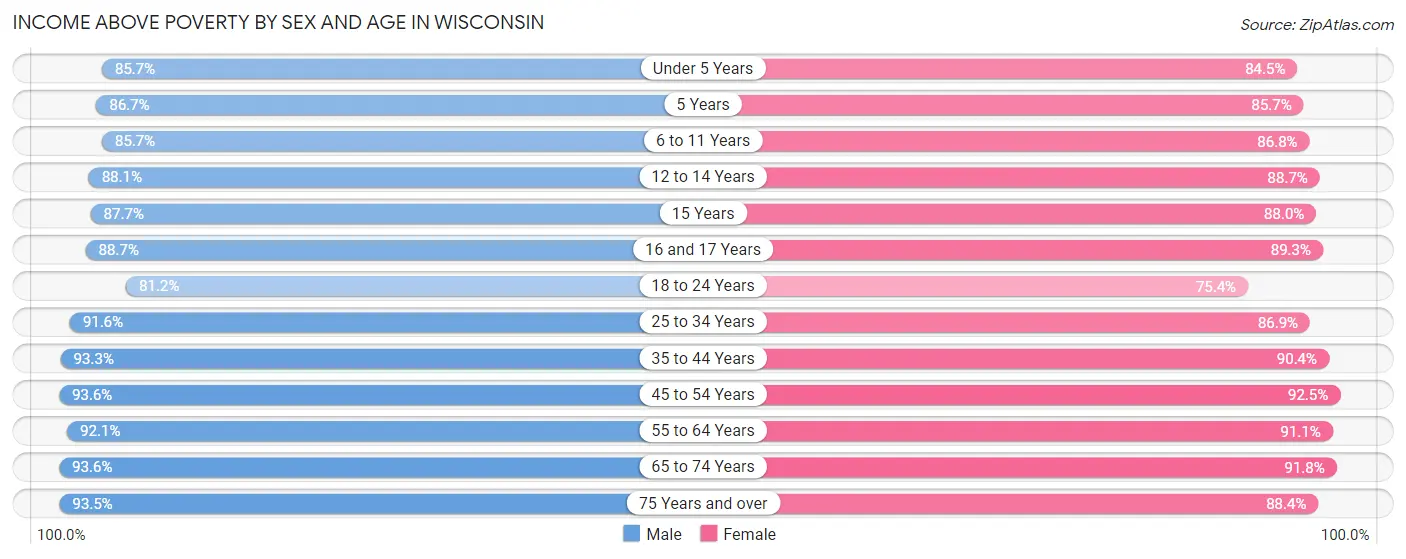
Income Above Poverty by Sex and Age in Wisconsin
According to the poverty statistics in Wisconsin, males aged 45 to 54 years and females aged 45 to 54 years are the age groups that are most secure financially, with 93.6% of males and 92.5% of females in these age groups living above the poverty line.
| Age Bracket | Male | Female |
| Under 5 Years | 138,645 (85.7%) | 130,472 (84.5%) |
| 5 Years | 29,839 (86.7%) | 28,256 (85.7%) |
| 6 to 11 Years | 183,308 (85.7%) | 177,263 (86.8%) |
| 12 to 14 Years | 99,279 (88.1%) | 93,477 (88.7%) |
| 15 Years | 33,985 (87.7%) | 33,351 (88.0%) |
| 16 and 17 Years | 68,946 (88.7%) | 65,423 (89.3%) |
| 18 to 24 Years | 211,856 (81.2%) | 185,007 (75.4%) |
| 25 to 34 Years | 336,725 (91.6%) | 308,415 (86.9%) |
| 35 to 44 Years | 341,691 (93.3%) | 322,399 (90.4%) |
| 45 to 54 Years | 337,067 (93.6%) | 323,239 (92.5%) |
| 55 to 64 Years | 378,502 (92.1%) | 375,530 (91.1%) |
| 65 to 74 Years | 280,267 (93.6%) | 286,451 (91.8%) |
| 75 Years and over | 158,123 (93.5%) | 203,987 (88.4%) |
| Total | 2,598,233 (90.4%) | 2,533,270 (88.3%) |
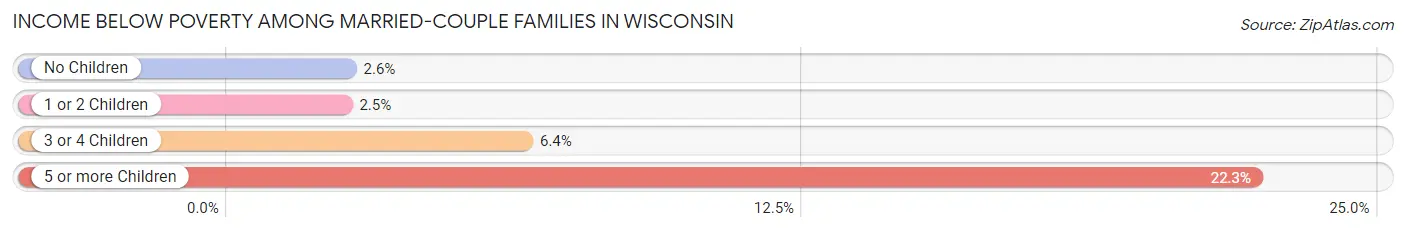
Income Below Poverty Among Married-Couple Families in Wisconsin
The poverty statistics for married-couple families in Wisconsin show that 3.0% or 35,130 of the total 1,152,787 families live below the poverty line. Families with 5 or more children have the highest poverty rate of 22.3%, comprising of 2,344 families. On the other hand, families with 1 or 2 children have the lowest poverty rate of 2.5%, which includes 8,053 families.
| Children | Above Poverty | Below Poverty |
| No Children | 707,023 (97.4%) | 18,732 (2.6%) |
| 1 or 2 Children | 315,055 (97.5%) | 8,053 (2.5%) |
| 3 or 4 Children | 87,413 (93.6%) | 6,001 (6.4%) |
| 5 or more Children | 8,166 (77.7%) | 2,344 (22.3%) |
| Total | 1,117,657 (97.0%) | 35,130 (3.0%) |
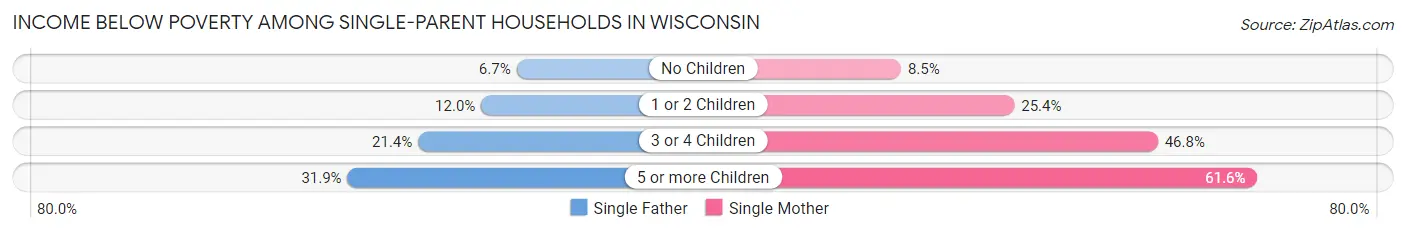
Income Below Poverty Among Single-Parent Households in Wisconsin
According to the poverty data in Wisconsin, 10.8% or 11,946 single-father households and 22.6% or 50,996 single-mother households are living below the poverty line. Among single-father households, those with 5 or more children have the highest poverty rate, with 236 households (31.9%) experiencing poverty. Likewise, among single-mother households, those with 5 or more children have the highest poverty rate, with 1,507 households (61.6%) falling below the poverty line.
| Children | Single Father | Single Mother |
| No Children | 2,857 (6.7%) | 6,498 (8.5%) |
| 1 or 2 Children | 6,871 (12.0%) | 30,660 (25.4%) |
| 3 or 4 Children | 1,982 (21.4%) | 12,331 (46.8%) |
| 5 or more Children | 236 (31.9%) | 1,507 (61.6%) |
| Total | 11,946 (10.8%) | 50,996 (22.6%) |
Income Below Poverty Among Married-Couple vs Single-Parent Households in Wisconsin
The poverty data for Wisconsin shows that 35,130 of the married-couple family households (3.0%) and 62,942 of the single-parent households (18.8%) are living below the poverty level. Within the married-couple family households, those with 5 or more children have the highest poverty rate, with 2,344 households (22.3%) falling below the poverty line. Among the single-parent households, those with 5 or more children have the highest poverty rate, with 1,743 household (54.7%) living below poverty.
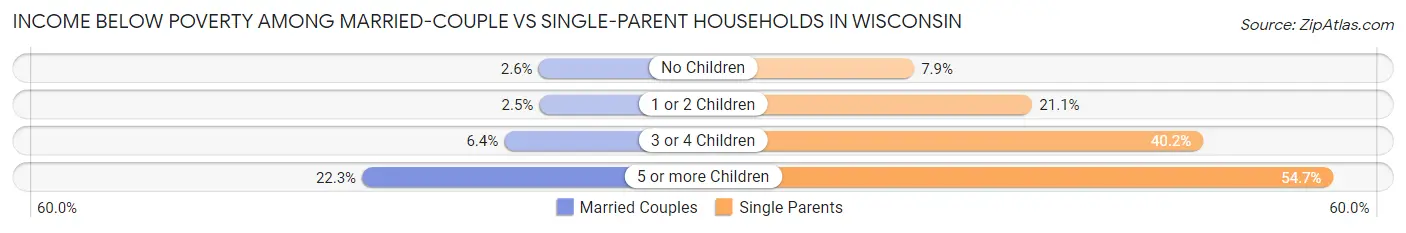
| Children | Married-Couple Families | Single-Parent Households |
| No Children | 18,732 (2.6%) | 9,355 (7.9%) |
| 1 or 2 Children | 8,053 (2.5%) | 37,531 (21.1%) |
| 3 or 4 Children | 6,001 (6.4%) | 14,313 (40.2%) |
| 5 or more Children | 2,344 (22.3%) | 1,743 (54.7%) |
| Total | 35,130 (3.0%) | 62,942 (18.8%) |
Largest Zip Codes by Population in Wisconsin
The largest zip codes in Wisconsin by population are 53215 (59,400), 54601 (51,116), 53711 (49,749), 54115 (48,796), and 53511 (48,749).
1.53215
59,400 (1.01%)
2.54601
51,116 (0.87%)
3.53711
49,749 (0.85%)
4.54115
48,796 (0.83%)
5.53511
48,749 (0.83%)
6.53704
47,079 (0.80%)
7.54956
46,539 (0.79%)
8.53209
46,441 (0.79%)
9.54915
43,815 (0.74%)
10.54703
43,618 (0.74%)
11.53590
43,423 (0.74%)
12.53081
43,042 (0.73%)
13.54935
42,498 (0.72%)
14.53218
41,775 (0.71%)
15.54701
41,559 (0.71%)
16.54313
40,653 (0.69%)
17.54220
40,562 (0.69%)
18.53204
39,203 (0.67%)
19.53221
39,066 (0.66%)
20.53051
38,639 (0.66%)
21.53703
37,944 (0.65%)
22.54901
37,327 (0.63%)
23.54311
37,187 (0.63%)
24.53066
36,973 (0.63%)
25.53154
36,286 (0.62%)
26.53132
36,094 (0.61%)
27.53402
35,296 (0.60%)
28.53219
35,223 (0.60%)
29.53214
34,892 (0.59%)
30.53211
34,775 (0.59%)
Largest Cities by Population in Wisconsin
The largest cities in Wisconsin by population are Milwaukee (573,299), Madison (268,516), Green Bay (106,846), Kenosha (99,493), and Racine (77,453).
573,299 (9.75%)
2.Madison
268,516 (4.56%)
106,846 (1.82%)
4.Kenosha
99,493 (1.69%)
5.Racine
77,453 (1.32%)
6.Appleton
75,133 (1.28%)
69,098 (1.17%)
8.Oshkosh
66,373 (1.13%)
65,669 (1.12%)
10.West Allis
59,907 (1.02%)
11.La Crosse
52,043 (0.88%)
12.Sheboygan
49,805 (0.85%)
13.Wauwatosa
47,919 (0.81%)
14.Fond Du Lac
44,527 (0.76%)
15.Brookfield
41,342 (0.70%)
16.New Berlin
40,387 (0.69%)
17.Wausau
39,906 (0.68%)
38,610 (0.66%)
19.Greenfield
37,521 (0.64%)
20.Beloit
36,642 (0.62%)
21.Franklin
36,513 (0.62%)
22.Oak Creek
36,286 (0.62%)
23.Sun Prairie
35,847 (0.61%)
24.Manitowoc
34,500 (0.59%)
25.West Bend
31,682 (0.54%)
26.Fitchburg
29,826 (0.51%)
27,640 (0.47%)
28.Neenah
27,309 (0.46%)
25,549 (0.43%)
30.De Pere
25,373 (0.43%)
Largest Counties by Population in Wisconsin
The largest counties in Wisconsin by population are Milwaukee County (933,063), Dane County (559,891), Waukesha County (407,290), Brown County (268,393), and Racine County (197,068).
933,063 (15.86%)
559,891 (9.52%)
407,290 (6.92%)
268,393 (4.56%)
197,068 (3.35%)
190,611 (3.24%)
171,197 (2.91%)
168,693 (2.87%)
163,817 (2.78%)
137,820 (2.34%)
136,842 (2.33%)
120,216 (2.04%)
117,741 (2.00%)
105,697 (1.80%)
105,127 (1.79%)
104,027 (1.77%)
93,752 (1.59%)
91,745 (1.56%)
19.Dodge County
89,032 (1.51%)
85,932 (1.46%)
81,242 (1.38%)
22.Wood County
74,138 (1.26%)
70,281 (1.19%)
66,254 (1.13%)
25.Sauk County
65,664 (1.12%)
58,272 (0.99%)
52,361 (0.89%)
28.Grant County
51,842 (0.88%)
51,822 (0.88%)
46,683 (0.79%)
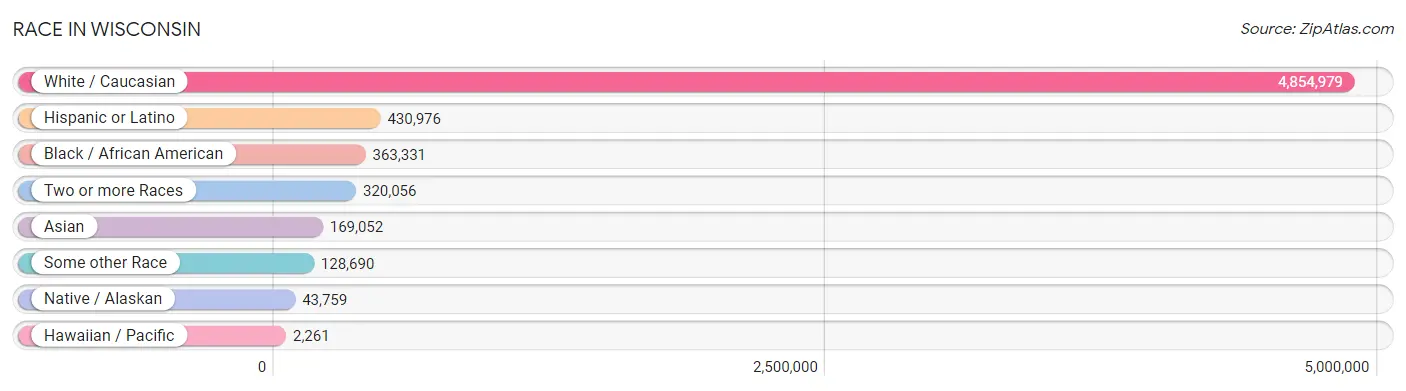
Race in Wisconsin
The most populous races in Wisconsin are White / Caucasian (4,854,979 | 82.5%), Hispanic or Latino (430,976 | 7.3%), and Black / African American (363,331 | 6.2%).
| Race | # Population | % Population |
| Asian | 169,052 | 2.9% |
| Black / African American | 363,331 | 6.2% |
| Hawaiian / Pacific | 2,261 | 0.0% |
| Hispanic or Latino | 430,976 | 7.3% |
| Native / Alaskan | 43,759 | 0.7% |
| White / Caucasian | 4,854,979 | 82.5% |
| Two or more Races | 320,056 | 5.4% |
| Some other Race | 128,690 | 2.2% |
| Total | 5,882,128 | 100.0% |
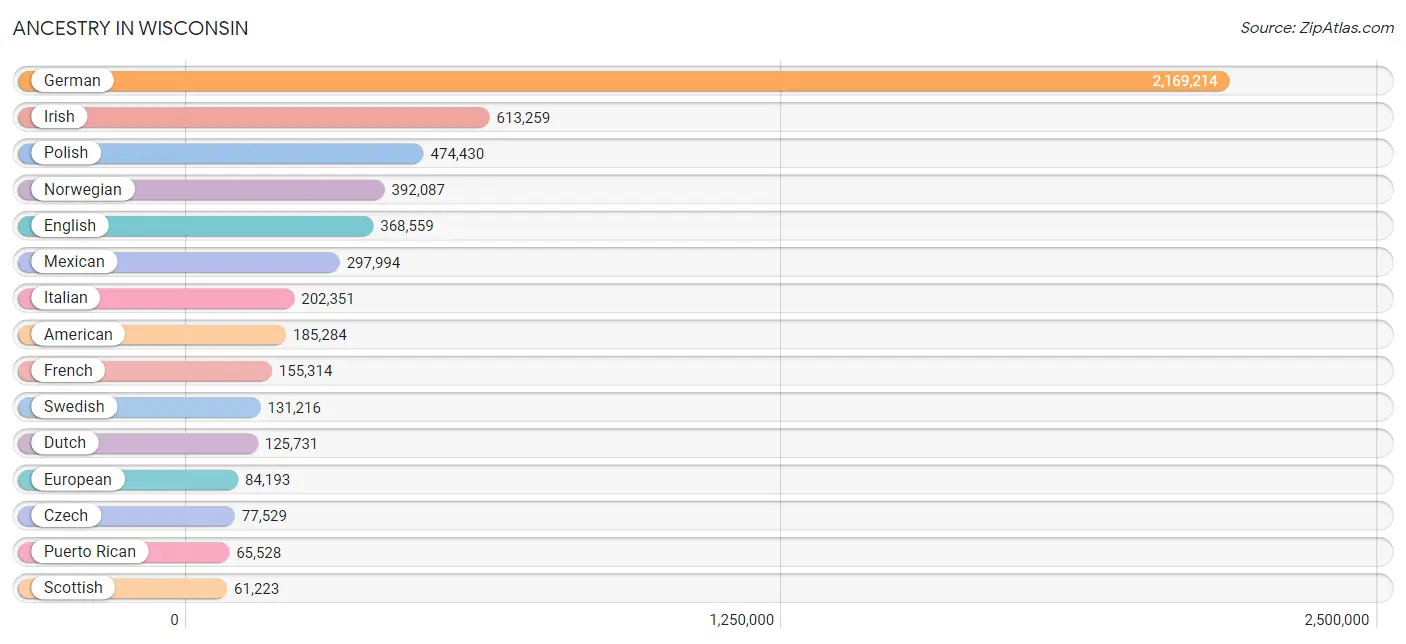
Ancestry in Wisconsin
The most populous ancestries reported in Wisconsin are German (2,169,214 | 36.9%), Irish (613,259 | 10.4%), Polish (474,430 | 8.1%), Norwegian (392,087 | 6.7%), and English (368,559 | 6.3%), together accounting for 68.3% of all Wisconsin residents.
| Ancestry | # Population | % Population |
| Afghan | 239 | 0.0% |
| African | 18,379 | 0.3% |
| Alaska Native | 119 | 0.0% |
| Alaskan Athabascan | 74 | 0.0% |
| Albanian | 4,722 | 0.1% |
| Aleut | 203 | 0.0% |
| Alsatian | 170 | 0.0% |
| American | 185,284 | 3.2% |
| Apache | 1,037 | 0.0% |
| Arab | 16,850 | 0.3% |
| Arapaho | 22 | 0.0% |
| Argentinean | 2,349 | 0.0% |
| Armenian | 3,442 | 0.1% |
| Assyrian / Chaldean / Syriac | 203 | 0.0% |
| Australian | 1,362 | 0.0% |
| Austrian | 22,478 | 0.4% |
| Bahamian | 145 | 0.0% |
| Bangladeshi | 58,516 | 1.0% |
| Barbadian | 87 | 0.0% |
| Basque | 118 | 0.0% |
| Belgian | 43,370 | 0.7% |
| Belizean | 168 | 0.0% |
| Bermudan | 19 | 0.0% |
| Bhutanese | 10,596 | 0.2% |
| Blackfeet | 2,052 | 0.0% |
| Bolivian | 609 | 0.0% |
| Brazilian | 2,102 | 0.0% |
| British | 18,237 | 0.3% |
| British West Indian | 53 | 0.0% |
| Bulgarian | 1,638 | 0.0% |
| Burmese | 12,980 | 0.2% |
| Cajun | 229 | 0.0% |
| Cambodian | 402 | 0.0% |
| Canadian | 6,308 | 0.1% |
| Cape Verdean | 71 | 0.0% |
| Carpatho Rusyn | 192 | 0.0% |
| Celtic | 542 | 0.0% |
| Central American | 19,207 | 0.3% |
| Central American Indian | 2,521 | 0.0% |
| Cherokee | 7,723 | 0.1% |
| Cheyenne | 131 | 0.0% |
| Chickasaw | 437 | 0.0% |
| Chilean | 837 | 0.0% |
| Chinese | 96 | 0.0% |
| Chippewa | 22,253 | 0.4% |
| Choctaw | 891 | 0.0% |
| Colombian | 5,452 | 0.1% |
| Colville | 15 | 0.0% |
| Comanche | 330 | 0.0% |
| Costa Rican | 1,088 | 0.0% |
| Cree | 287 | 0.0% |
| Creek | 385 | 0.0% |
| Croatian | 14,947 | 0.3% |
| Crow | 51 | 0.0% |
| Cuban | 6,699 | 0.1% |
| Cypriot | 16 | 0.0% |
| Czech | 77,529 | 1.3% |
| Czechoslovakian | 9,909 | 0.2% |
| Danish | 50,428 | 0.9% |
| Delaware | 173 | 0.0% |
| Dominican | 4,172 | 0.1% |
| Dutch | 125,731 | 2.1% |
| Dutch West Indian | 100 | 0.0% |
| Eastern European | 13,275 | 0.2% |
| Ecuadorian | 1,924 | 0.0% |
| Egyptian | 1,683 | 0.0% |
| English | 368,559 | 6.3% |
| Estonian | 371 | 0.0% |
| Ethiopian | 887 | 0.0% |
| European | 84,193 | 1.4% |
| Fijian | 214 | 0.0% |
| Filipino | 1,626 | 0.0% |
| Finnish | 37,028 | 0.6% |
| French | 155,314 | 2.6% |
| French American Indian | 967 | 0.0% |
| French Canadian | 46,369 | 0.8% |
| German | 2,169,214 | 36.9% |
| German Russian | 1,687 | 0.0% |
| Ghanaian | 774 | 0.0% |
| Greek | 17,996 | 0.3% |
| Guamanian / Chamorro | 797 | 0.0% |
| Guatemalan | 5,355 | 0.1% |
| Guyanese | 248 | 0.0% |
| Haitian | 1,258 | 0.0% |
| Hmong | 40 | 0.0% |
| Honduran | 3,605 | 0.1% |
| Hopi | 13 | 0.0% |
| Hungarian | 22,015 | 0.4% |
| Icelander | 1,325 | 0.0% |
| Indian (Asian) | 32,058 | 0.5% |
| Indonesian | 6,333 | 0.1% |
| Inupiat | 378 | 0.0% |
| Iranian | 1,985 | 0.0% |
| Iraqi | 974 | 0.0% |
| Irish | 613,259 | 10.4% |
| Iroquois | 9,448 | 0.2% |
| Israeli | 528 | 0.0% |
| Italian | 202,351 | 3.4% |
| Jamaican | 3,874 | 0.1% |
| Japanese | 1,836 | 0.0% |
| Jordanian | 732 | 0.0% |
| Kenyan | 456 | 0.0% |
| Kiowa | 44 | 0.0% |
| Korean | 22,363 | 0.4% |
| Laotian | 1,125 | 0.0% |
| Latvian | 2,261 | 0.0% |
| Lebanese | 3,792 | 0.1% |
| Liberian | 571 | 0.0% |
| Lithuanian | 13,525 | 0.2% |
| Lumbee | 60 | 0.0% |
| Luxembourger | 6,805 | 0.1% |
| Macedonian | 491 | 0.0% |
| Malaysian | 5,985 | 0.1% |
| Maltese | 158 | 0.0% |
| Menominee | 9,430 | 0.2% |
| Mexican | 297,994 | 5.1% |
| Mexican American Indian | 4,020 | 0.1% |
| Mongolian | 1,108 | 0.0% |
| Moroccan | 817 | 0.0% |
| Native Hawaiian | 2,079 | 0.0% |
| Navajo | 756 | 0.0% |
| New Zealander | 160 | 0.0% |
| Nicaraguan | 4,671 | 0.1% |
| Nigerian | 3,945 | 0.1% |
| Northern European | 9,686 | 0.2% |
| Norwegian | 392,087 | 6.7% |
| Okinawan | 69 | 0.0% |
| Osage | 31 | 0.0% |
| Ottawa | 453 | 0.0% |
| Paiute | 41 | 0.0% |
| Pakistani | 3,486 | 0.1% |
| Palestinian | 2,575 | 0.0% |
| Panamanian | 1,236 | 0.0% |
| Paraguayan | 569 | 0.0% |
| Pennsylvania German | 7,552 | 0.1% |
| Peruvian | 2,770 | 0.1% |
| Pima | 121 | 0.0% |
| Polish | 474,430 | 8.1% |
| Portuguese | 3,953 | 0.1% |
| Potawatomi | 2,372 | 0.0% |
| Pueblo | 263 | 0.0% |
| Puerto Rican | 65,528 | 1.1% |
| Puget Sound Salish | 20 | 0.0% |
| Romanian | 4,318 | 0.1% |
| Russian | 34,720 | 0.6% |
| Salvadoran | 3,215 | 0.1% |
| Samoan | 754 | 0.0% |
| Scandinavian | 33,118 | 0.6% |
| Scotch-Irish | 21,937 | 0.4% |
| Scottish | 61,223 | 1.0% |
| Seminole | 66 | 0.0% |
| Senegalese | 294 | 0.0% |
| Serbian | 8,196 | 0.1% |
| Shoshone | 28 | 0.0% |
| Sierra Leonean | 57 | 0.0% |
| Sioux | 2,043 | 0.0% |
| Slavic | 3,415 | 0.1% |
| Slovak | 12,252 | 0.2% |
| Slovene | 8,122 | 0.1% |
| Somali | 2,579 | 0.0% |
| South African | 722 | 0.0% |
| South American | 18,305 | 0.3% |
| South American Indian | 316 | 0.0% |
| Soviet Union | 16 | 0.0% |
| Spaniard | 4,846 | 0.1% |
| Spanish | 4,374 | 0.1% |
| Spanish American | 85 | 0.0% |
| Spanish American Indian | 41 | 0.0% |
| Sri Lankan | 9,495 | 0.2% |
| Subsaharan African | 31,503 | 0.5% |
| Sudanese | 375 | 0.0% |
| Swedish | 131,216 | 2.2% |
| Swiss | 51,327 | 0.9% |
| Syrian | 1,156 | 0.0% |
| Taiwanese | 32 | 0.0% |
| Thai | 37,264 | 0.6% |
| Tlingit-Haida | 58 | 0.0% |
| Tohono O'Odham | 112 | 0.0% |
| Tongan | 93 | 0.0% |
| Trinidadian and Tobagonian | 84 | 0.0% |
| Turkish | 1,165 | 0.0% |
| U.S. Virgin Islander | 149 | 0.0% |
| Ugandan | 51 | 0.0% |
| Ukrainian | 9,812 | 0.2% |
| Uruguayan | 1,025 | 0.0% |
| Ute | 31 | 0.0% |
| Venezuelan | 2,709 | 0.1% |
| Vietnamese | 564 | 0.0% |
| Welsh | 25,061 | 0.4% |
| West Indian | 737 | 0.0% |
| Yaqui | 60 | 0.0% |
| Yugoslavian | 3,677 | 0.1% |
| Yuman | 33 | 0.0% |
| Yup'ik | 54 | 0.0% |
| Zimbabwean | 185 | 0.0% | View All 195 Rows |
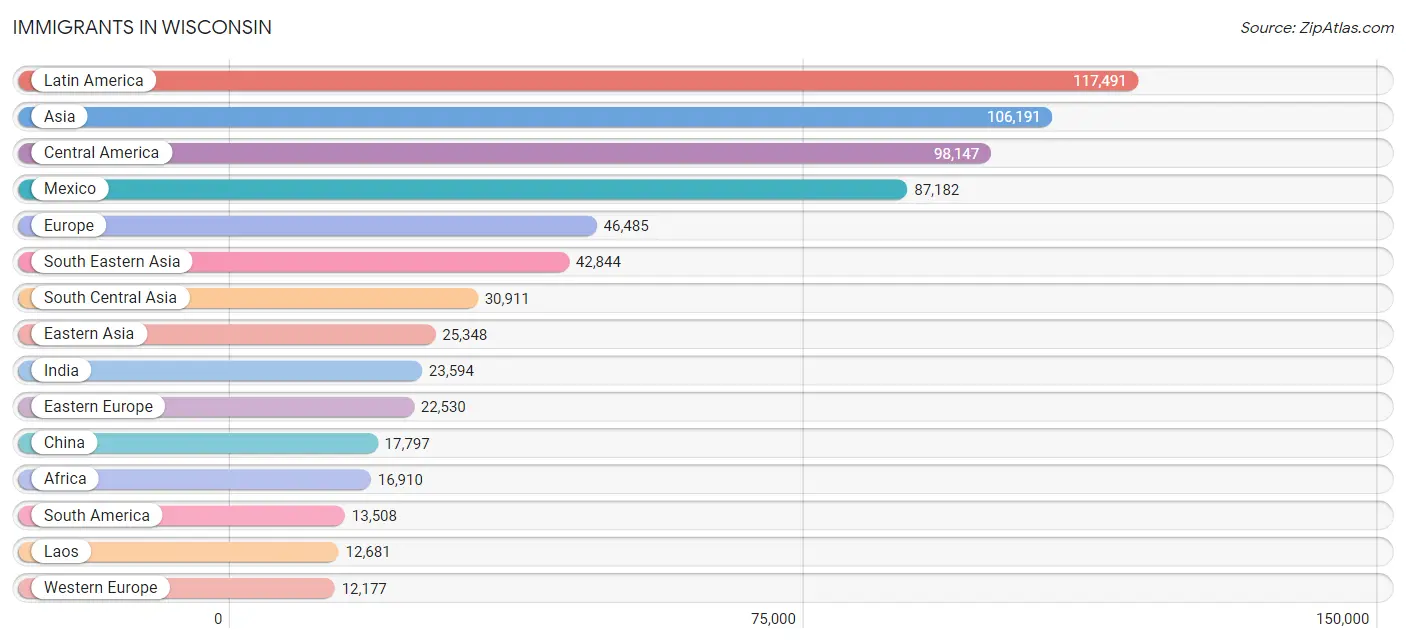
Immigrants in Wisconsin
The most numerous immigrant groups reported in Wisconsin came from Latin America (117,491 | 2.0%), Asia (106,191 | 1.8%), Central America (98,147 | 1.7%), Mexico (87,182 | 1.5%), and Europe (46,485 | 0.8%), together accounting for 7.7% of all Wisconsin residents.
| Immigration Origin | # Population | % Population |
| Afghanistan | 357 | 0.0% |
| Africa | 16,910 | 0.3% |
| Albania | 1,231 | 0.0% |
| Argentina | 1,622 | 0.0% |
| Armenia | 141 | 0.0% |
| Asia | 106,191 | 1.8% |
| Australia | 937 | 0.0% |
| Austria | 827 | 0.0% |
| Azores | 1 | 0.0% |
| Bahamas | 115 | 0.0% |
| Bangladesh | 1,015 | 0.0% |
| Barbados | 77 | 0.0% |
| Belarus | 627 | 0.0% |
| Belgium | 396 | 0.0% |
| Belize | 126 | 0.0% |
| Bolivia | 313 | 0.0% |
| Bosnia and Herzegovina | 926 | 0.0% |
| Brazil | 2,101 | 0.0% |
| Bulgaria | 613 | 0.0% |
| Cambodia | 580 | 0.0% |
| Cameroon | 611 | 0.0% |
| Canada | 6,747 | 0.1% |
| Caribbean | 5,836 | 0.1% |
| Central America | 98,147 | 1.7% |
| Chile | 550 | 0.0% |
| China | 17,797 | 0.3% |
| Colombia | 3,036 | 0.1% |
| Congo | 503 | 0.0% |
| Costa Rica | 506 | 0.0% |
| Croatia | 762 | 0.0% |
| Cuba | 1,087 | 0.0% |
| Czechoslovakia | 953 | 0.0% |
| Denmark | 341 | 0.0% |
| Dominica | 69 | 0.0% |
| Dominican Republic | 1,948 | 0.0% |
| Eastern Africa | 4,776 | 0.1% |
| Eastern Asia | 25,348 | 0.4% |
| Eastern Europe | 22,530 | 0.4% |
| Ecuador | 717 | 0.0% |
| Egypt | 928 | 0.0% |
| El Salvador | 1,621 | 0.0% |
| England | 2,478 | 0.0% |
| Eritrea | 231 | 0.0% |
| Ethiopia | 1,080 | 0.0% |
| Europe | 46,485 | 0.8% |
| France | 858 | 0.0% |
| Germany | 8,773 | 0.2% |
| Ghana | 797 | 0.0% |
| Greece | 843 | 0.0% |
| Grenada | 1 | 0.0% |
| Guatemala | 2,903 | 0.1% |
| Guyana | 127 | 0.0% |
| Haiti | 633 | 0.0% |
| Honduras | 2,133 | 0.0% |
| Hong Kong | 645 | 0.0% |
| Hungary | 858 | 0.0% |
| India | 23,594 | 0.4% |
| Indonesia | 571 | 0.0% |
| Iran | 1,012 | 0.0% |
| Iraq | 1,171 | 0.0% |
| Ireland | 539 | 0.0% |
| Israel | 465 | 0.0% |
| Italy | 2,099 | 0.0% |
| Jamaica | 1,623 | 0.0% |
| Japan | 1,981 | 0.0% |
| Jordan | 1,329 | 0.0% |
| Kazakhstan | 231 | 0.0% |
| Kenya | 933 | 0.0% |
| Korea | 5,320 | 0.1% |
| Kuwait | 500 | 0.0% |
| Laos | 12,681 | 0.2% |
| Latin America | 117,491 | 2.0% |
| Latvia | 457 | 0.0% |
| Lebanon | 209 | 0.0% |
| Liberia | 574 | 0.0% |
| Lithuania | 315 | 0.0% |
| Malaysia | 1,496 | 0.0% |
| Mexico | 87,182 | 1.5% |
| Micronesia | 177 | 0.0% |
| Middle Africa | 1,989 | 0.0% |
| Moldova | 161 | 0.0% |
| Morocco | 741 | 0.0% |
| Nepal | 1,187 | 0.0% |
| Netherlands | 962 | 0.0% |
| Nicaragua | 3,231 | 0.1% |
| Nigeria | 2,079 | 0.0% |
| North Macedonia | 921 | 0.0% |
| Northern Africa | 2,261 | 0.0% |
| Northern Europe | 7,670 | 0.1% |
| Norway | 209 | 0.0% |
| Oceania | 1,517 | 0.0% |
| Pakistan | 2,757 | 0.1% |
| Panama | 445 | 0.0% |
| Peru | 1,960 | 0.0% |
| Philippines | 9,280 | 0.2% |
| Poland | 4,321 | 0.1% |
| Portugal | 107 | 0.0% |
| Romania | 1,247 | 0.0% |
| Russia | 3,727 | 0.1% |
| Saudi Arabia | 994 | 0.0% |
| Scotland | 702 | 0.0% |
| Senegal | 244 | 0.0% |
| Serbia | 802 | 0.0% |
| Sierra Leone | 247 | 0.0% |
| Singapore | 161 | 0.0% |
| Somalia | 1,537 | 0.0% |
| South Africa | 1,211 | 0.0% |
| South America | 13,508 | 0.2% |
| South Central Asia | 30,911 | 0.5% |
| South Eastern Asia | 42,844 | 0.7% |
| Southern Europe | 4,029 | 0.1% |
| Spain | 935 | 0.0% |
| Sri Lanka | 318 | 0.0% |
| St. Vincent and the Grenadines | 20 | 0.0% |
| Sudan | 214 | 0.0% |
| Sweden | 493 | 0.0% |
| Switzerland | 354 | 0.0% |
| Syria | 504 | 0.0% |
| Taiwan | 1,987 | 0.0% |
| Thailand | 9,655 | 0.2% |
| Trinidad and Tobago | 201 | 0.0% |
| Turkey | 760 | 0.0% |
| Uganda | 171 | 0.0% |
| Ukraine | 2,177 | 0.0% |
| Uruguay | 551 | 0.0% |
| Uzbekistan | 174 | 0.0% |
| Venezuela | 2,302 | 0.0% |
| Vietnam | 4,400 | 0.1% |
| West Indies | 6 | 0.0% |
| Western Africa | 5,604 | 0.1% |
| Western Asia | 6,392 | 0.1% |
| Western Europe | 12,177 | 0.2% |
| Yemen | 110 | 0.0% |
| Zaire | 808 | 0.0% |
| Zimbabwe | 140 | 0.0% | View All 135 Rows |
Sex and Age in Wisconsin
Sex and Age in Wisconsin
The most populous age groups in Wisconsin are 55 to 59 Years (208,487 | 7.1%) for men and 55 to 59 Years (209,205 | 7.1%) for women.
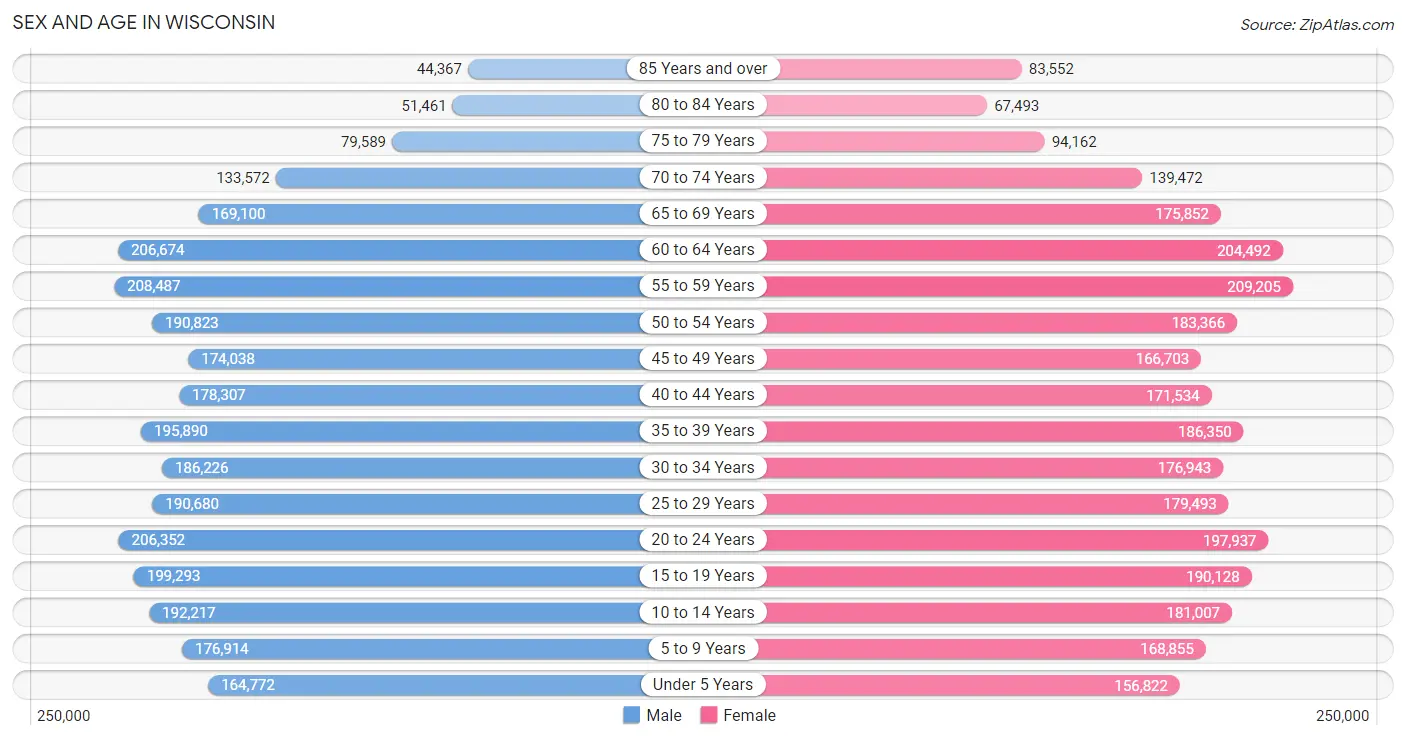
| Age Bracket | Male | Female |
| Under 5 Years | 164,772 (5.6%) | 156,822 (5.3%) |
| 5 to 9 Years | 176,914 (6.0%) | 168,855 (5.8%) |
| 10 to 14 Years | 192,217 (6.5%) | 181,007 (6.2%) |
| 15 to 19 Years | 199,293 (6.8%) | 190,128 (6.5%) |
| 20 to 24 Years | 206,352 (7.0%) | 197,937 (6.8%) |
| 25 to 29 Years | 190,680 (6.5%) | 179,493 (6.1%) |
| 30 to 34 Years | 186,226 (6.3%) | 176,943 (6.0%) |
| 35 to 39 Years | 195,890 (6.6%) | 186,350 (6.4%) |
| 40 to 44 Years | 178,307 (6.0%) | 171,534 (5.9%) |
| 45 to 49 Years | 174,038 (5.9%) | 166,703 (5.7%) |
| 50 to 54 Years | 190,823 (6.5%) | 183,366 (6.2%) |
| 55 to 59 Years | 208,487 (7.1%) | 209,205 (7.1%) |
| 60 to 64 Years | 206,674 (7.0%) | 204,492 (7.0%) |
| 65 to 69 Years | 169,100 (5.7%) | 175,852 (6.0%) |
| 70 to 74 Years | 133,572 (4.5%) | 139,472 (4.8%) |
| 75 to 79 Years | 79,589 (2.7%) | 94,162 (3.2%) |
| 80 to 84 Years | 51,461 (1.8%) | 67,493 (2.3%) |
| 85 Years and over | 44,367 (1.5%) | 83,552 (2.9%) |
| Total | 2,948,762 (100.0%) | 2,933,366 (100.0%) |
Families and Households in Wisconsin
Median Family Size in Wisconsin
The median family size in Wisconsin is 2.97 persons per family, with married-couple families (1,152,787 | 77.5%) accounting for the largest median family size of 3 persons per family. On the other hand, single male/father families (110,094 | 7.4%) represent the smallest median family size with 2.73 persons per family.
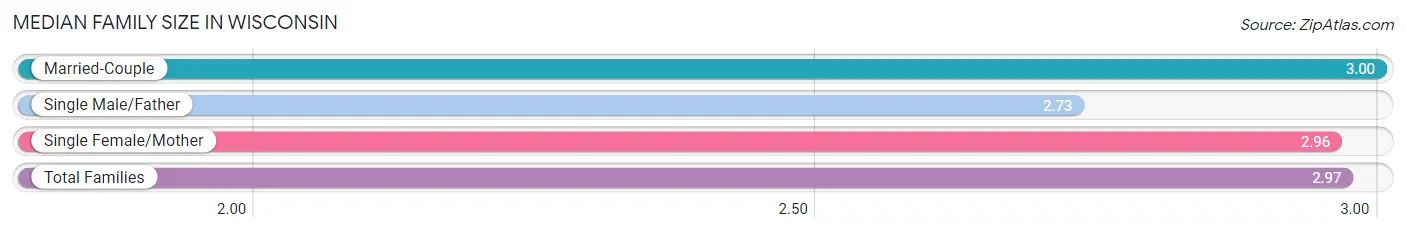
| Family Type | # Families | Family Size |
| Married-Couple | 1,152,787 (77.5%) | 3.00 |
| Single Male/Father | 110,094 (7.4%) | 2.73 |
| Single Female/Mother | 225,419 (15.1%) | 2.96 |
| Total Families | 1,488,300 (100.0%) | 2.97 |
Median Household Size in Wisconsin
The median household size in Wisconsin is 2.37 persons per household, with single female/mother households (225,419 | 9.3%) accounting for the largest median household size of 3.22 persons per household. non-family households (937,188 | 38.6%) represent the smallest median household size with 1.27 persons per household.
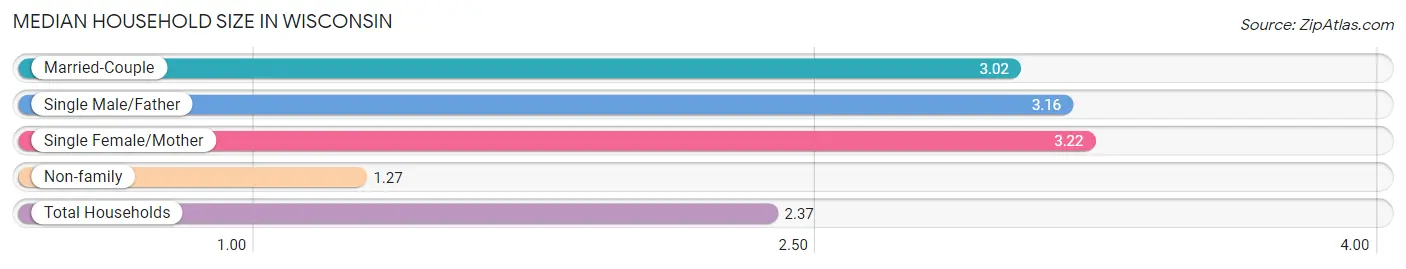
| Household Type | # Households | Household Size |
| Married-Couple | 1,152,787 (47.5%) | 3.02 |
| Single Male/Father | 110,094 (4.5%) | 3.16 |
| Single Female/Mother | 225,419 (9.3%) | 3.22 |
| Non-family | 937,188 (38.6%) | 1.27 |
| Total Households | 2,425,488 (100.0%) | 2.37 |
Household Size by Marriage Status in Wisconsin
Out of a total of 2,425,488 households in Wisconsin, 1,488,300 (61.4%) are family households, while 937,188 (38.6%) are nonfamily households. The most numerous type of family households are 2-person households, comprising 738,870, and the most common type of nonfamily households are 1-person households, comprising 745,807.
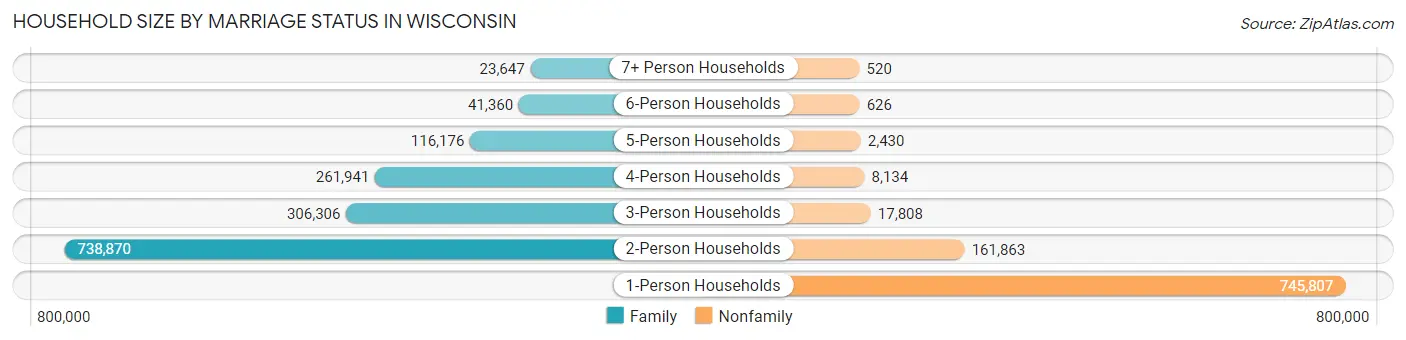
| Household Size | Family Households | Nonfamily Households |
| 1-Person Households | - | 745,807 (30.7%) |
| 2-Person Households | 738,870 (30.5%) | 161,863 (6.7%) |
| 3-Person Households | 306,306 (12.6%) | 17,808 (0.7%) |
| 4-Person Households | 261,941 (10.8%) | 8,134 (0.3%) |
| 5-Person Households | 116,176 (4.8%) | 2,430 (0.1%) |
| 6-Person Households | 41,360 (1.7%) | 626 (0.0%) |
| 7+ Person Households | 23,647 (1.0%) | 520 (0.0%) |
| Total | 1,488,300 (61.4%) | 937,188 (38.6%) |
Female Fertility in Wisconsin
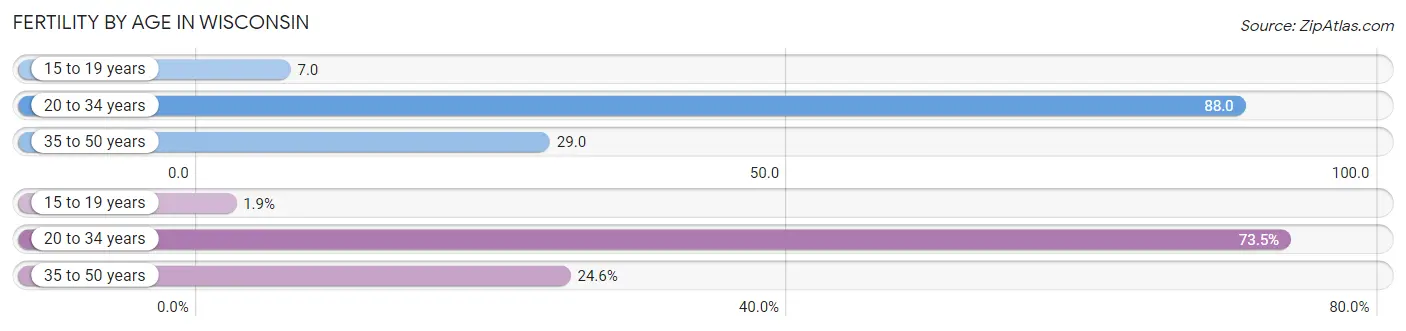
Fertility by Age in Wisconsin
Average fertility rate in Wisconsin is 51.0 births per 1,000 women. Women in the age bracket of 20 to 34 years have the highest fertility rate with 88.0 births per 1,000 women. Women in the age bracket of 20 to 34 years acount for 73.5% of all women with births.
| Age Bracket | Women with Births | Births / 1,000 Women |
| 15 to 19 years | 1,269 (1.9%) | 7.0 |
| 20 to 34 years | 48,808 (73.5%) | 88.0 |
| 35 to 50 years | 16,341 (24.6%) | 29.0 |
| Total | 66,418 (100.0%) | 51.0 |
Fertility by Age by Marriage Status in Wisconsin
71.9% of women with births (66,418) in Wisconsin are married. The highest percentage of unmarried women with births falls into 15 to 19 years age bracket with 91.1% of them unmarried at the time of birth, while the lowest percentage of unmarried women with births belong to 35 to 50 years age bracket with 17.7% of them unmarried.

| Age Bracket | Married | Unmarried |
| 15 to 19 years | 113 (8.9%) | 1,156 (91.1%) |
| 20 to 34 years | 34,214 (70.1%) | 14,594 (29.9%) |
| 35 to 50 years | 13,449 (82.3%) | 2,892 (17.7%) |
| Total | 47,755 (71.9%) | 18,663 (28.1%) |
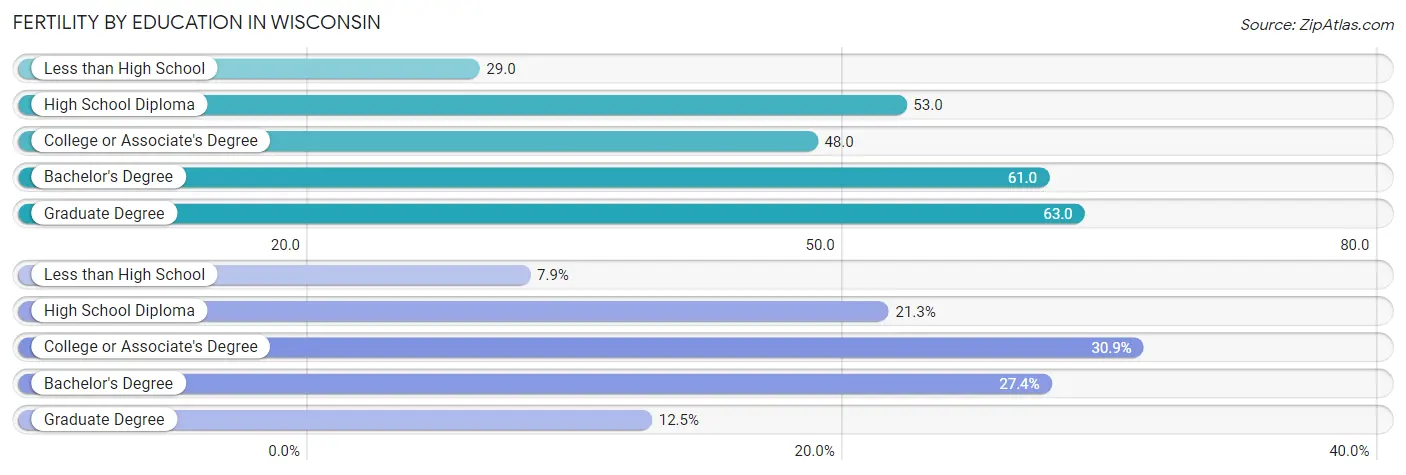
Fertility by Education in Wisconsin
Average fertility rate in Wisconsin is 51.0 births per 1,000 women. Women with the education attainment of graduate degree have the highest fertility rate of 63.0 births per 1,000 women, while women with the education attainment of less than high school have the lowest fertility at 29.0 births per 1,000 women. Women with the education attainment of college or associate's degree represent 30.9% of all women with births.
| Educational Attainment | Women with Births | Births / 1,000 Women |
| Less than High School | 5,250 (7.9%) | 29.0 |
| High School Diploma | 14,164 (21.3%) | 53.0 |
| College or Associate's Degree | 20,510 (30.9%) | 48.0 |
| Bachelor's Degree | 18,216 (27.4%) | 61.0 |
| Graduate Degree | 8,278 (12.5%) | 63.0 |
| Total | 66,418 (100.0%) | 51.0 |
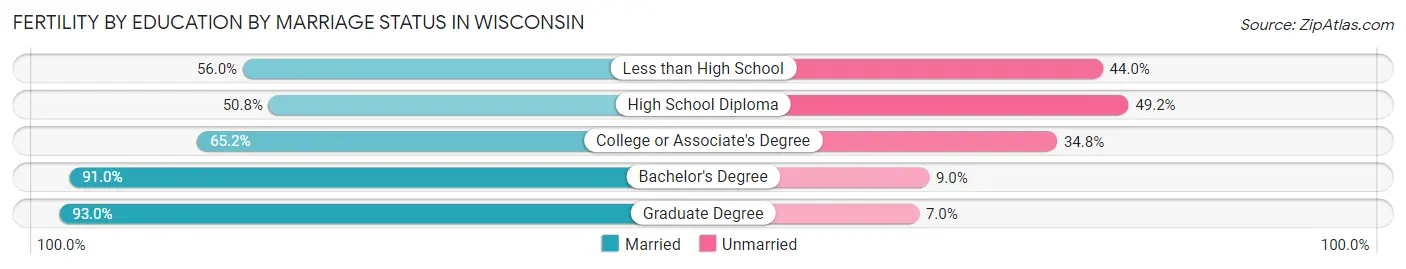
Fertility by Education by Marriage Status in Wisconsin
28.1% of women with births in Wisconsin are unmarried. Women with the educational attainment of graduate degree are most likely to be married with 93.0% of them married at childbirth, while women with the educational attainment of high school diploma are least likely to be married with 49.2% of them unmarried at childbirth.
| Educational Attainment | Married | Unmarried |
| Less than High School | 2,940 (56.0%) | 2,310 (44.0%) |
| High School Diploma | 7,195 (50.8%) | 6,969 (49.2%) |
| College or Associate's Degree | 13,373 (65.2%) | 7,137 (34.8%) |
| Bachelor's Degree | 16,577 (91.0%) | 1,639 (9.0%) |
| Graduate Degree | 7,699 (93.0%) | 579 (7.0%) |
| Total | 47,755 (71.9%) | 18,663 (28.1%) |
Employment Characteristics in Wisconsin
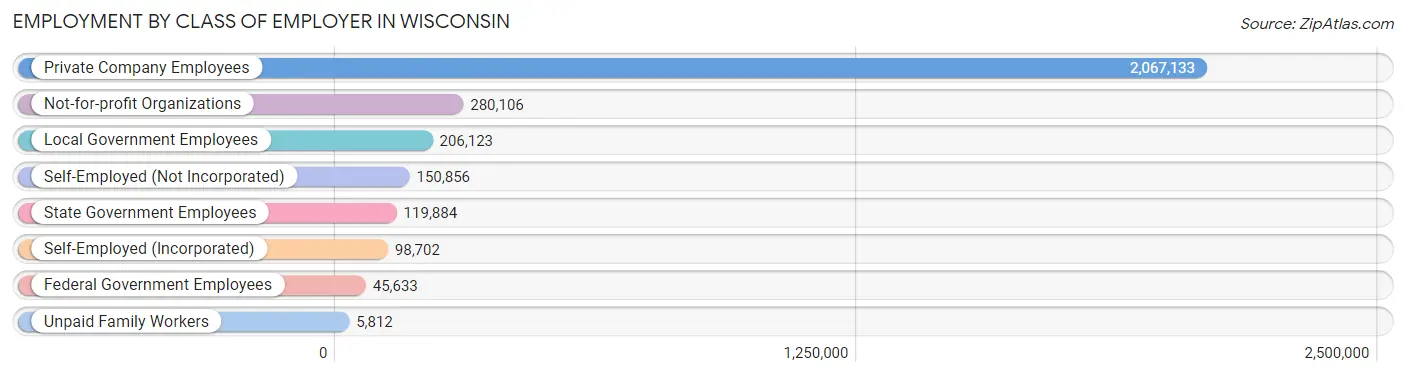
Employment by Class of Employer in Wisconsin
Among the 2,974,249 employed individuals in Wisconsin, private company employees (2,067,133 | 69.5%), not-for-profit organizations (280,106 | 9.4%), and local government employees (206,123 | 6.9%) make up the most common classes of employment.
| Employer Class | # Employees | % Employees |
| Private Company Employees | 2,067,133 | 69.5% |
| Self-Employed (Incorporated) | 98,702 | 3.3% |
| Self-Employed (Not Incorporated) | 150,856 | 5.1% |
| Not-for-profit Organizations | 280,106 | 9.4% |
| Local Government Employees | 206,123 | 6.9% |
| State Government Employees | 119,884 | 4.0% |
| Federal Government Employees | 45,633 | 1.5% |
| Unpaid Family Workers | 5,812 | 0.2% |
| Total | 2,974,249 | 100.0% |
Employment Status by Age in Wisconsin
According to the labor force statistics for Wisconsin, out of the total population over 16 years of age (4,764,779), 65.7% or 3,130,460 individuals are in the labor force, with 3.4% or 106,436 of them unemployed. The age group with the highest labor force participation rate is 25 to 29 years, with 87.1% or 322,421 individuals in the labor force. Within the labor force, the 16 to 19 years age range has the highest percentage of unemployed individuals, with 8.5% or 14,032 of them being unemployed.
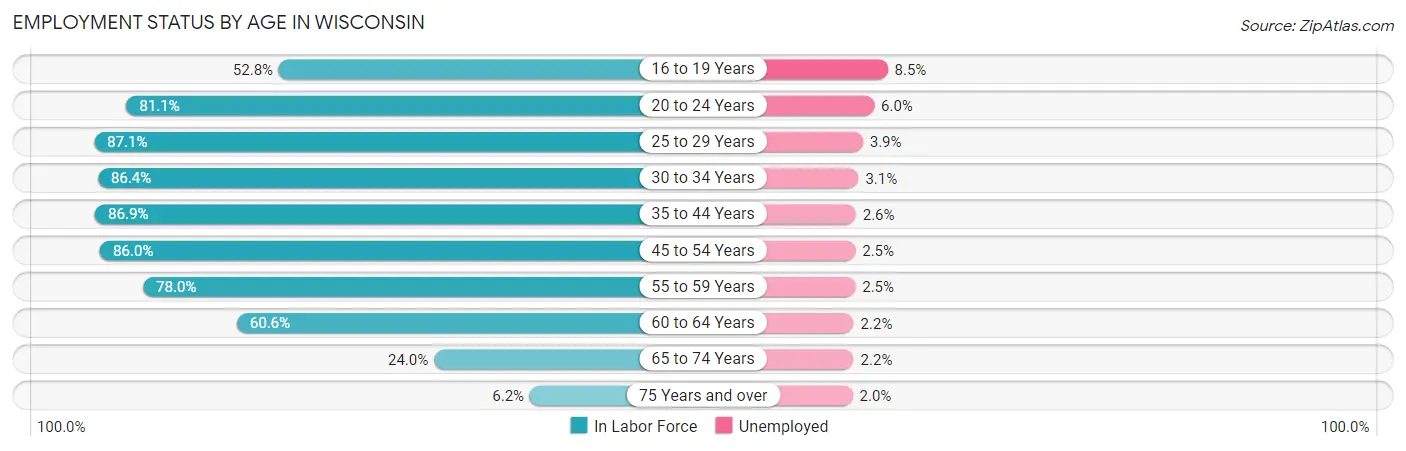
| Age Bracket | In Labor Force | Unemployed |
| 16 to 19 Years | 165,084 (52.8%) | 14,032 (8.5%) |
| 20 to 24 Years | 327,878 (81.1%) | 19,673 (6.0%) |
| 25 to 29 Years | 322,421 (87.1%) | 12,574 (3.9%) |
| 30 to 34 Years | 313,778 (86.4%) | 9,727 (3.1%) |
| 35 to 44 Years | 636,178 (86.9%) | 16,541 (2.6%) |
| 45 to 54 Years | 614,840 (86.0%) | 15,371 (2.5%) |
| 55 to 59 Years | 325,800 (78.0%) | 8,145 (2.5%) |
| 60 to 64 Years | 249,167 (60.6%) | 5,482 (2.2%) |
| 65 to 74 Years | 148,319 (24.0%) | 3,263 (2.2%) |
| 75 Years and over | 26,079 (6.2%) | 522 (2.0%) |
| Total | 3,130,460 (65.7%) | 106,436 (3.4%) |
Employment Status by Educational Attainment in Wisconsin
According to labor force statistics for Wisconsin, 81.8% of individuals (2,461,535) out of the total population between 25 and 64 years of age (3,009,211) are in the labor force, with 2.8% or 68,923 of them being unemployed. The group with the highest labor force participation rate are those with the educational attainment of bachelor's degree or higher, with 88.8% or 907,566 individuals in the labor force. Within the labor force, individuals with less than high school education have the highest percentage of unemployment, with 6.6% or 8,069 of them being unemployed.
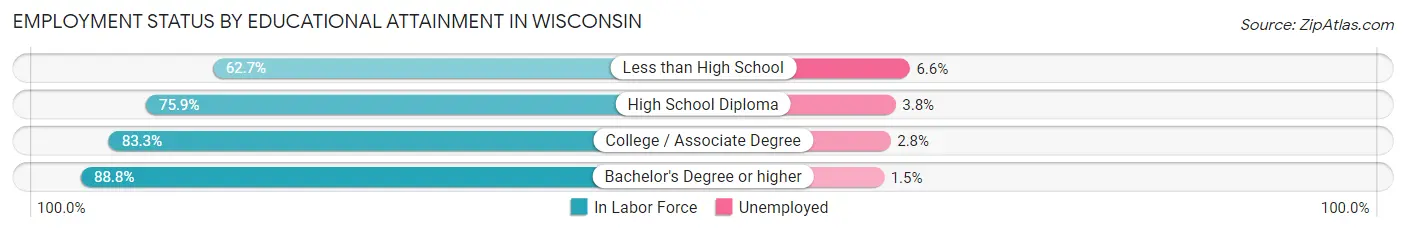
| Educational Attainment | In Labor Force | Unemployed |
| Less than High School | 122,264 (62.7%) | 12,870 (6.6%) |
| High School Diploma | 617,563 (75.9%) | 30,919 (3.8%) |
| College / Associate Degree | 815,111 (83.3%) | 27,399 (2.8%) |
| Bachelor's Degree or higher | 907,566 (88.8%) | 15,331 (1.5%) |
| Total | 2,461,535 (81.8%) | 84,258 (2.8%) |
Employment Occupations by Sex in Wisconsin
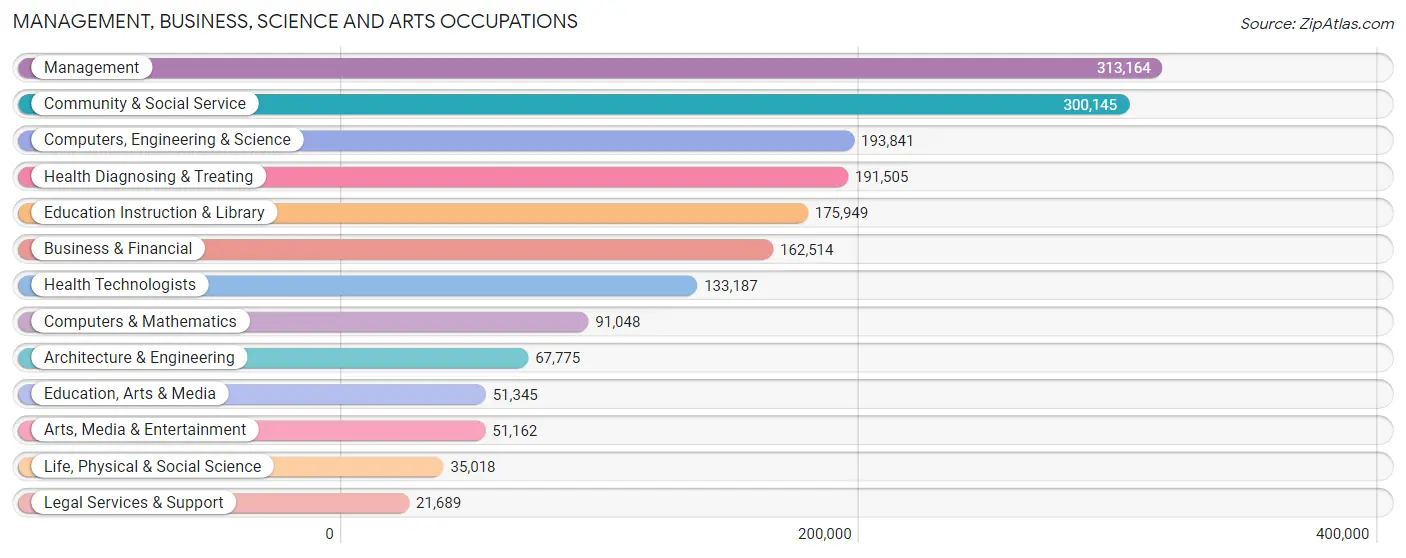
Management, Business, Science and Arts Occupations
The most common Management, Business, Science and Arts occupations in Wisconsin are Management (313,164 | 10.4%), Community & Social Service (300,145 | 9.9%), Computers, Engineering & Science (193,841 | 6.4%), Health Diagnosing & Treating (191,505 | 6.3%), and Education Instruction & Library (175,949 | 5.8%).
Management, Business, Science and Arts Occupations by Sex
Within the Management, Business, Science and Arts occupations in Wisconsin, the most male-oriented occupations are Architecture & Engineering (84.5%), Computers & Mathematics (73.2%), and Computers, Engineering & Science (72.8%), while the most female-oriented occupations are Health Diagnosing & Treating (79.6%), Health Technologists (78.6%), and Education Instruction & Library (73.5%).
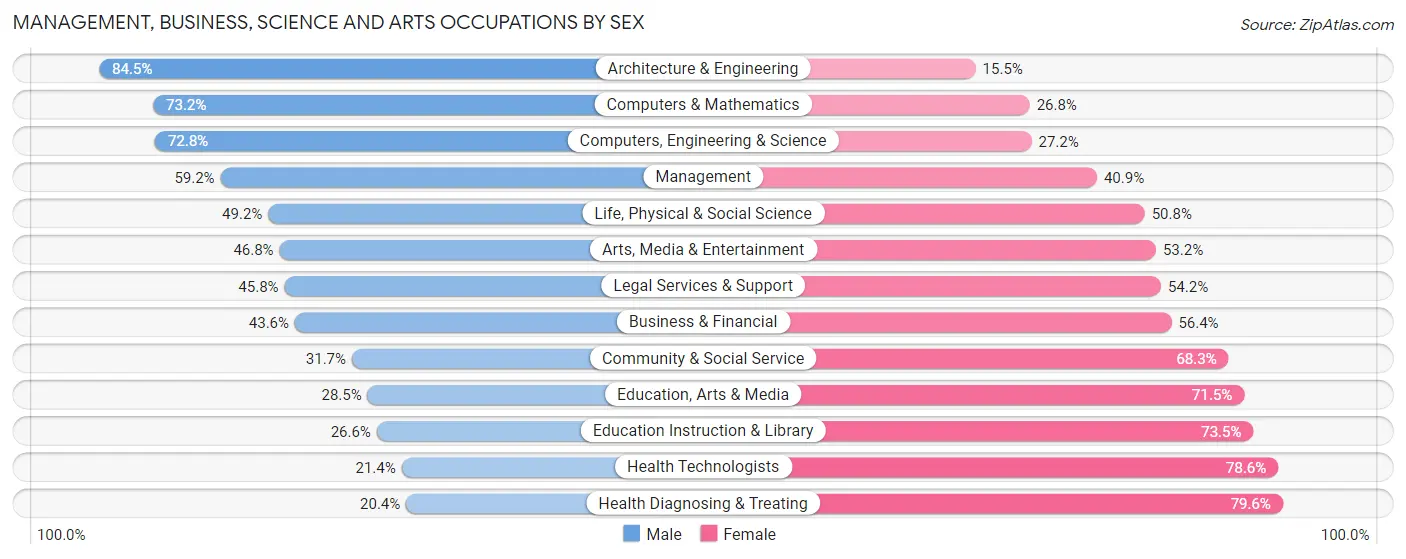
| Occupation | Male | Female |
| Management | 185,240 (59.2%) | 127,924 (40.8%) |
| Business & Financial | 70,889 (43.6%) | 91,625 (56.4%) |
| Computers, Engineering & Science | 141,109 (72.8%) | 52,732 (27.2%) |
| Computers & Mathematics | 66,642 (73.2%) | 24,406 (26.8%) |
| Architecture & Engineering | 57,241 (84.5%) | 10,534 (15.5%) |
| Life, Physical & Social Science | 17,226 (49.2%) | 17,792 (50.8%) |
| Community & Social Service | 95,231 (31.7%) | 204,914 (68.3%) |
| Education, Arts & Media | 14,611 (28.5%) | 36,734 (71.5%) |
| Legal Services & Support | 9,933 (45.8%) | 11,756 (54.2%) |
| Education Instruction & Library | 46,723 (26.6%) | 129,226 (73.5%) |
| Arts, Media & Entertainment | 23,964 (46.8%) | 27,198 (53.2%) |
| Health Diagnosing & Treating | 39,105 (20.4%) | 152,400 (79.6%) |
| Health Technologists | 28,466 (21.4%) | 104,721 (78.6%) |
| Total (Category) | 531,574 (45.8%) | 629,595 (54.2%) |
| Total (Overall) | 1,585,001 (52.5%) | 1,435,889 (47.5%) |
Services Occupations
The most common Services occupations in Wisconsin are Food Preparation & Serving (150,661 | 5.0%), Healthcare Support (112,163 | 3.7%), Cleaning & Maintenance (92,811 | 3.1%), Personal Care & Service (67,636 | 2.2%), and Security & Protection (49,380 | 1.6%).

Services Occupations by Sex
Within the Services occupations in Wisconsin, the most male-oriented occupations are Law Enforcement (82.4%), Security & Protection (77.4%), and Firefighting & Prevention (72.2%), while the most female-oriented occupations are Healthcare Support (87.7%), Personal Care & Service (81.4%), and Food Preparation & Serving (57.6%).
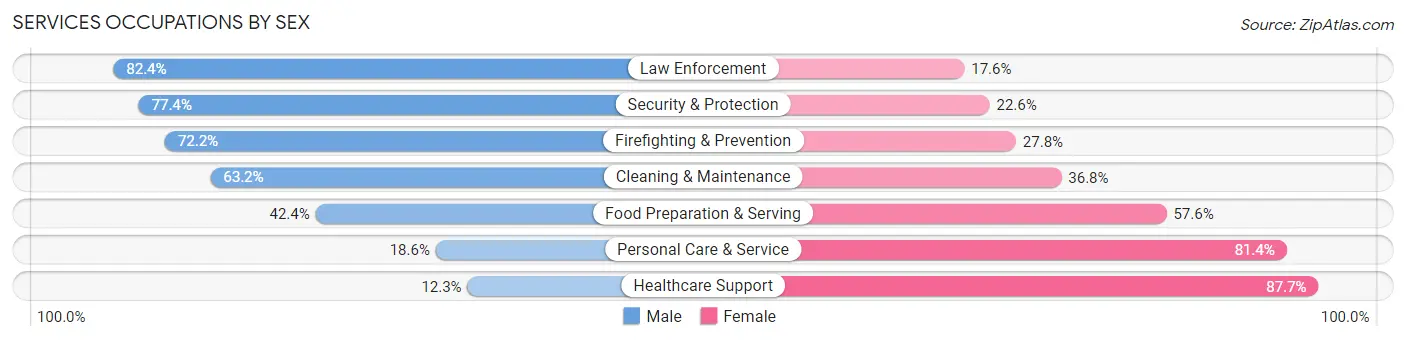
| Occupation | Male | Female |
| Healthcare Support | 13,803 (12.3%) | 98,360 (87.7%) |
| Security & Protection | 38,232 (77.4%) | 11,148 (22.6%) |
| Firefighting & Prevention | 17,442 (72.2%) | 6,715 (27.8%) |
| Law Enforcement | 20,790 (82.4%) | 4,433 (17.6%) |
| Food Preparation & Serving | 63,865 (42.4%) | 86,796 (57.6%) |
| Cleaning & Maintenance | 58,665 (63.2%) | 34,146 (36.8%) |
| Personal Care & Service | 12,571 (18.6%) | 55,065 (81.4%) |
| Total (Category) | 187,136 (39.6%) | 285,515 (60.4%) |
| Total (Overall) | 1,585,001 (52.5%) | 1,435,889 (47.5%) |
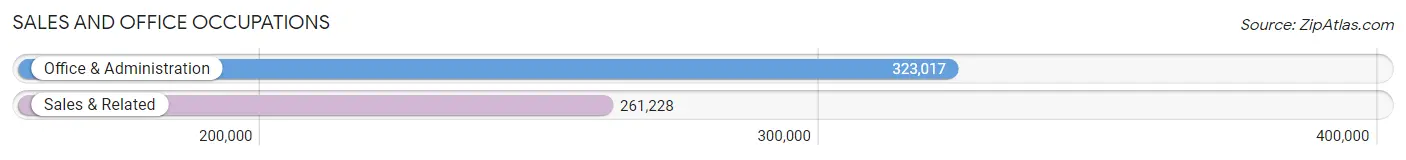
Sales and Office Occupations
The most common Sales and Office occupations in Wisconsin are Office & Administration (323,017 | 10.7%), and Sales & Related (261,228 | 8.6%).
Sales and Office Occupations by Sex
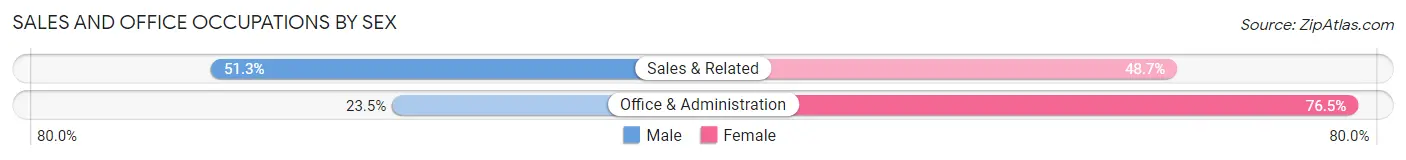
| Occupation | Male | Female |
| Sales & Related | 133,986 (51.3%) | 127,242 (48.7%) |
| Office & Administration | 75,805 (23.5%) | 247,212 (76.5%) |
| Total (Category) | 209,791 (35.9%) | 374,454 (64.1%) |
| Total (Overall) | 1,585,001 (52.5%) | 1,435,889 (47.5%) |
Natural Resources, Construction and Maintenance Occupations
The most common Natural Resources, Construction and Maintenance occupations in Wisconsin are Construction & Extraction (135,633 | 4.5%), Installation, Maintenance & Repair (100,719 | 3.3%), and Farming, Fishing & Forestry (25,589 | 0.9%).
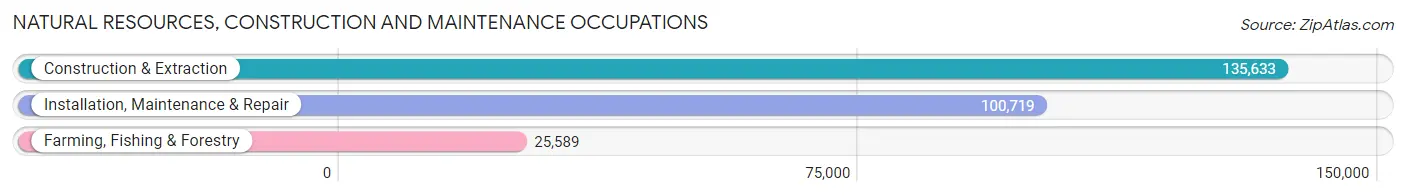
Natural Resources, Construction and Maintenance Occupations by Sex
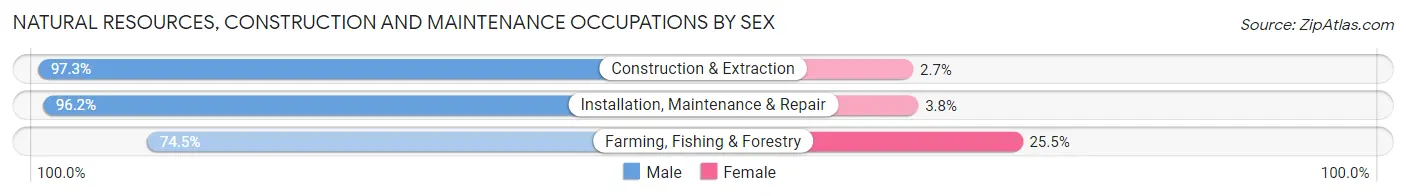
| Occupation | Male | Female |
| Farming, Fishing & Forestry | 19,065 (74.5%) | 6,524 (25.5%) |
| Construction & Extraction | 131,917 (97.3%) | 3,716 (2.7%) |
| Installation, Maintenance & Repair | 96,884 (96.2%) | 3,835 (3.8%) |
| Total (Category) | 247,866 (94.6%) | 14,075 (5.4%) |
| Total (Overall) | 1,585,001 (52.5%) | 1,435,889 (47.5%) |
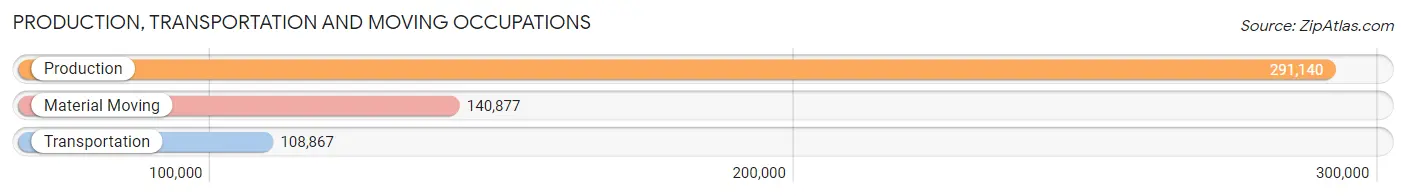
Production, Transportation and Moving Occupations
The most common Production, Transportation and Moving occupations in Wisconsin are Production (291,140 | 9.6%), Material Moving (140,877 | 4.7%), and Transportation (108,867 | 3.6%).
Production, Transportation and Moving Occupations by Sex
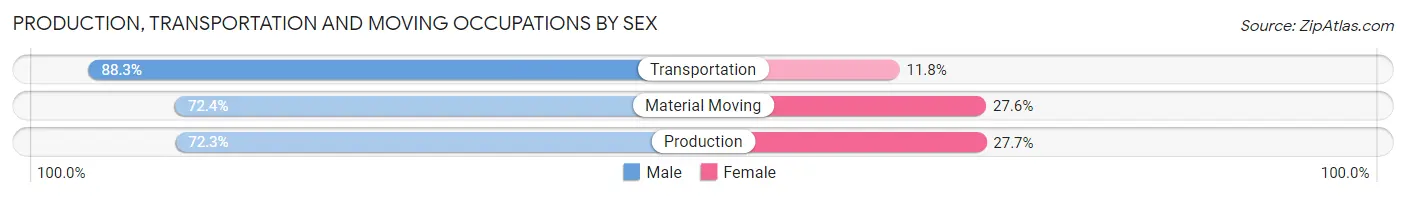
| Occupation | Male | Female |
| Production | 210,574 (72.3%) | 80,566 (27.7%) |
| Transportation | 96,079 (88.2%) | 12,788 (11.7%) |
| Material Moving | 101,981 (72.4%) | 38,896 (27.6%) |
| Total (Category) | 408,634 (75.5%) | 132,250 (24.4%) |
| Total (Overall) | 1,585,001 (52.5%) | 1,435,889 (47.5%) |
Employment Industries by Sex in Wisconsin
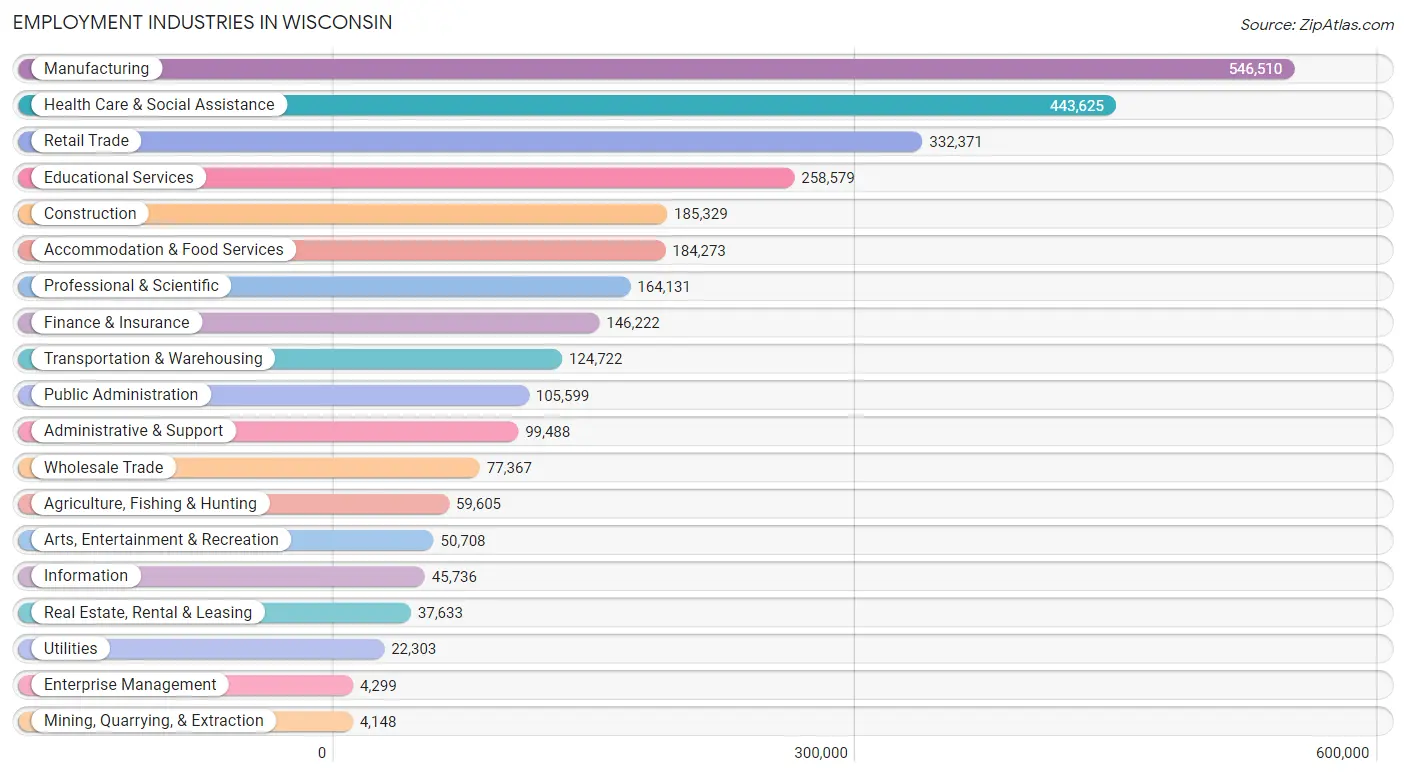
Employment Industries in Wisconsin
The major employment industries in Wisconsin include Manufacturing (546,510 | 18.1%), Health Care & Social Assistance (443,625 | 14.7%), Retail Trade (332,371 | 11.0%), Educational Services (258,579 | 8.6%), and Construction (185,329 | 6.1%).
Employment Industries by Sex in Wisconsin
The Wisconsin industries that see more men than women are Construction (90.3%), Mining, Quarrying, & Extraction (86.0%), and Utilities (79.6%), whereas the industries that tend to have a higher number of women are Health Care & Social Assistance (81.3%), Educational Services (68.4%), and Finance & Insurance (60.5%).
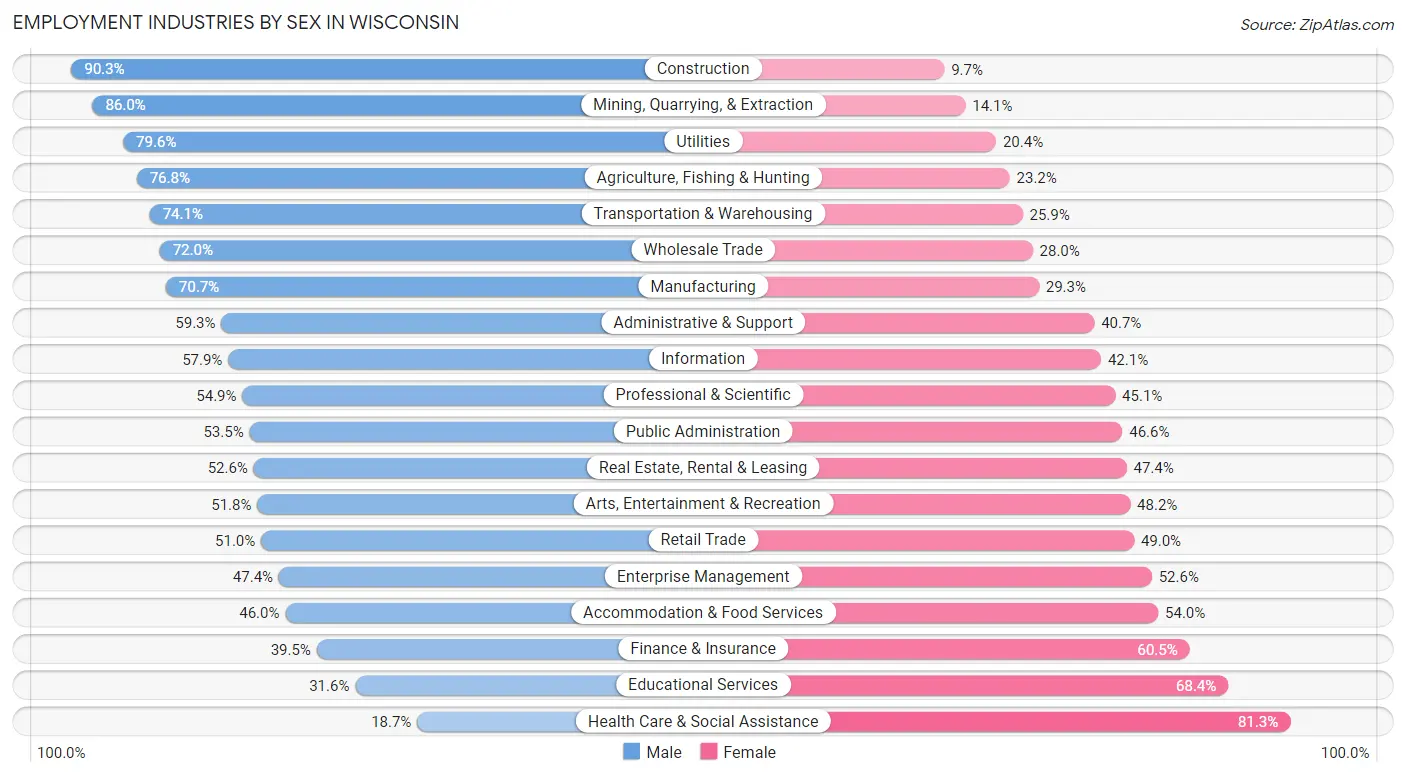
| Industry | Male | Female |
| Agriculture, Fishing & Hunting | 45,767 (76.8%) | 13,838 (23.2%) |
| Mining, Quarrying, & Extraction | 3,565 (86.0%) | 583 (14.1%) |
| Construction | 167,392 (90.3%) | 17,937 (9.7%) |
| Manufacturing | 386,598 (70.7%) | 159,912 (29.3%) |
| Wholesale Trade | 55,719 (72.0%) | 21,648 (28.0%) |
| Retail Trade | 169,641 (51.0%) | 162,730 (49.0%) |
| Transportation & Warehousing | 92,423 (74.1%) | 32,299 (25.9%) |
| Utilities | 17,754 (79.6%) | 4,549 (20.4%) |
| Information | 26,464 (57.9%) | 19,272 (42.1%) |
| Finance & Insurance | 57,813 (39.5%) | 88,409 (60.5%) |
| Real Estate, Rental & Leasing | 19,787 (52.6%) | 17,846 (47.4%) |
| Professional & Scientific | 90,155 (54.9%) | 73,976 (45.1%) |
| Enterprise Management | 2,036 (47.4%) | 2,263 (52.6%) |
| Administrative & Support | 58,968 (59.3%) | 40,520 (40.7%) |
| Educational Services | 81,610 (31.6%) | 176,969 (68.4%) |
| Health Care & Social Assistance | 83,122 (18.7%) | 360,503 (81.3%) |
| Arts, Entertainment & Recreation | 26,282 (51.8%) | 24,426 (48.2%) |
| Accommodation & Food Services | 84,841 (46.0%) | 99,432 (54.0%) |
| Public Administration | 56,439 (53.4%) | 49,160 (46.6%) |
| Total | 1,585,001 (52.5%) | 1,435,889 (47.5%) |
Education in Wisconsin
School Enrollment in Wisconsin
The most common levels of schooling among the 1,380,809 students in Wisconsin are high school (301,019 | 21.8%), college / undergraduate (299,251 | 21.7%), and middle school (294,579 | 21.3%).
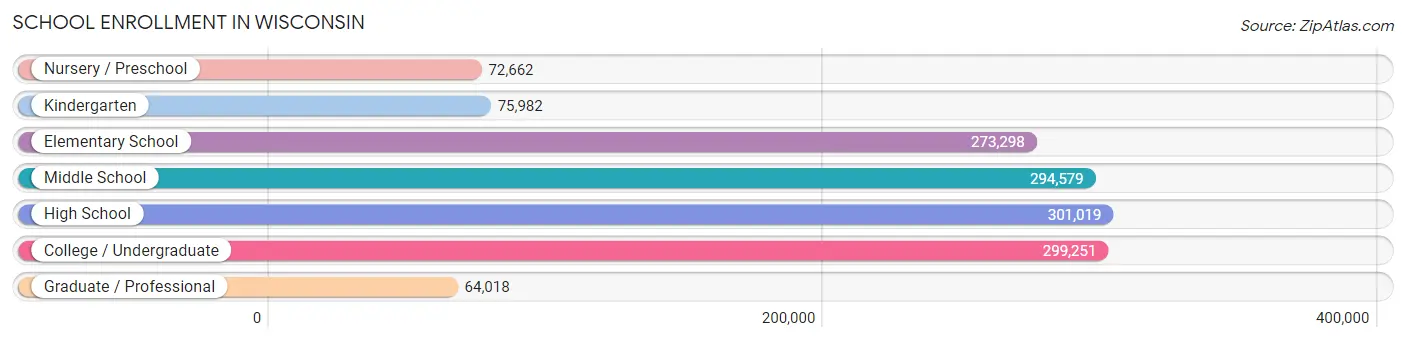
| School Level | # Students | % Students |
| Nursery / Preschool | 72,662 | 5.3% |
| Kindergarten | 75,982 | 5.5% |
| Elementary School | 273,298 | 19.8% |
| Middle School | 294,579 | 21.3% |
| High School | 301,019 | 21.8% |
| College / Undergraduate | 299,251 | 21.7% |
| Graduate / Professional | 64,018 | 4.6% |
| Total | 1,380,809 | 100.0% |
School Enrollment by Age by Funding Source in Wisconsin
Out of a total of 1,380,809 students who are enrolled in schools in Wisconsin, 234,738 (17.0%) attend a private institution, while the remaining 1,146,071 (83.0%) are enrolled in public schools. The age group of 3 to 4 year olds has the highest likelihood of being enrolled in private schools, with 18,222 (32.8% in the age bracket) enrolled. Conversely, the age group of 15 to 17 year olds has the lowest likelihood of being enrolled in a private school, with 196,657 (89.1% in the age bracket) attending a public institution.

| Age Bracket | Public School | Private School |
| 3 to 4 Year Olds | 37,423 (67.2%) | 18,222 (32.8%) |
| 5 to 9 Year Old | 272,981 (82.9%) | 56,444 (17.1%) |
| 10 to 14 Year Olds | 308,516 (84.9%) | 54,941 (15.1%) |
| 15 to 17 Year Olds | 196,657 (89.1%) | 24,077 (10.9%) |
| 18 to 19 Year Olds | 99,624 (83.7%) | 19,409 (16.3%) |
| 20 to 24 Year Olds | 130,817 (81.4%) | 29,819 (18.6%) |
| 25 to 34 Year Olds | 56,330 (77.5%) | 16,310 (22.5%) |
| 35 Years and over | 43,619 (73.6%) | 15,620 (26.4%) |
| Total | 1,146,071 (83.0%) | 234,738 (17.0%) |
Educational Attainment by Field of Study in Wisconsin
Business (268,526 | 18.9%), education (202,815 | 14.2%), science & technology (158,184 | 11.1%), bio, nature & agricultural (116,060 | 8.2%), and social sciences (96,860 | 6.8%) are the most common fields of study among 1,423,916 individuals in Wisconsin who have obtained a bachelor's degree or higher.

| Field of Study | # Graduates | % Graduates |
| Computers & Mathematics | 55,525 | 3.9% |
| Bio, Nature & Agricultural | 116,060 | 8.2% |
| Physical & Health Sciences | 41,438 | 2.9% |
| Psychology | 64,948 | 4.6% |
| Social Sciences | 96,860 | 6.8% |
| Engineering | 88,086 | 6.2% |
| Multidisciplinary Studies | 9,418 | 0.7% |
| Science & Technology | 158,184 | 11.1% |
| Business | 268,526 | 18.9% |
| Education | 202,815 | 14.2% |
| Literature & Languages | 56,456 | 4.0% |
| Liberal Arts & History | 57,327 | 4.0% |
| Visual & Performing Arts | 53,323 | 3.7% |
| Communications | 62,238 | 4.4% |
| Arts & Humanities | 92,712 | 6.5% |
| Total | 1,423,916 | 100.0% |
Transportation & Commute in Wisconsin
Vehicle Availability by Sex in Wisconsin
The most prevalent vehicle ownership categories in Wisconsin are males with 2 vehicles (695,102, accounting for 44.8%) and females with 2 vehicles (605,909, making up 49.9%).
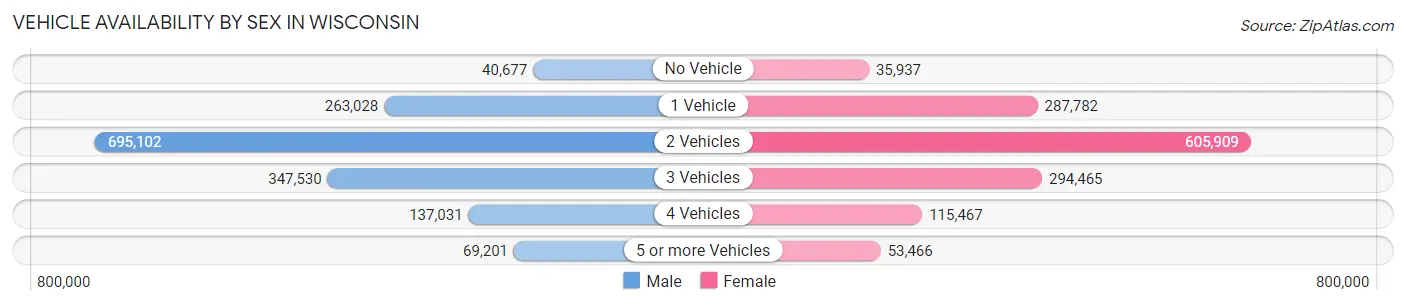
| Vehicles Available | Male | Female |
| No Vehicle | 40,677 (2.6%) | 35,937 (2.6%) |
| 1 Vehicle | 263,028 (16.9%) | 287,782 (20.7%) |
| 2 Vehicles | 695,102 (44.8%) | 605,909 (43.5%) |
| 3 Vehicles | 347,530 (22.4%) | 294,465 (21.1%) |
| 4 Vehicles | 137,031 (8.8%) | 115,467 (8.3%) |
| 5 or more Vehicles | 69,201 (4.5%) | 53,466 (3.8%) |
| Total | 1,552,569 (100.0%) | 1,393,026 (100.0%) |
Commute Time in Wisconsin
The most frequently occuring commute durations in Wisconsin are 15 to 19 minutes (445,788 commuters, 16.7%), 10 to 14 minutes (434,642 commuters, 16.3%), and 20 to 24 minutes (386,625 commuters, 14.5%).
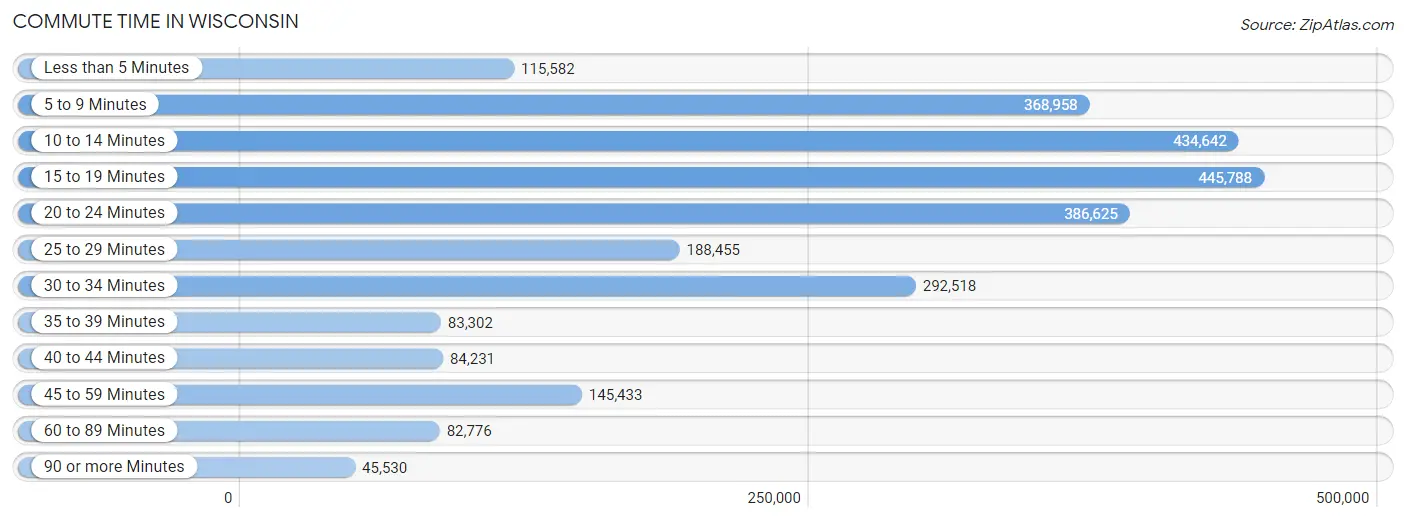
| Commute Time | # Commuters | % Commuters |
| Less than 5 Minutes | 115,582 | 4.3% |
| 5 to 9 Minutes | 368,958 | 13.8% |
| 10 to 14 Minutes | 434,642 | 16.3% |
| 15 to 19 Minutes | 445,788 | 16.7% |
| 20 to 24 Minutes | 386,625 | 14.5% |
| 25 to 29 Minutes | 188,455 | 7.0% |
| 30 to 34 Minutes | 292,518 | 10.9% |
| 35 to 39 Minutes | 83,302 | 3.1% |
| 40 to 44 Minutes | 84,231 | 3.2% |
| 45 to 59 Minutes | 145,433 | 5.4% |
| 60 to 89 Minutes | 82,776 | 3.1% |
| 90 or more Minutes | 45,530 | 1.7% |
Commute Time by Sex in Wisconsin
The most common commute times in Wisconsin are 15 to 19 minutes (229,117 commuters, 16.1%) for males and 15 to 19 minutes (216,671 commuters, 17.3%) for females.

| Commute Time | Male | Female |
| Less than 5 Minutes | 63,468 (4.5%) | 52,114 (4.2%) |
| 5 to 9 Minutes | 181,602 (12.8%) | 187,356 (15.0%) |
| 10 to 14 Minutes | 219,446 (15.4%) | 215,196 (17.2%) |
| 15 to 19 Minutes | 229,117 (16.1%) | 216,671 (17.3%) |
| 20 to 24 Minutes | 204,035 (14.3%) | 182,590 (14.6%) |
| 25 to 29 Minutes | 99,969 (7.0%) | 88,486 (7.1%) |
| 30 to 34 Minutes | 164,378 (11.6%) | 128,140 (10.2%) |
| 35 to 39 Minutes | 45,524 (3.2%) | 37,778 (3.0%) |
| 40 to 44 Minutes | 47,528 (3.3%) | 36,703 (2.9%) |
| 45 to 59 Minutes | 84,783 (6.0%) | 60,650 (4.9%) |
| 60 to 89 Minutes | 52,915 (3.7%) | 29,861 (2.4%) |
| 90 or more Minutes | 29,454 (2.1%) | 16,076 (1.3%) |
Time of Departure to Work by Sex in Wisconsin
The most frequent times of departure to work in Wisconsin are 7:00 AM to 7:29 AM (190,070, 13.4%) for males and 7:00 AM to 7:29 AM (208,978, 16.7%) for females.

| Time of Departure | Male | Female |
| 12:00 AM to 4:59 AM | 122,531 (8.6%) | 53,005 (4.2%) |
| 5:00 AM to 5:29 AM | 87,371 (6.1%) | 37,476 (3.0%) |
| 5:30 AM to 5:59 AM | 109,664 (7.7%) | 54,288 (4.3%) |
| 6:00 AM to 6:29 AM | 140,780 (9.9%) | 92,940 (7.4%) |
| 6:30 AM to 6:59 AM | 155,410 (10.9%) | 130,486 (10.4%) |
| 7:00 AM to 7:29 AM | 190,070 (13.4%) | 208,978 (16.7%) |
| 7:30 AM to 7:59 AM | 146,462 (10.3%) | 191,271 (15.3%) |
| 8:00 AM to 8:29 AM | 108,151 (7.6%) | 121,323 (9.7%) |
| 8:30 AM to 8:59 AM | 46,508 (3.3%) | 59,415 (4.8%) |
| 9:00 AM to 9:59 AM | 54,081 (3.8%) | 67,503 (5.4%) |
| 10:00 AM to 10:59 AM | 29,009 (2.0%) | 32,175 (2.6%) |
| 11:00 AM to 11:59 AM | 15,716 (1.1%) | 18,244 (1.5%) |
| 12:00 PM to 3:59 PM | 116,258 (8.2%) | 102,037 (8.2%) |
| 4:00 PM to 11:59 PM | 100,208 (7.0%) | 82,480 (6.6%) |
| Total | 1,422,219 (100.0%) | 1,251,621 (100.0%) |
Housing Occupancy in Wisconsin
Occupancy by Ownership in Wisconsin
Of the total 2,425,488 dwellings in Wisconsin, owner-occupied units account for 1,641,590 (67.7%), while renter-occupied units make up 783,898 (32.3%).
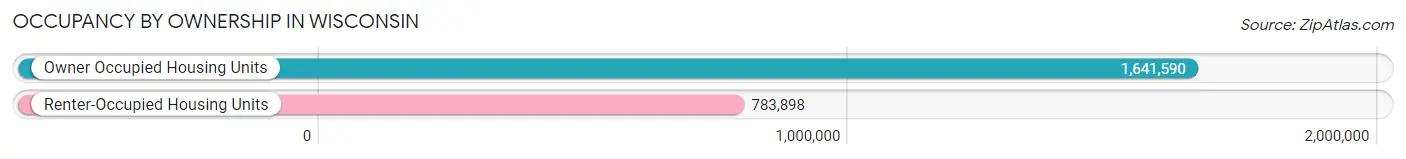
| Occupancy | # Housing Units | % Housing Units |
| Owner Occupied Housing Units | 1,641,590 | 67.7% |
| Renter-Occupied Housing Units | 783,898 | 32.3% |
| Total Occupied Housing Units | 2,425,488 | 100.0% |
Occupancy by Household Size in Wisconsin
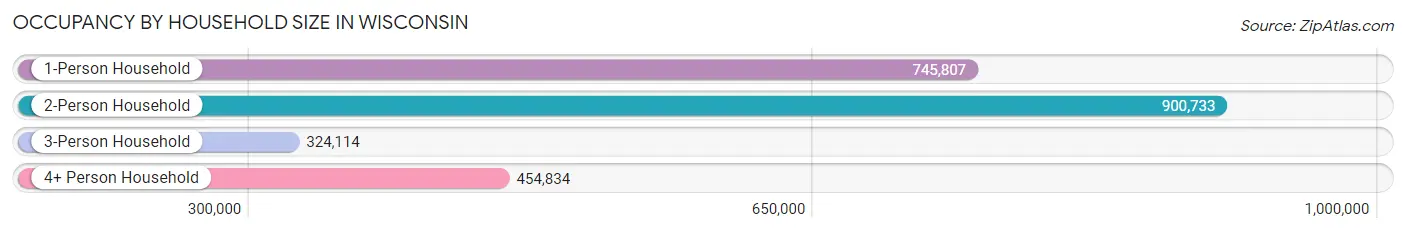
| Household Size | # Housing Units | % Housing Units |
| 1-Person Household | 745,807 | 30.7% |
| 2-Person Household | 900,733 | 37.1% |
| 3-Person Household | 324,114 | 13.4% |
| 4+ Person Household | 454,834 | 18.8% |
| Total Housing Units | 2,425,488 | 100.0% |
Occupancy by Ownership by Household Size in Wisconsin

| Household Size | Owner-occupied | Renter-occupied |
| 1-Person Household | 380,598 (51.0%) | 365,209 (49.0%) |
| 2-Person Household | 683,302 (75.9%) | 217,431 (24.1%) |
| 3-Person Household | 229,828 (70.9%) | 94,286 (29.1%) |
| 4+ Person Household | 347,862 (76.5%) | 106,972 (23.5%) |
| Total Housing Units | 1,641,590 (67.7%) | 783,898 (32.3%) |
Occupancy by Educational Attainment in Wisconsin
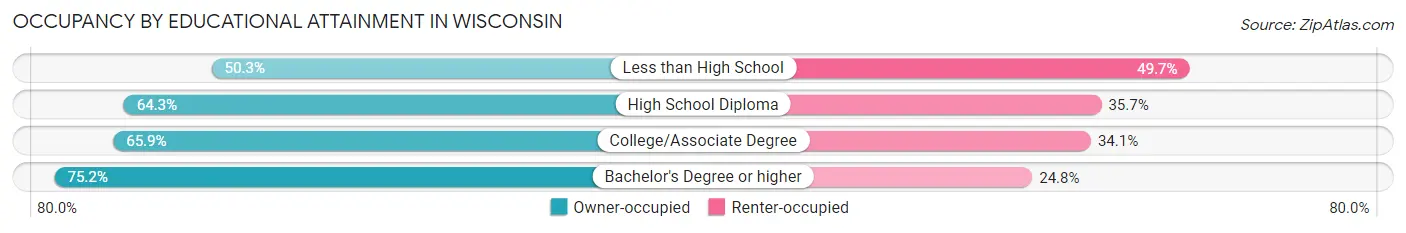
| Household Size | Owner-occupied | Renter-occupied |
| Less than High School | 72,451 (50.3%) | 71,503 (49.7%) |
| High School Diploma | 426,549 (64.3%) | 237,228 (35.7%) |
| College/Associate Degree | 528,386 (65.9%) | 273,013 (34.1%) |
| Bachelor's Degree or higher | 614,204 (75.2%) | 202,154 (24.8%) |
Occupancy by Age of Householder in Wisconsin
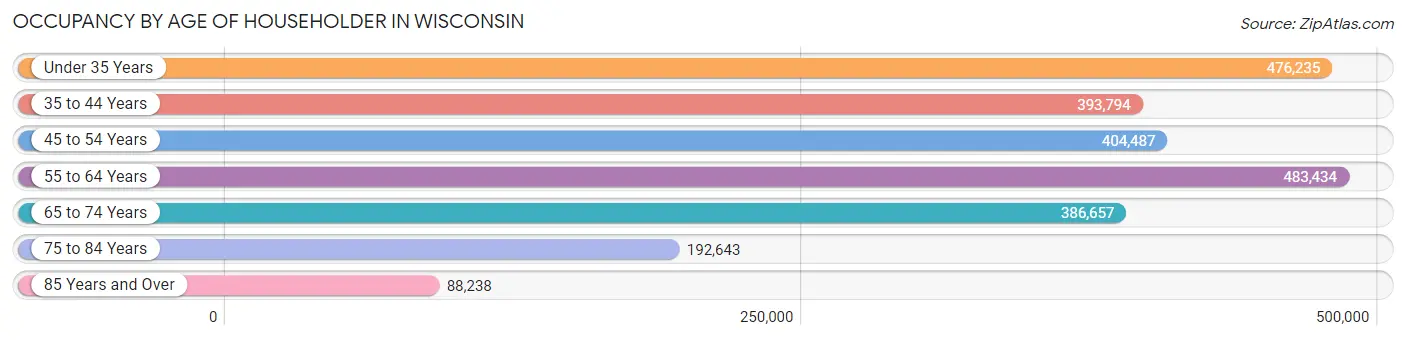
| Age Bracket | # Households | % Households |
| Under 35 Years | 476,235 | 19.6% |
| 35 to 44 Years | 393,794 | 16.2% |
| 45 to 54 Years | 404,487 | 16.7% |
| 55 to 64 Years | 483,434 | 19.9% |
| 65 to 74 Years | 386,657 | 15.9% |
| 75 to 84 Years | 192,643 | 7.9% |
| 85 Years and Over | 88,238 | 3.6% |
| Total | 2,425,488 | 100.0% |
Housing Finances in Wisconsin
Median Income by Occupancy in Wisconsin
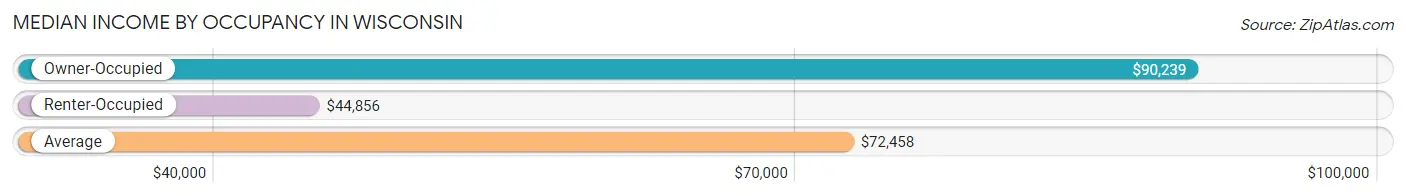
| Occupancy Type | # Households | Median Income |
| Owner-Occupied | 1,641,590 (67.7%) | $90,239 |
| Renter-Occupied | 783,898 (32.3%) | $44,856 |
| Average | 2,425,488 (100.0%) | $72,458 |
Occupancy by Householder Income Bracket in Wisconsin
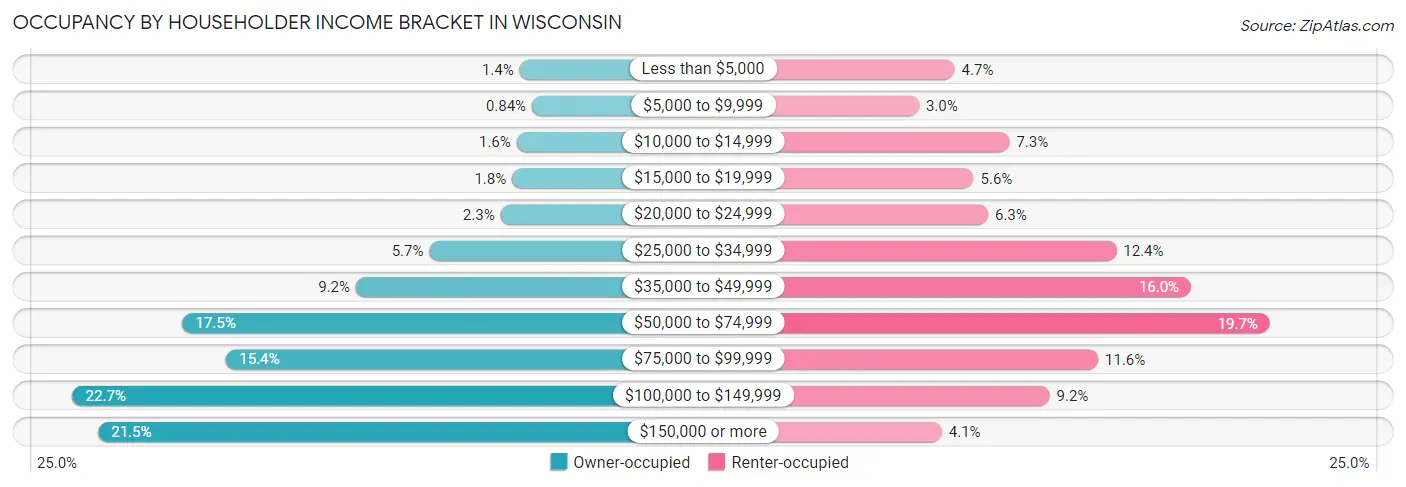
| Income Bracket | Owner-occupied | Renter-occupied |
| Less than $5,000 | 23,462 (1.4%) | 37,017 (4.7%) |
| $5,000 to $9,999 | 13,810 (0.8%) | 23,635 (3.0%) |
| $10,000 to $14,999 | 25,784 (1.6%) | 57,470 (7.3%) |
| $15,000 to $19,999 | 29,342 (1.8%) | 44,078 (5.6%) |
| $20,000 to $24,999 | 38,414 (2.3%) | 49,434 (6.3%) |
| $25,000 to $34,999 | 94,030 (5.7%) | 97,325 (12.4%) |
| $35,000 to $49,999 | 151,527 (9.2%) | 125,192 (16.0%) |
| $50,000 to $74,999 | 286,942 (17.5%) | 154,620 (19.7%) |
| $75,000 to $99,999 | 252,699 (15.4%) | 90,535 (11.6%) |
| $100,000 to $149,999 | 372,842 (22.7%) | 72,395 (9.2%) |
| $150,000 or more | 352,738 (21.5%) | 32,197 (4.1%) |
| Total | 1,641,590 (100.0%) | 783,898 (100.0%) |
Monthly Housing Cost Tiers in Wisconsin
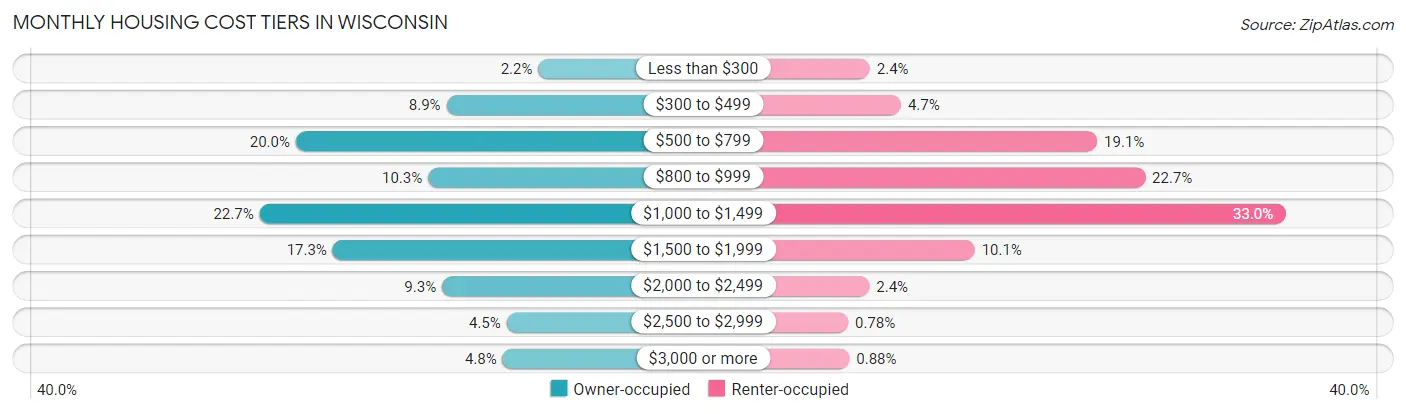
| Monthly Cost | Owner-occupied | Renter-occupied |
| Less than $300 | 35,673 (2.2%) | 18,700 (2.4%) |
| $300 to $499 | 146,609 (8.9%) | 36,659 (4.7%) |
| $500 to $799 | 328,854 (20.0%) | 149,921 (19.1%) |
| $800 to $999 | 168,934 (10.3%) | 177,645 (22.7%) |
| $1,000 to $1,499 | 372,581 (22.7%) | 258,461 (33.0%) |
| $1,500 to $1,999 | 284,239 (17.3%) | 79,264 (10.1%) |
| $2,000 to $2,499 | 152,010 (9.3%) | 18,391 (2.4%) |
| $2,500 to $2,999 | 73,857 (4.5%) | 6,093 (0.8%) |
| $3,000 or more | 78,833 (4.8%) | 6,905 (0.9%) |
| Total | 1,641,590 (100.0%) | 783,898 (100.0%) |
Physical Housing Characteristics in Wisconsin
Housing Structures in Wisconsin
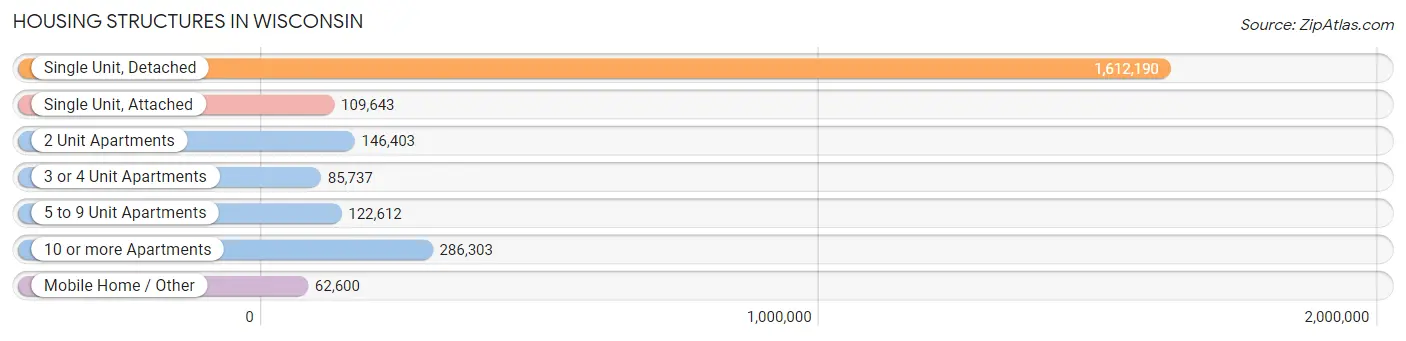
| Structure Type | # Housing Units | % Housing Units |
| Single Unit, Detached | 1,612,190 | 66.5% |
| Single Unit, Attached | 109,643 | 4.5% |
| 2 Unit Apartments | 146,403 | 6.0% |
| 3 or 4 Unit Apartments | 85,737 | 3.5% |
| 5 to 9 Unit Apartments | 122,612 | 5.1% |
| 10 or more Apartments | 286,303 | 11.8% |
| Mobile Home / Other | 62,600 | 2.6% |
| Total | 2,425,488 | 100.0% |
Housing Structures by Occupancy in Wisconsin
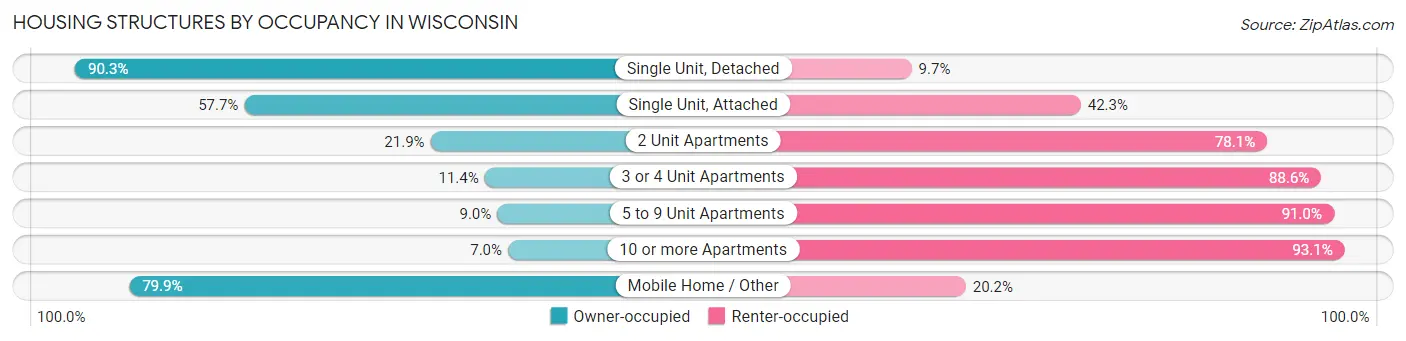
| Structure Type | Owner-occupied | Renter-occupied |
| Single Unit, Detached | 1,455,551 (90.3%) | 156,639 (9.7%) |
| Single Unit, Attached | 63,288 (57.7%) | 46,355 (42.3%) |
| 2 Unit Apartments | 32,013 (21.9%) | 114,390 (78.1%) |
| 3 or 4 Unit Apartments | 9,812 (11.4%) | 75,925 (88.6%) |
| 5 to 9 Unit Apartments | 11,055 (9.0%) | 111,557 (91.0%) |
| 10 or more Apartments | 19,888 (7.0%) | 266,415 (93.0%) |
| Mobile Home / Other | 49,983 (79.8%) | 12,617 (20.2%) |
| Total | 1,641,590 (67.7%) | 783,898 (32.3%) |
Housing Structures by Number of Rooms in Wisconsin
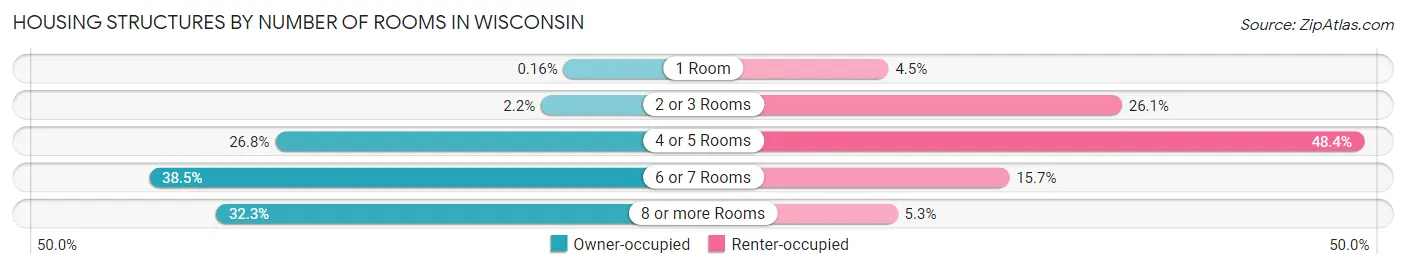
| Number of Rooms | Owner-occupied | Renter-occupied |
| 1 Room | 2,663 (0.2%) | 35,213 (4.5%) |
| 2 or 3 Rooms | 36,779 (2.2%) | 204,324 (26.1%) |
| 4 or 5 Rooms | 440,232 (26.8%) | 379,702 (48.4%) |
| 6 or 7 Rooms | 631,763 (38.5%) | 122,780 (15.7%) |
| 8 or more Rooms | 530,153 (32.3%) | 41,879 (5.3%) |
| Total | 1,641,590 (100.0%) | 783,898 (100.0%) |
Housing Structure by Heating Type in Wisconsin
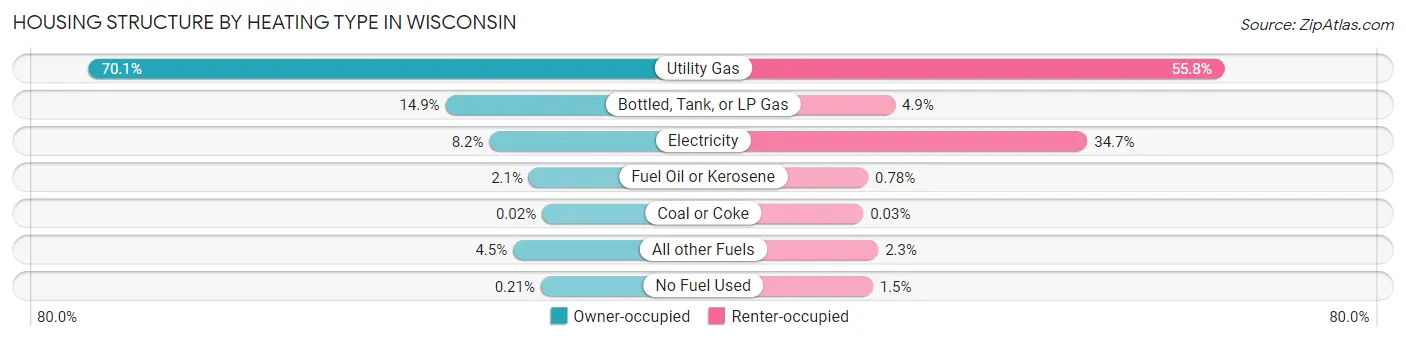
| Heating Type | Owner-occupied | Renter-occupied |
| Utility Gas | 1,150,931 (70.1%) | 436,994 (55.7%) |
| Bottled, Tank, or LP Gas | 245,335 (14.9%) | 38,689 (4.9%) |
| Electricity | 134,017 (8.2%) | 271,799 (34.7%) |
| Fuel Oil or Kerosene | 33,896 (2.1%) | 6,149 (0.8%) |
| Coal or Coke | 350 (0.0%) | 211 (0.0%) |
| All other Fuels | 73,672 (4.5%) | 18,358 (2.3%) |
| No Fuel Used | 3,389 (0.2%) | 11,698 (1.5%) |
| Total | 1,641,590 (100.0%) | 783,898 (100.0%) |
Household Vehicle Usage in Wisconsin

| Vehicles per Household | Owner-occupied | Renter-occupied |
| No Vehicle | 35,340 (2.1%) | 116,669 (14.9%) |
| 1 Vehicle | 394,195 (24.0%) | 393,448 (50.2%) |
| 2 Vehicles | 752,611 (45.9%) | 212,559 (27.1%) |
| 3 or more Vehicles | 459,444 (28.0%) | 61,222 (7.8%) |
| Total | 1,641,590 (100.0%) | 783,898 (100.0%) |
Real Estate & Mortgages in Wisconsin
Real Estate and Mortgage Overview in Wisconsin
| Characteristic | Without Mortgage | With Mortgage |
| Housing Units | 620,737 | 1,020,853 |
| Median Property Value | $215,200 | $240,600 |
| Median Household Income | $67,950 | $260,434 |
| Monthly Housing Costs | $624 | $76,973 |
| Real Estate Taxes | $3,484 | $9,039 |
Property Value by Mortgage Status in Wisconsin

| Property Value | Without Mortgage | With Mortgage |
| Less than $50,000 | 44,504 (7.2%) | 21,687 (2.1%) |
| $50,000 to $99,999 | 57,963 (9.3%) | 59,762 (5.9%) |
| $100,000 to $299,999 | 338,208 (54.5%) | 587,264 (57.5%) |
| $300,000 to $499,999 | 125,243 (20.2%) | 259,082 (25.4%) |
| $500,000 to $749,999 | 34,284 (5.5%) | 65,345 (6.4%) |
| $750,000 to $999,999 | 10,423 (1.7%) | 16,741 (1.6%) |
| $1,000,000 or more | 10,112 (1.6%) | 10,972 (1.1%) |
| Total | 620,737 (100.0%) | 1,020,853 (100.0%) |
Household Income by Mortgage Status in Wisconsin

| Household Income | Without Mortgage | With Mortgage |
| Less than $10,000 | 22,922 (3.7%) | 21,276 (2.1%) |
| $10,000 to $24,999 | 59,721 (9.6%) | 14,350 (1.4%) |
| $25,000 to $34,999 | 57,047 (9.2%) | 33,819 (3.3%) |
| $35,000 to $49,999 | 78,163 (12.6%) | 36,983 (3.6%) |
| $50,000 to $74,999 | 122,885 (19.8%) | 73,364 (7.2%) |
| $75,000 to $99,999 | 88,555 (14.3%) | 164,057 (16.1%) |
| $100,000 to $149,999 | 99,140 (16.0%) | 164,144 (16.1%) |
| $150,000 or more | 92,304 (14.9%) | 273,702 (26.8%) |
| Total | 620,737 (100.0%) | 1,020,853 (100.0%) |
Property Value to Household Income Ratio in Wisconsin
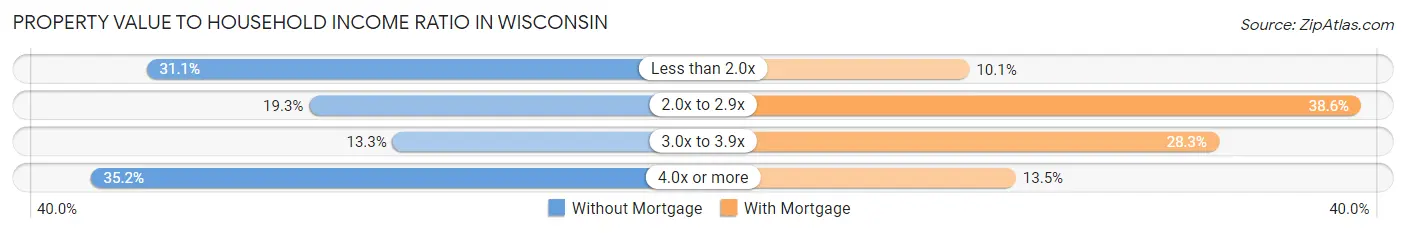
| Value-to-Income Ratio | Without Mortgage | With Mortgage |
| Less than 2.0x | 193,242 (31.1%) | 103,471 (10.1%) |
| 2.0x to 2.9x | 119,968 (19.3%) | 393,709 (38.6%) |
| 3.0x to 3.9x | 82,378 (13.3%) | 288,412 (28.2%) |
| 4.0x or more | 218,511 (35.2%) | 137,950 (13.5%) |
| Total | 620,737 (100.0%) | 1,020,853 (100.0%) |
Real Estate Taxes by Mortgage Status in Wisconsin
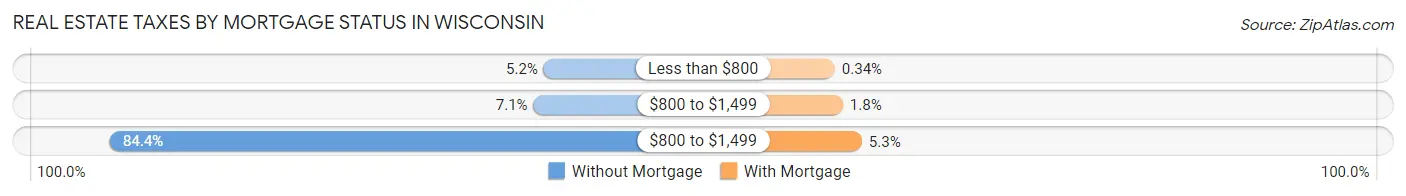
| Property Taxes | Without Mortgage | With Mortgage |
| Less than $800 | 32,175 (5.2%) | 3,499 (0.3%) |
| $800 to $1,499 | 43,875 (7.1%) | 18,394 (1.8%) |
| $800 to $1,499 | 523,977 (84.4%) | 53,825 (5.3%) |
| Total | 620,737 (100.0%) | 1,020,853 (100.0%) |
Health & Disability in Wisconsin
Health Insurance Coverage by Age in Wisconsin
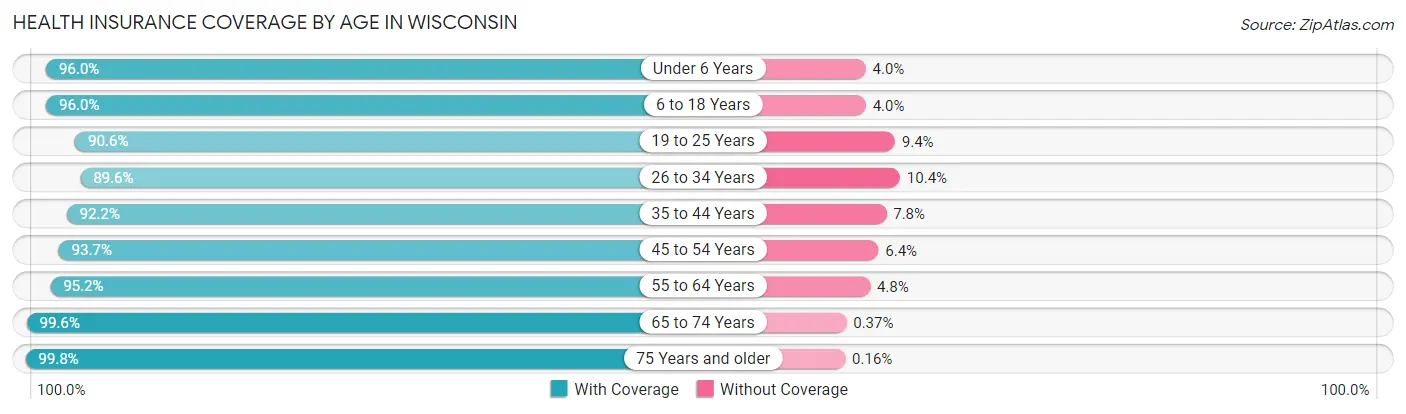
| Age Bracket | With Coverage | Without Coverage |
| Under 6 Years | 374,728 (96.0%) | 15,541 (4.0%) |
| 6 to 18 Years | 924,187 (96.0%) | 38,497 (4.0%) |
| 19 to 25 Years | 493,735 (90.6%) | 51,343 (9.4%) |
| 26 to 34 Years | 585,121 (89.6%) | 67,673 (10.4%) |
| 35 to 44 Years | 665,167 (92.2%) | 56,512 (7.8%) |
| 45 to 54 Years | 663,925 (93.6%) | 45,050 (6.4%) |
| 55 to 64 Years | 783,735 (95.2%) | 39,334 (4.8%) |
| 65 to 74 Years | 609,114 (99.6%) | 2,268 (0.4%) |
| 75 Years and older | 399,101 (99.8%) | 646 (0.2%) |
| Total | 5,498,813 (94.6%) | 316,864 (5.4%) |
Health Insurance Coverage by Citizenship Status in Wisconsin
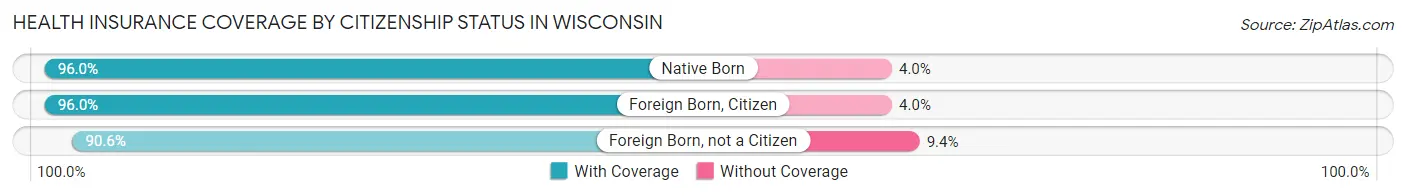
| Citizenship Status | With Coverage | Without Coverage |
| Native Born | 374,728 (96.0%) | 15,541 (4.0%) |
| Foreign Born, Citizen | 924,187 (96.0%) | 38,497 (4.0%) |
| Foreign Born, not a Citizen | 493,735 (90.6%) | 51,343 (9.4%) |
Health Insurance Coverage by Household Income in Wisconsin
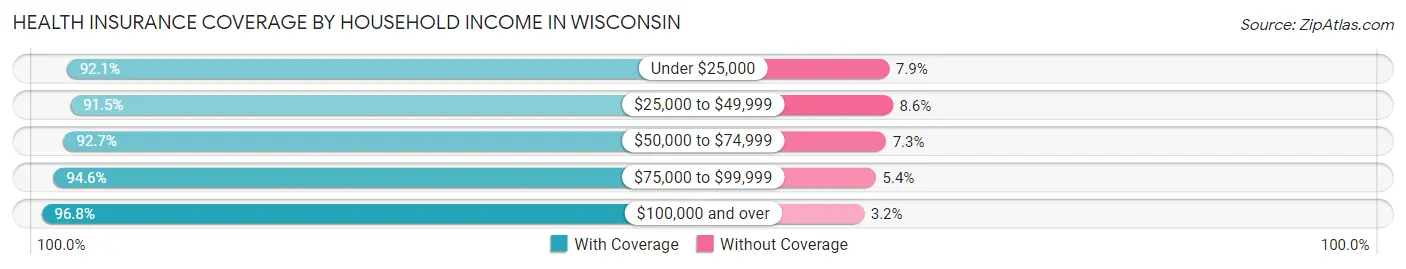
| Household Income | With Coverage | Without Coverage |
| Under $25,000 | 502,669 (92.1%) | 43,055 (7.9%) |
| $25,000 to $49,999 | 797,887 (91.4%) | 74,636 (8.6%) |
| $50,000 to $74,999 | 879,596 (92.7%) | 69,157 (7.3%) |
| $75,000 to $99,999 | 821,080 (94.6%) | 46,854 (5.4%) |
| $100,000 and over | 2,420,475 (96.8%) | 79,431 (3.2%) |
Public vs Private Health Insurance Coverage by Age in Wisconsin
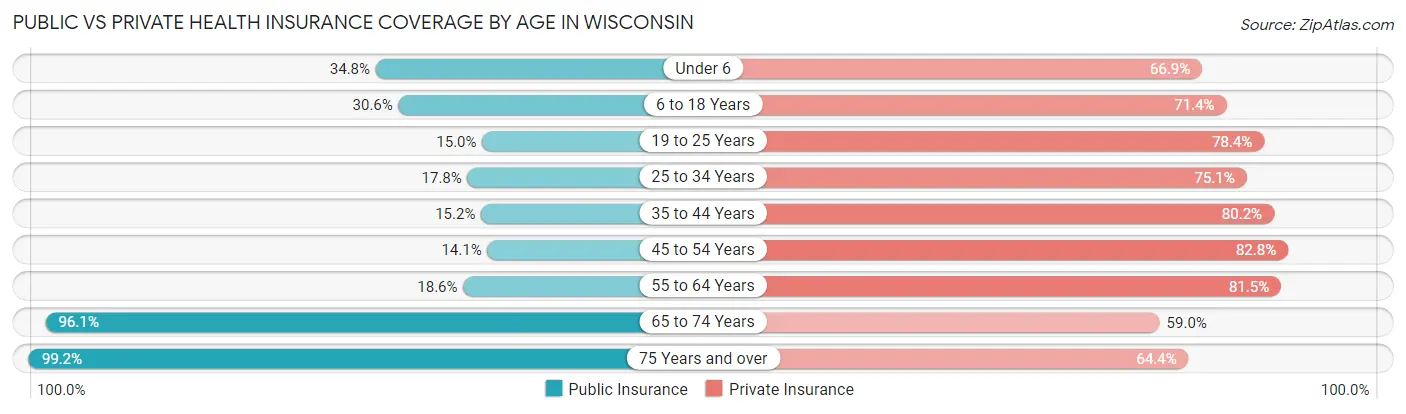
| Age Bracket | Public Insurance | Private Insurance |
| Under 6 | 135,813 (34.8%) | 260,965 (66.9%) |
| 6 to 18 Years | 294,429 (30.6%) | 687,180 (71.4%) |
| 19 to 25 Years | 81,913 (15.0%) | 427,339 (78.4%) |
| 25 to 34 Years | 116,027 (17.8%) | 490,468 (75.1%) |
| 35 to 44 Years | 110,018 (15.2%) | 578,783 (80.2%) |
| 45 to 54 Years | 99,850 (14.1%) | 587,089 (82.8%) |
| 55 to 64 Years | 152,745 (18.6%) | 671,006 (81.5%) |
| 65 to 74 Years | 587,634 (96.1%) | 360,744 (59.0%) |
| 75 Years and over | 396,643 (99.2%) | 257,231 (64.3%) |
| Total | 1,975,072 (34.0%) | 4,320,805 (74.3%) |
Disability Status by Sex by Age in Wisconsin
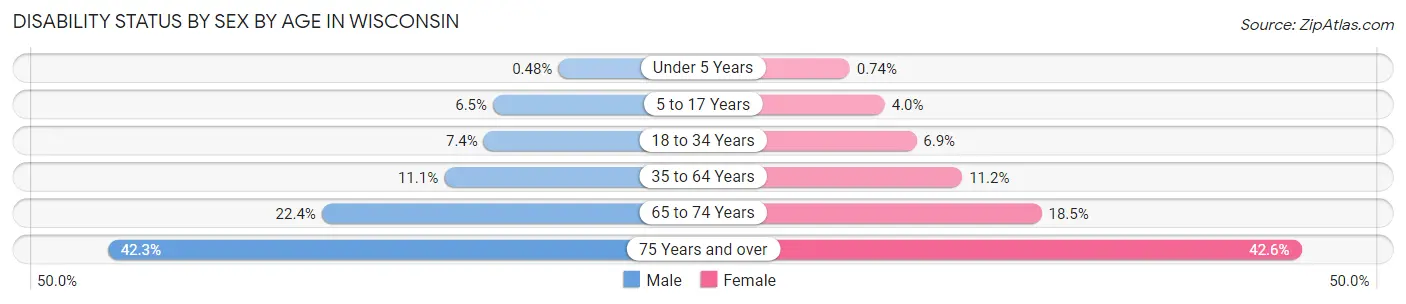
| Age Bracket | Male | Female |
| Under 5 Years | 790 (0.5%) | 1,157 (0.7%) |
| 5 to 17 Years | 31,724 (6.5%) | 18,405 (4.0%) |
| 18 to 34 Years | 48,237 (7.4%) | 43,634 (6.9%) |
| 35 to 64 Years | 125,798 (11.1%) | 124,964 (11.2%) |
| 65 to 74 Years | 67,171 (22.4%) | 57,829 (18.5%) |
| 75 Years and over | 71,478 (42.3%) | 98,352 (42.6%) |
Disability Class by Sex by Age in Wisconsin
Disability Class: Hearing Difficulty
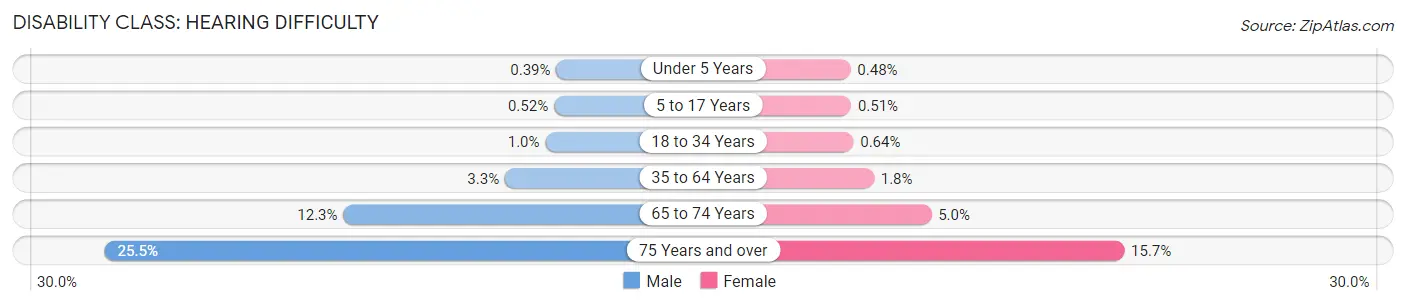
| Age Bracket | Male | Female |
| Under 5 Years | 642 (0.4%) | 757 (0.5%) |
| 5 to 17 Years | 2,522 (0.5%) | 2,335 (0.5%) |
| 18 to 34 Years | 6,531 (1.0%) | 4,012 (0.6%) |
| 35 to 64 Years | 36,894 (3.3%) | 19,894 (1.8%) |
| 65 to 74 Years | 36,673 (12.2%) | 15,535 (5.0%) |
| 75 Years and over | 43,182 (25.5%) | 36,269 (15.7%) |
Disability Class: Vision Difficulty
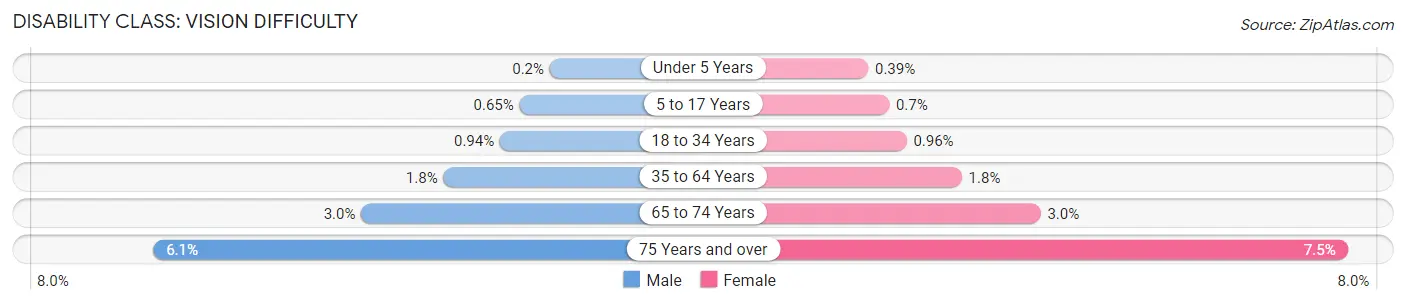
| Age Bracket | Male | Female |
| Under 5 Years | 337 (0.2%) | 613 (0.4%) |
| 5 to 17 Years | 3,136 (0.6%) | 3,248 (0.7%) |
| 18 to 34 Years | 6,141 (0.9%) | 6,082 (1.0%) |
| 35 to 64 Years | 20,178 (1.8%) | 19,881 (1.8%) |
| 65 to 74 Years | 8,969 (3.0%) | 9,192 (2.9%) |
| 75 Years and over | 10,293 (6.1%) | 17,314 (7.5%) |
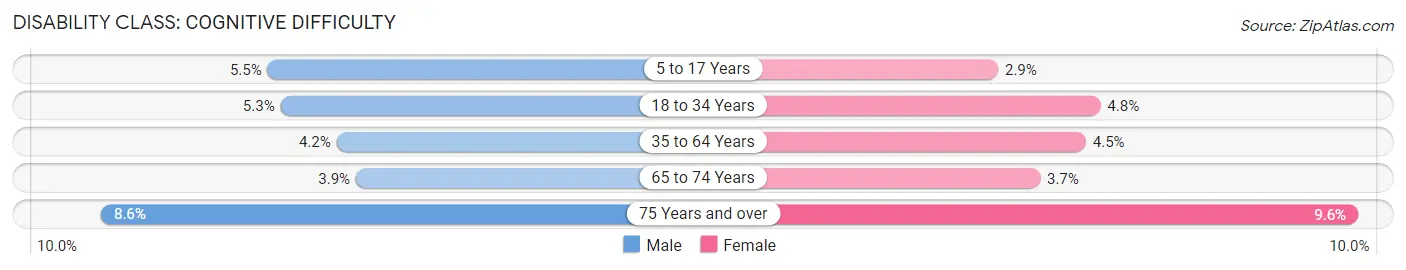
Disability Class: Cognitive Difficulty
| Age Bracket | Male | Female |
| 5 to 17 Years | 26,638 (5.5%) | 13,354 (2.9%) |
| 18 to 34 Years | 34,204 (5.2%) | 30,277 (4.8%) |
| 35 to 64 Years | 47,785 (4.2%) | 50,703 (4.5%) |
| 65 to 74 Years | 11,514 (3.8%) | 11,470 (3.7%) |
| 75 Years and over | 14,498 (8.6%) | 22,105 (9.6%) |
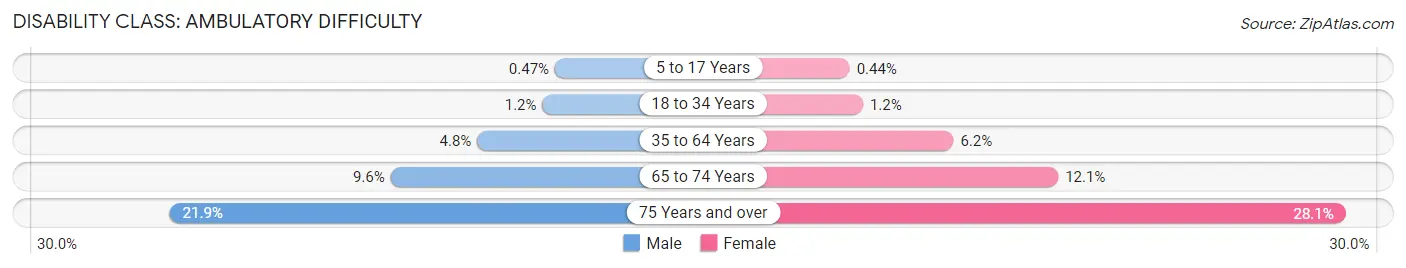
Disability Class: Ambulatory Difficulty
| Age Bracket | Male | Female |
| 5 to 17 Years | 2,293 (0.5%) | 2,044 (0.4%) |
| 18 to 34 Years | 7,646 (1.2%) | 7,431 (1.2%) |
| 35 to 64 Years | 54,524 (4.8%) | 69,559 (6.2%) |
| 65 to 74 Years | 28,819 (9.6%) | 37,602 (12.0%) |
| 75 Years and over | 37,052 (21.9%) | 64,707 (28.1%) |
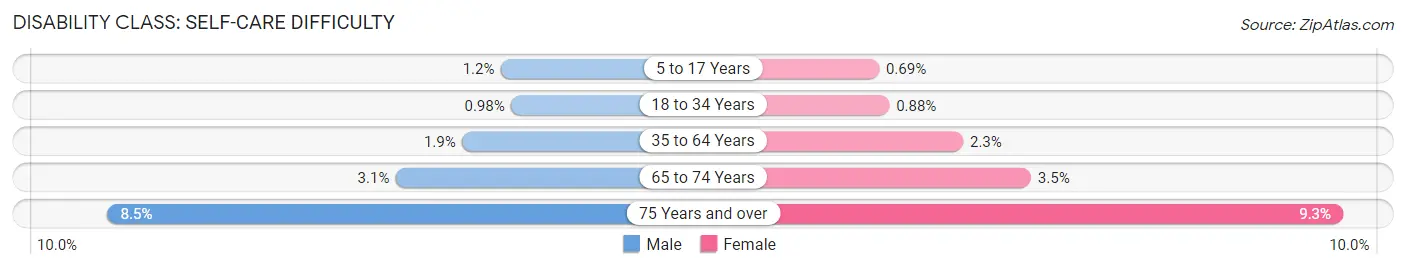
Disability Class: Self-Care Difficulty
| Age Bracket | Male | Female |
| 5 to 17 Years | 5,696 (1.2%) | 3,190 (0.7%) |
| 18 to 34 Years | 6,397 (1.0%) | 5,538 (0.9%) |
| 35 to 64 Years | 21,429 (1.9%) | 25,197 (2.2%) |
| 65 to 74 Years | 9,336 (3.1%) | 10,964 (3.5%) |
| 75 Years and over | 14,311 (8.5%) | 21,448 (9.3%) |
Technology Access in Wisconsin
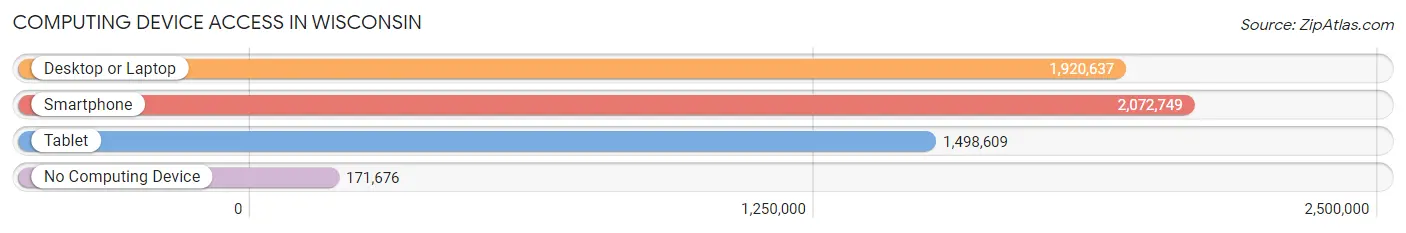
Computing Device Access in Wisconsin
| Device Type | # Households | % Households |
| Desktop or Laptop | 1,920,637 | 79.2% |
| Smartphone | 2,072,749 | 85.5% |
| Tablet | 1,498,609 | 61.8% |
| No Computing Device | 171,676 | 7.1% |
| Total | 2,425,488 | 100.0% |
Internet Access in Wisconsin
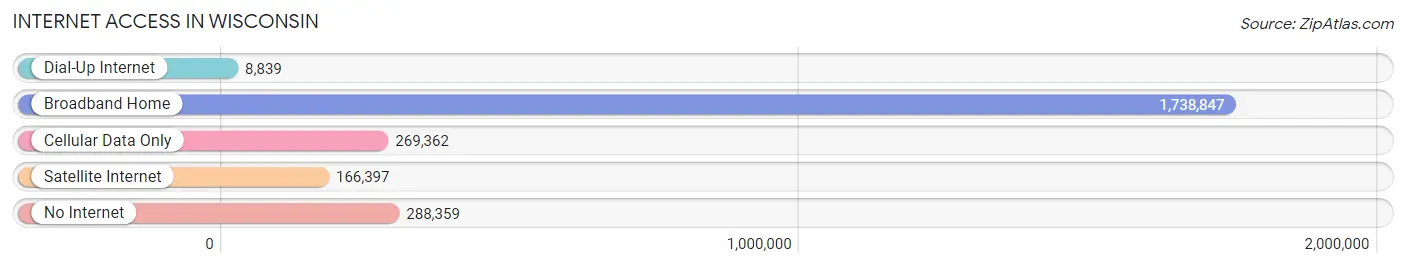
| Internet Type | # Households | % Households |
| Dial-Up Internet | 8,839 | 0.4% |
| Broadband Home | 1,738,847 | 71.7% |
| Cellular Data Only | 269,362 | 11.1% |
| Satellite Internet | 166,397 | 6.9% |
| No Internet | 288,359 | 11.9% |
| Total | 2,425,488 | 100.0% |
Wisconsin Summary
Wisconsin is a state located in the Midwestern United States. It is bordered by Minnesota to the west, Iowa to the southwest, Illinois to the south, Lake Michigan to the east, and Michigan to the northeast. Wisconsin is the 23rd largest state by total area and the 20th most populous. The state capital is Madison, and its largest city is Milwaukee.
Geography
Wisconsin is located in the north-central United States, in the Midwest and Great Lakes regions. It is bordered by Minnesota to the west, Iowa to the southwest, Illinois to the south, Lake Michigan to the east, and Michigan to the northeast. Wisconsin's geography is diverse, with the Northern Highland and Western Upland along with a part of the Central Plain occupying the western part of the state, and lowlands stretching to the shore of Lake Michigan. The state is divided into five distinct regions: the Lake Superior Lowland, the Northern Highland, the Central Plain, the Eastern Ridges and Lowlands, and the Western Upland.
History
Wisconsin has a long and rich history. The first inhabitants of the area were Native American tribes, including the Menominee, Ojibwe, Potawatomi, and Ho-Chunk. French explorers Jacques Marquette and Louis Jolliet explored the area in 1673, and the first permanent European settlement was established in 1679. The area was part of the French colony of New France until 1763, when it was ceded to Great Britain after the French and Indian War. The area was part of the British Province of Quebec until 1783, when it became part of the United States after the American Revolution. Wisconsin was part of the Northwest Territory until 1802, when it became part of the Indiana Territory. In 1818, Wisconsin became part of the Michigan Territory, and in 1836 it became its own territory. Wisconsin was admitted to the Union as the 30th state on May 29, 1848.
Economy
Wisconsin has a diversified economy, with major sectors including manufacturing, agriculture, health care, and tourism. The state is a major producer of dairy products, cranberries, ginseng, and paper products. Wisconsin is also home to several major companies, including Harley-Davidson, Johnson Controls, and Kohl's. The state's economy is also supported by a strong tourism industry, with major attractions including the Wisconsin Dells, the Apostle Islands National Lakeshore, and the Wisconsin State Fair.
Demographics
As of the 2010 census, the population of Wisconsin was 5,686,986. The state is predominantly white (86.3%), with smaller percentages of African Americans (6.7%), Asians (2.7%), and Native Americans (1.1%). The largest ancestry groups in the state are German (33.2%), Irish (13.2%), Polish (9.5%), and Norwegian (7.9%). The median household income in Wisconsin is $55,638, and the median age is 38.7. The state's largest cities are Milwaukee, Madison, Green Bay, Kenosha, and Racine.
Wisconsin is a politically divided state, with the majority of the population identifying as either Republican (47.2%) or Democratic (45.3%). The state has voted for the Democratic candidate in every presidential election since 1988.
Common Questions
When was Wisconsin Incorporated?
Wisconsin was Incorporated into the Union on May 29, 1848.
What is the Total Area of Wisconsin?
Total Area of Wisconsin is 65,496 Square Miles.
What is the Total Land Area of Wisconsin?
Total Land Area of Wisconsin is 54,154 Square Miles.
What is the Total Water Area of Wisconsin?
Total Water Area of Wisconsin is 11,342 Square Miles.
What is the Average Elevation in Wisconsin?
Average Elevation in Wisconsin is 1,050 Feet.
What is the Highest Elevation in Wisconsin?
Highest Elevation in Wisconsin is 1,951 Feet.
What is the Lowest Elevation in Wisconsin?
Lowest Elevation in Wisconsin is 581 Feet.
What is the Population Density in Wisconsin?
Population Density in Wisconsin is 108.6 People per Square Mile.
What is Per Capita Income in Wisconsin?
Per Capita income in Wisconsin is $40,130.
What is the Median Family Income in Wisconsin?
Median Family Income in Wisconsin is $92,974.
What is the Median Household income in Wisconsin?
Median Household Income in Wisconsin is $72,458.
What is Income or Wage Gap in Wisconsin?
Income or Wage Gap in Wisconsin is 29.4%.
Women in Wisconsin earn 70.6 cents for every dollar earned by a man.
What is Family Income Deficit in Wisconsin?
Family Income Deficit in Wisconsin is $10,543.
Families that are below poverty line in Wisconsin earn $10,543 less on average than the poverty threshold level.
What is Inequality or Gini Index in Wisconsin?
Inequality or Gini Index in Wisconsin is 0.44.
What is the Total Population of Wisconsin?
Total Population of Wisconsin is 5,882,128.
What is the Total Male Population of Wisconsin?
Total Male Population of Wisconsin is 2,948,762.
What is the Total Female Population of Wisconsin?
Total Female Population of Wisconsin is 2,933,366.
What is the Ratio of Males per 100 Females in Wisconsin?
There are 100.52 Males per 100 Females in Wisconsin.
What is the Ratio of Females per 100 Males in Wisconsin?
There are 99.48 Females per 100 Males in Wisconsin.
What is the Median Population Age in Wisconsin?
Median Population Age in Wisconsin is 39.9 Years.
What is the Average Family Size in Wisconsin
Average Family Size in Wisconsin is 3.0 People.
What is the Average Household Size in Wisconsin
Average Household Size in Wisconsin is 2.4 People.
How Large is the Labor Force in Wisconsin?
There are 3,130,460 People in the Labor Forcein in Wisconsin.
What is the Percentage of People in the Labor Force in Wisconsin?
65.7% of People are in the Labor Force in Wisconsin.
What is the Unemployment Rate in Wisconsin?
Unemployment Rate in Wisconsin is 3.4%.