Bayview CDP Contra Costa County, CA Map & Demographics
Bayview CDP Contra Costa County Overview
$49,367
PER CAPITA INCOME
$154,061
AVG FAMILY INCOME
$152,803
AVG HOUSEHOLD INCOME
11.7%
WAGE / INCOME GAP [ % ]
88.3¢/ $1
WAGE / INCOME GAP [ $ ]
0.32
INEQUALITY / GINI INDEX
2,529
TOTAL POPULATION
1,348
MALE POPULATION
1,181
FEMALE POPULATION
114.14
MALES / 100 FEMALES
87.61
FEMALES / 100 MALES
44.5
MEDIAN AGE
3.6
AVG FAMILY SIZE
3.1
AVG HOUSEHOLD SIZE
1,544
LABOR FORCE [ PEOPLE ]
67.0%
PERCENT IN LABOR FORCE
9.7%
UNEMPLOYMENT RATE
Income in Bayview CDP Contra Costa County
Income Overview in Bayview CDP Contra Costa County
Per Capita Income in Bayview CDP Contra Costa County is $49,367, while median incomes of families and households are $154,061 and $152,803 respectively.
| Characteristic | Number | Measure |
| Per Capita Income | 2,529 | $49,367 |
| Median Family Income | 645 | $154,061 |
| Mean Family Income | 645 | $171,043 |
| Median Household Income | 807 | $152,803 |
| Mean Household Income | 807 | $151,707 |
| Income Deficit | 645 | $0 |
| Wage / Income Gap (%) | 2,529 | 11.75% |
| Wage / Income Gap ($) | 2,529 | 88.25¢ per $1 |
| Gini / Inequality Index | 2,529 | 0.32 |
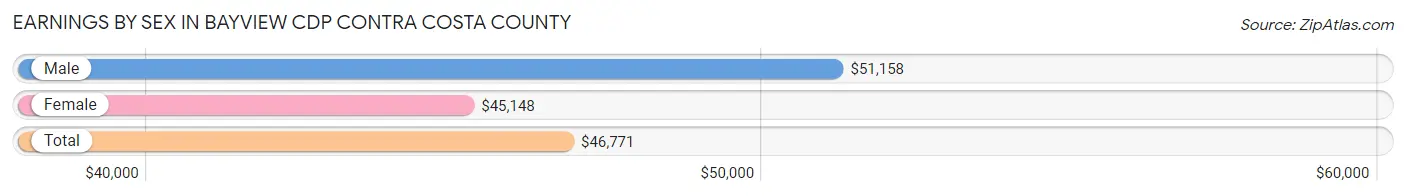
Earnings by Sex in Bayview CDP Contra Costa County
Average Earnings in Bayview CDP Contra Costa County are $46,771, $51,158 for men and $45,148 for women, a difference of 11.7%.
| Sex | Number | Average Earnings |
| Male | 925 (60.6%) | $51,158 |
| Female | 601 (39.4%) | $45,148 |
| Total | 1,526 (100.0%) | $46,771 |
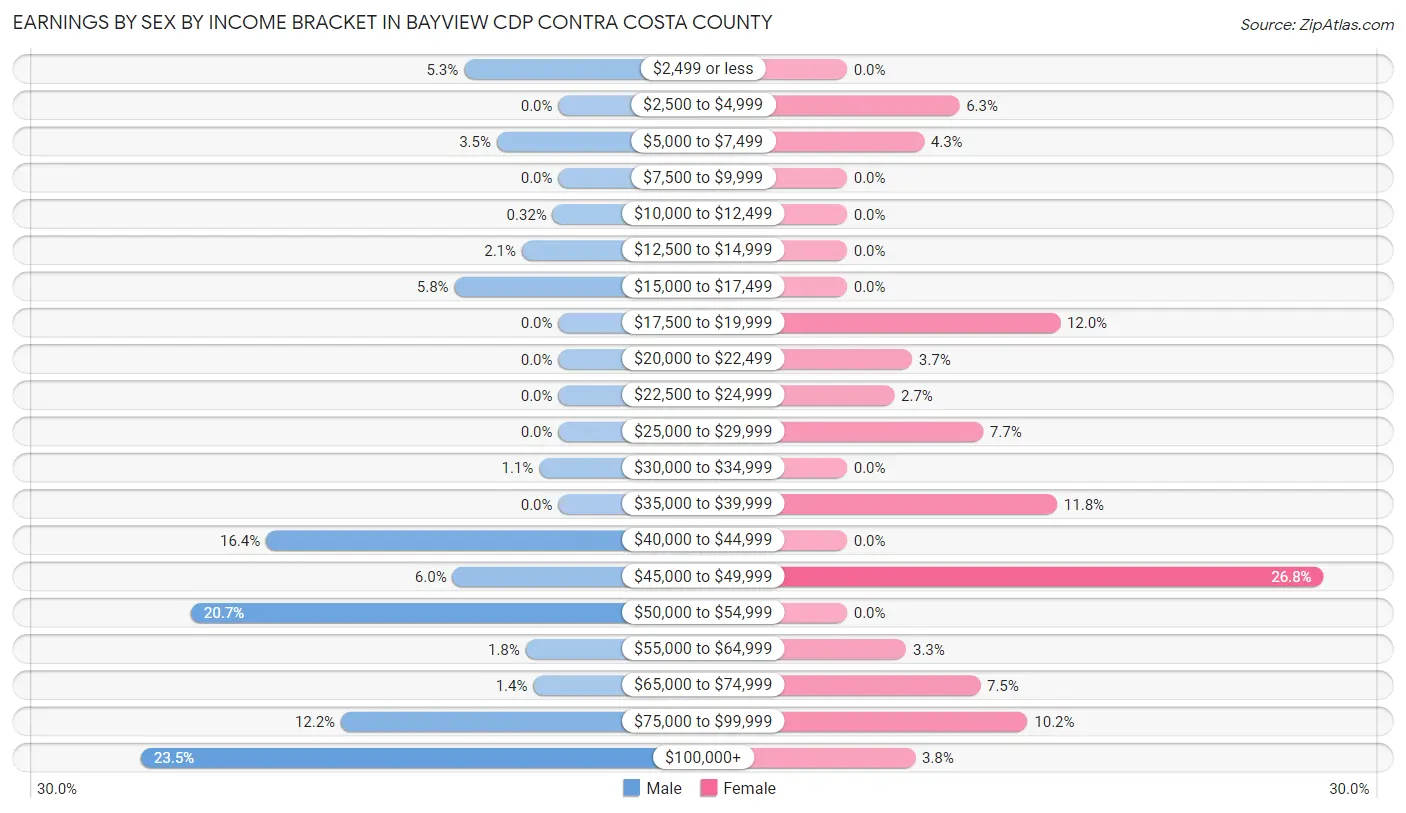
Earnings by Sex by Income Bracket in Bayview CDP Contra Costa County
The most common earnings brackets in Bayview CDP Contra Costa County are $100,000+ for men (217 | 23.5%) and $45,000 to $49,999 for women (161 | 26.8%).
| Income | Male | Female |
| $2,499 or less | 49 (5.3%) | 0 (0.0%) |
| $2,500 to $4,999 | 0 (0.0%) | 38 (6.3%) |
| $5,000 to $7,499 | 32 (3.5%) | 26 (4.3%) |
| $7,500 to $9,999 | 0 (0.0%) | 0 (0.0%) |
| $10,000 to $12,499 | 3 (0.3%) | 0 (0.0%) |
| $12,500 to $14,999 | 19 (2.1%) | 0 (0.0%) |
| $15,000 to $17,499 | 54 (5.8%) | 0 (0.0%) |
| $17,500 to $19,999 | 0 (0.0%) | 72 (12.0%) |
| $20,000 to $22,499 | 0 (0.0%) | 22 (3.7%) |
| $22,500 to $24,999 | 0 (0.0%) | 16 (2.7%) |
| $25,000 to $29,999 | 0 (0.0%) | 46 (7.6%) |
| $30,000 to $34,999 | 10 (1.1%) | 0 (0.0%) |
| $35,000 to $39,999 | 0 (0.0%) | 71 (11.8%) |
| $40,000 to $44,999 | 152 (16.4%) | 0 (0.0%) |
| $45,000 to $49,999 | 55 (5.9%) | 161 (26.8%) |
| $50,000 to $54,999 | 191 (20.6%) | 0 (0.0%) |
| $55,000 to $64,999 | 17 (1.8%) | 20 (3.3%) |
| $65,000 to $74,999 | 13 (1.4%) | 45 (7.5%) |
| $75,000 to $99,999 | 113 (12.2%) | 61 (10.2%) |
| $100,000+ | 217 (23.5%) | 23 (3.8%) |
| Total | 925 (100.0%) | 601 (100.0%) |
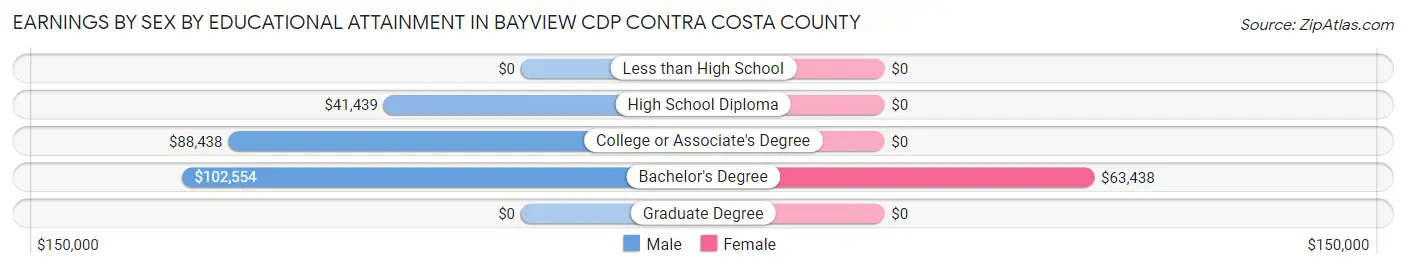
Earnings by Sex by Educational Attainment in Bayview CDP Contra Costa County
Average earnings in Bayview CDP Contra Costa County are $60,221 for men and $46,203 for women, a difference of 23.3%. Men with an educational attainment of bachelor's degree enjoy the highest average annual earnings of $102,554, while those with high school diploma education earn the least with $41,439. Women with an educational attainment of bachelor's degree earn the most with the average annual earnings of $63,438, while those with bachelor's degree education have the smallest earnings of $63,438.
| Educational Attainment | Male Income | Female Income |
| Less than High School | - | - |
| High School Diploma | $41,439 | $0 |
| College or Associate's Degree | $88,438 | $0 |
| Bachelor's Degree | $102,554 | $63,438 |
| Graduate Degree | - | - |
| Total | $60,221 | $46,203 |
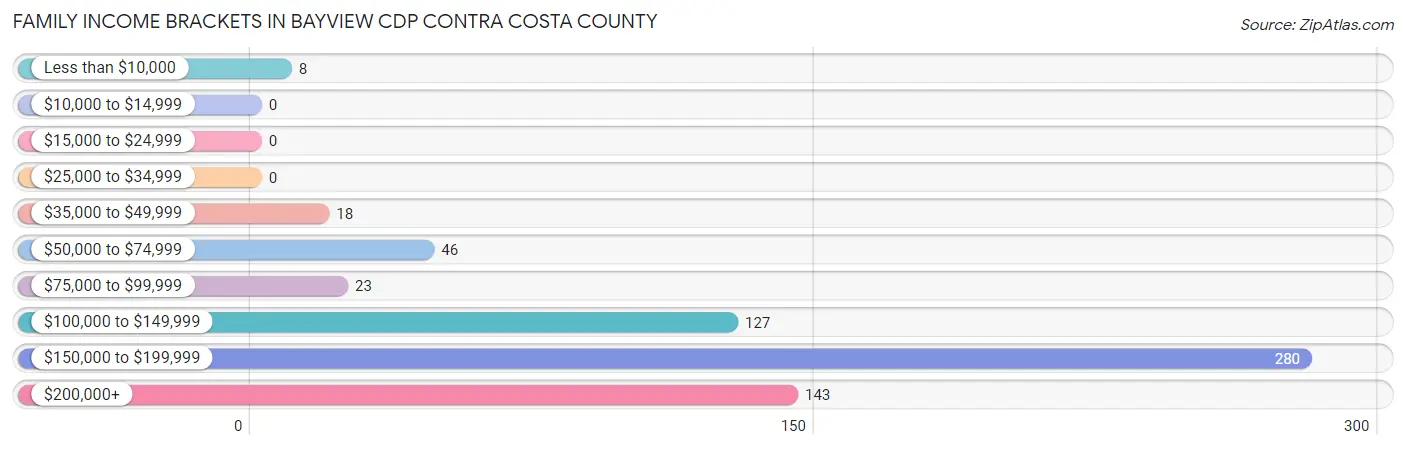
Family Income in Bayview CDP Contra Costa County
Family Income Brackets in Bayview CDP Contra Costa County
According to the Bayview CDP Contra Costa County family income data, there are 280 families falling into the $150,000 to $199,999 income range, which is the most common income bracket and makes up 43.4% of all families.
| Income Bracket | # Families | % Families |
| Less than $10,000 | 8 | 1.2% |
| $10,000 to $14,999 | 0 | 0.0% |
| $15,000 to $24,999 | 0 | 0.0% |
| $25,000 to $34,999 | 0 | 0.0% |
| $35,000 to $49,999 | 18 | 2.8% |
| $50,000 to $74,999 | 46 | 7.1% |
| $75,000 to $99,999 | 23 | 3.6% |
| $100,000 to $149,999 | 127 | 19.7% |
| $150,000 to $199,999 | 280 | 43.4% |
| $200,000+ | 143 | 22.2% |
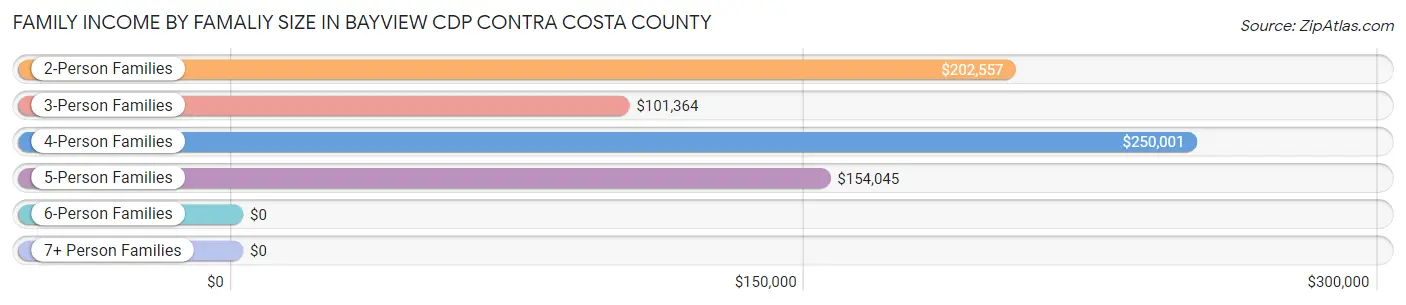
Family Income by Famaliy Size in Bayview CDP Contra Costa County
4-person families (103 | 16.0%) account for the highest median family income in Bayview CDP Contra Costa County with $250,001 per family, while 2-person families (129 | 20.0%) have the highest median income of $101,278 per family member.
| Income Bracket | # Families | Median Income |
| 2-Person Families | 129 (20.0%) | $202,557 |
| 3-Person Families | 214 (33.2%) | $101,364 |
| 4-Person Families | 103 (16.0%) | $250,001 |
| 5-Person Families | 199 (30.8%) | $154,045 |
| 6-Person Families | 0 (0.0%) | $0 |
| 7+ Person Families | 0 (0.0%) | $0 |
| Total | 645 (100.0%) | $154,061 |
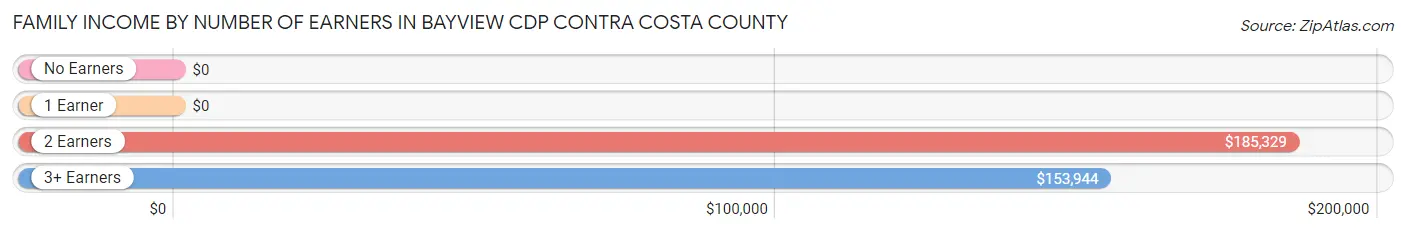
Family Income by Number of Earners in Bayview CDP Contra Costa County
| Number of Earners | # Families | Median Income |
| No Earners | 78 (12.1%) | $0 |
| 1 Earner | 124 (19.2%) | $0 |
| 2 Earners | 173 (26.8%) | $185,329 |
| 3+ Earners | 270 (41.9%) | $153,944 |
| Total | 645 (100.0%) | $154,061 |
Household Income in Bayview CDP Contra Costa County
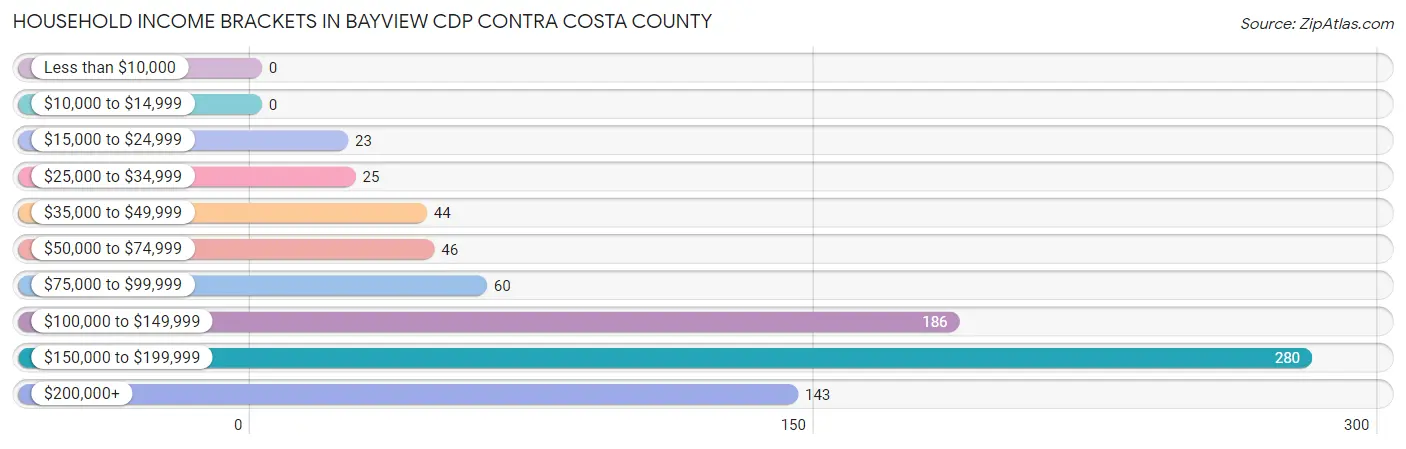
Household Income Brackets in Bayview CDP Contra Costa County
With 280 households falling in the category, the $150,000 to $199,999 income range is the most frequent in Bayview CDP Contra Costa County, accounting for 34.7% of all households.
| Income Bracket | # Households | % Households |
| Less than $10,000 | 0 | 0.0% |
| $10,000 to $14,999 | 0 | 0.0% |
| $15,000 to $24,999 | 23 | 2.9% |
| $25,000 to $34,999 | 25 | 3.1% |
| $35,000 to $49,999 | 44 | 5.5% |
| $50,000 to $74,999 | 46 | 5.7% |
| $75,000 to $99,999 | 60 | 7.4% |
| $100,000 to $149,999 | 186 | 23.0% |
| $150,000 to $199,999 | 280 | 34.7% |
| $200,000+ | 143 | 17.7% |
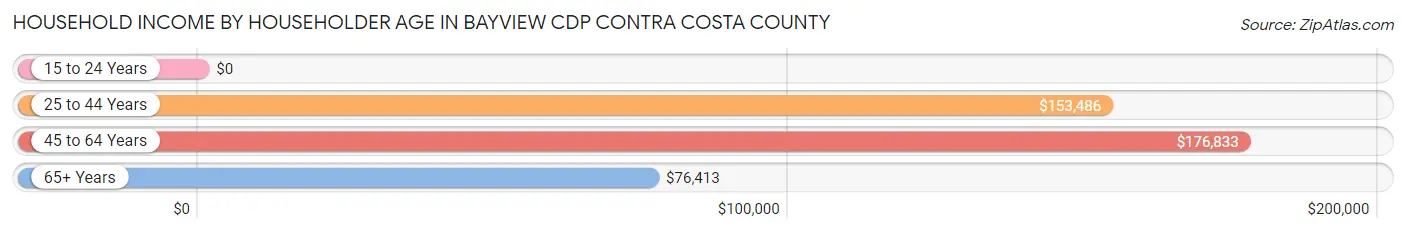
Household Income by Householder Age in Bayview CDP Contra Costa County
The median household income in Bayview CDP Contra Costa County is $152,803, with the highest median household income of $176,833 found in the 45 to 64 years age bracket for the primary householder. A total of 250 households (31.0%) fall into this category.
| Income Bracket | # Households | Median Income |
| 15 to 24 Years | 0 (0.0%) | $0 |
| 25 to 44 Years | 289 (35.8%) | $153,486 |
| 45 to 64 Years | 250 (31.0%) | $176,833 |
| 65+ Years | 268 (33.2%) | $76,413 |
| Total | 807 (100.0%) | $152,803 |
Poverty in Bayview CDP Contra Costa County
Income Below Poverty by Sex and Age in Bayview CDP Contra Costa County
With 1.2% poverty level for males and 2.5% for females among the residents of Bayview CDP Contra Costa County, 12 to 14 year old males and 55 to 64 year old females are the most vulnerable to poverty, with 8 males (30.8%) and 22 females (15.7%) in their respective age groups living below the poverty level.
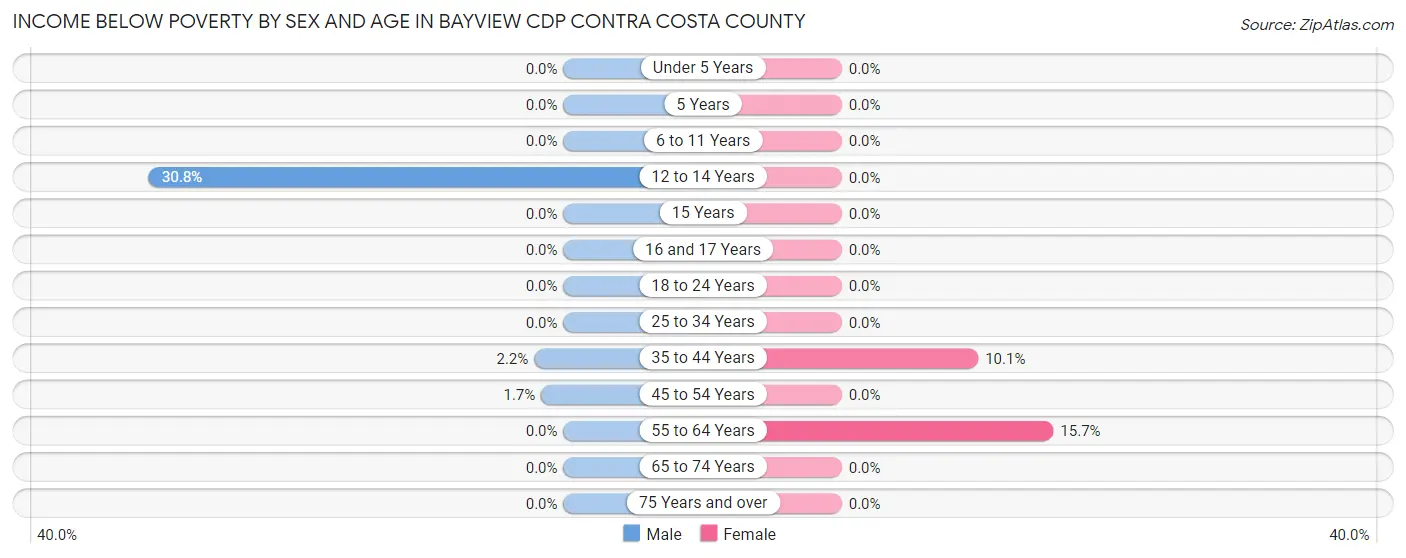
| Age Bracket | Male | Female |
| Under 5 Years | 0 (0.0%) | 0 (0.0%) |
| 5 Years | 0 (0.0%) | 0 (0.0%) |
| 6 to 11 Years | 0 (0.0%) | 0 (0.0%) |
| 12 to 14 Years | 8 (30.8%) | 0 (0.0%) |
| 15 Years | 0 (0.0%) | 0 (0.0%) |
| 16 and 17 Years | 0 (0.0%) | 0 (0.0%) |
| 18 to 24 Years | 0 (0.0%) | 0 (0.0%) |
| 25 to 34 Years | 0 (0.0%) | 0 (0.0%) |
| 35 to 44 Years | 5 (2.2%) | 8 (10.1%) |
| 45 to 54 Years | 3 (1.7%) | 0 (0.0%) |
| 55 to 64 Years | 0 (0.0%) | 22 (15.7%) |
| 65 to 74 Years | 0 (0.0%) | 0 (0.0%) |
| 75 Years and over | 0 (0.0%) | 0 (0.0%) |
| Total | 16 (1.2%) | 30 (2.5%) |
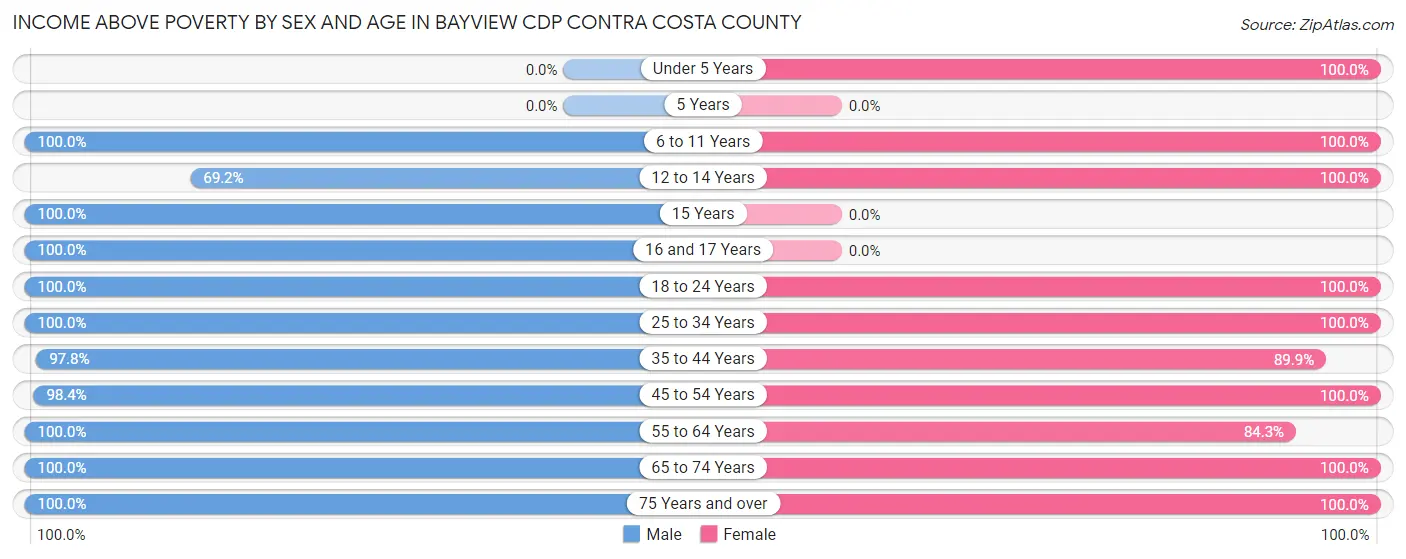
Income Above Poverty by Sex and Age in Bayview CDP Contra Costa County
According to the poverty statistics in Bayview CDP Contra Costa County, males aged 6 to 11 years and females aged under 5 years are the age groups that are most secure financially, with 100.0% of males and 100.0% of females in these age groups living above the poverty line.
| Age Bracket | Male | Female |
| Under 5 Years | 0 (0.0%) | 26 (100.0%) |
| 5 Years | 0 (0.0%) | 0 (0.0%) |
| 6 to 11 Years | 32 (100.0%) | 11 (100.0%) |
| 12 to 14 Years | 18 (69.2%) | 117 (100.0%) |
| 15 Years | 12 (100.0%) | 0 (0.0%) |
| 16 and 17 Years | 15 (100.0%) | 0 (0.0%) |
| 18 to 24 Years | 249 (100.0%) | 160 (100.0%) |
| 25 to 34 Years | 221 (100.0%) | 176 (100.0%) |
| 35 to 44 Years | 225 (97.8%) | 71 (89.9%) |
| 45 to 54 Years | 179 (98.4%) | 262 (100.0%) |
| 55 to 64 Years | 158 (100.0%) | 118 (84.3%) |
| 65 to 74 Years | 100 (100.0%) | 45 (100.0%) |
| 75 Years and over | 123 (100.0%) | 165 (100.0%) |
| Total | 1,332 (98.8%) | 1,151 (97.5%) |
Income Below Poverty Among Married-Couple Families in Bayview CDP Contra Costa County
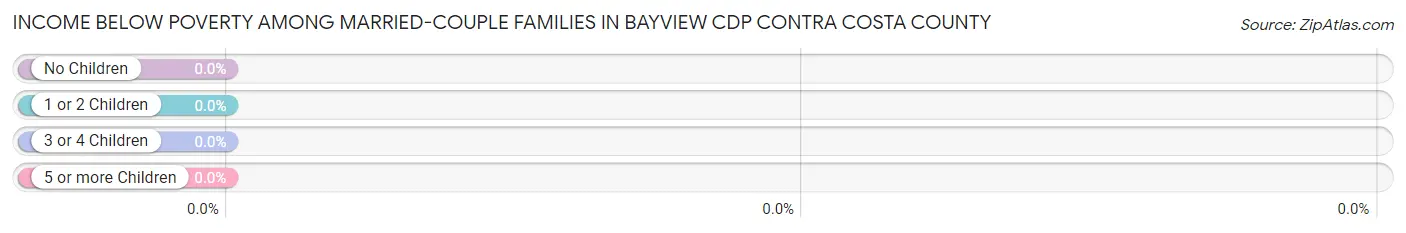
| Children | Above Poverty | Below Poverty |
| No Children | 300 (100.0%) | 0 (0.0%) |
| 1 or 2 Children | 64 (100.0%) | 0 (0.0%) |
| 3 or 4 Children | 0 (0.0%) | 0 (0.0%) |
| 5 or more Children | 0 (0.0%) | 0 (0.0%) |
| Total | 364 (100.0%) | 0 (0.0%) |
Income Below Poverty Among Single-Parent Households in Bayview CDP Contra Costa County
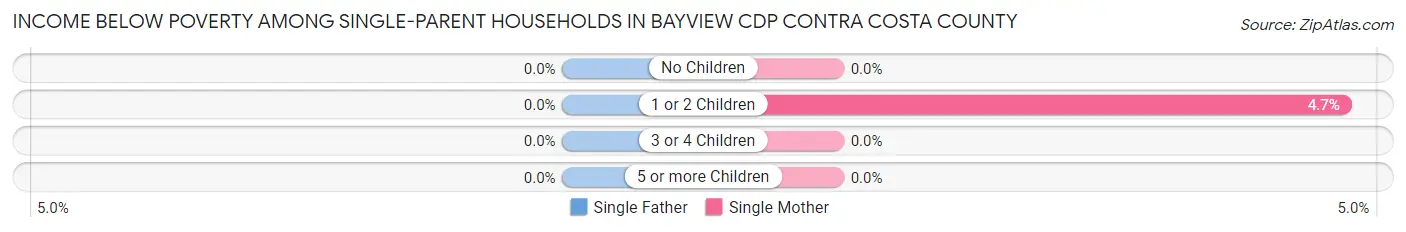
| Children | Single Father | Single Mother |
| No Children | 0 (0.0%) | 0 (0.0%) |
| 1 or 2 Children | 0 (0.0%) | 8 (4.7%) |
| 3 or 4 Children | 0 (0.0%) | 0 (0.0%) |
| 5 or more Children | 0 (0.0%) | 0 (0.0%) |
| Total | 0 (0.0%) | 8 (3.3%) |
Income Below Poverty Among Married-Couple vs Single-Parent Households in Bayview CDP Contra Costa County
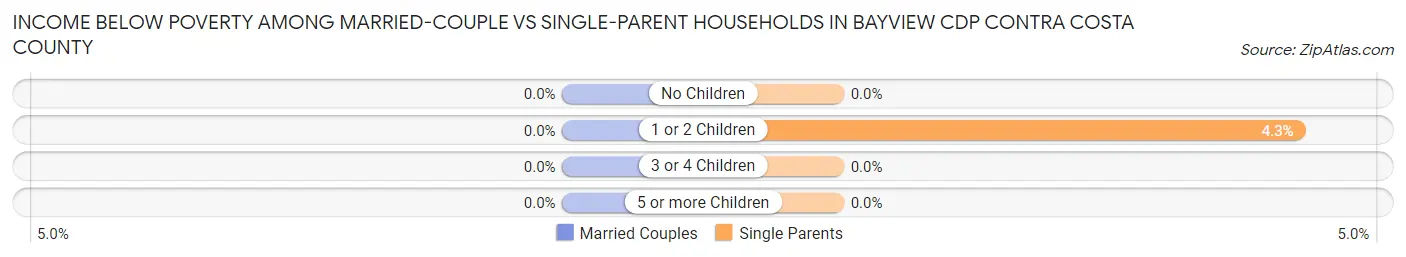
| Children | Married-Couple Families | Single-Parent Households |
| No Children | 0 (0.0%) | 0 (0.0%) |
| 1 or 2 Children | 0 (0.0%) | 8 (4.3%) |
| 3 or 4 Children | 0 (0.0%) | 0 (0.0%) |
| 5 or more Children | 0 (0.0%) | 0 (0.0%) |
| Total | 0 (0.0%) | 8 (2.9%) |
Race in Bayview CDP Contra Costa County
The most populous races in Bayview CDP Contra Costa County are Hispanic or Latino (1,281 | 50.6%), White / Caucasian (1,205 | 47.6%), and Two or more Races (861 | 34.1%).
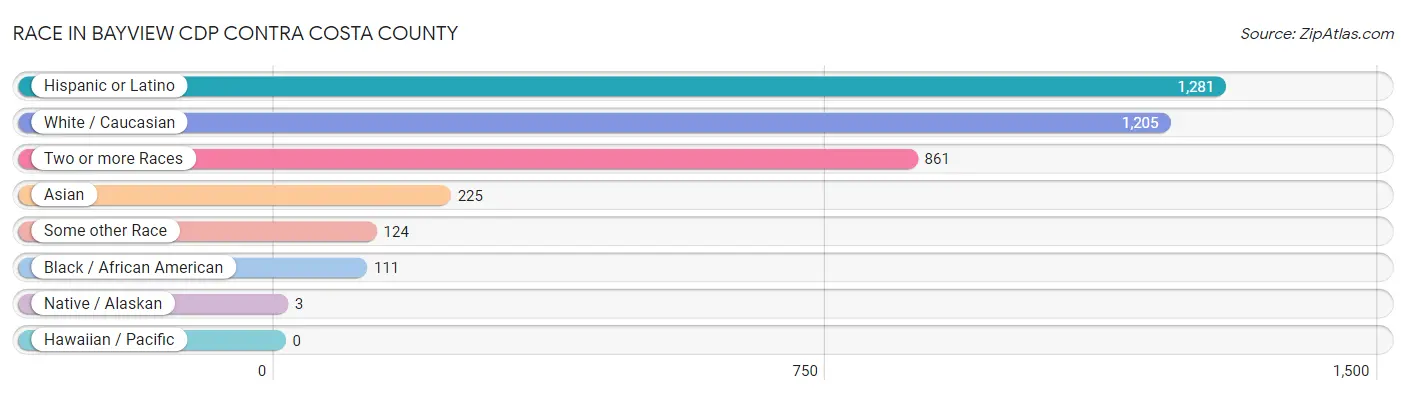
| Race | # Population | % Population |
| Asian | 225 | 8.9% |
| Black / African American | 111 | 4.4% |
| Hawaiian / Pacific | 0 | 0.0% |
| Hispanic or Latino | 1,281 | 50.6% |
| Native / Alaskan | 3 | 0.1% |
| White / Caucasian | 1,205 | 47.6% |
| Two or more Races | 861 | 34.1% |
| Some other Race | 124 | 4.9% |
| Total | 2,529 | 100.0% |
Ancestry in Bayview CDP Contra Costa County
The most populous ancestries reported in Bayview CDP Contra Costa County are Mexican (1,028 | 40.6%), Italian (241 | 9.5%), Portuguese (170 | 6.7%), Central American (158 | 6.2%), and Salvadoran (123 | 4.9%), together accounting for 68.0% of all Bayview CDP Contra Costa County residents.
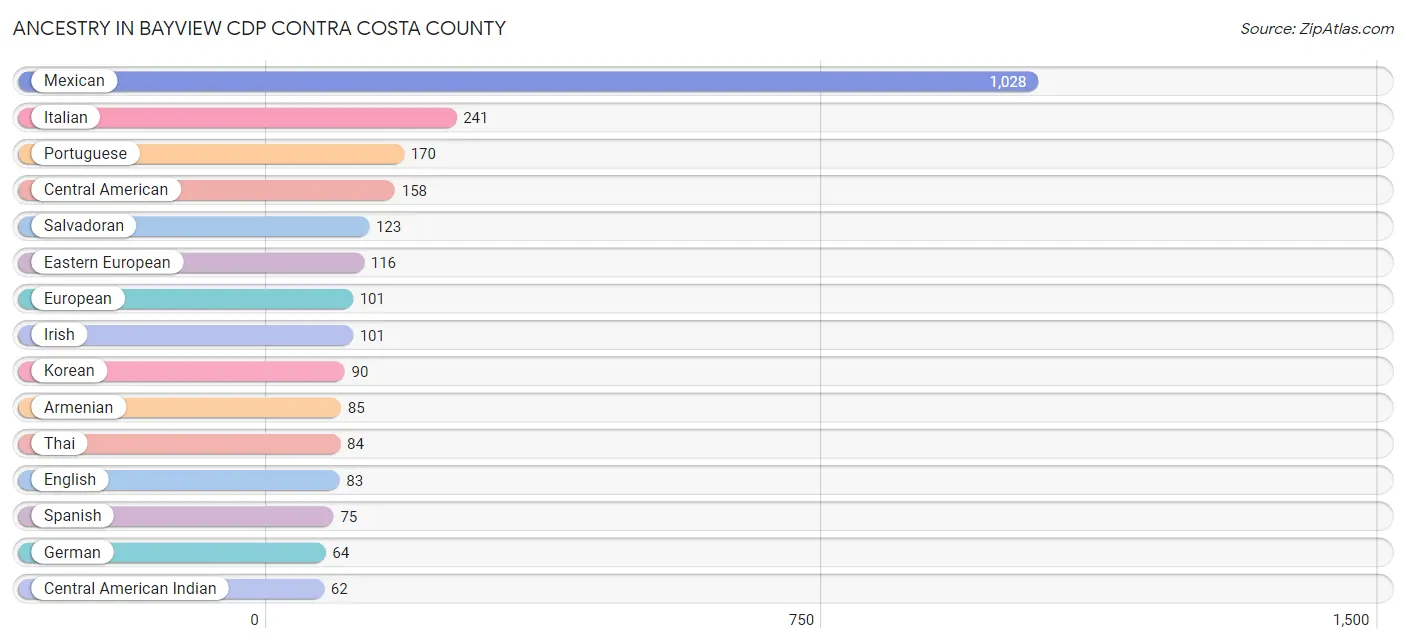
| Ancestry | # Population | % Population |
| American | 27 | 1.1% |
| Arab | 36 | 1.4% |
| Armenian | 85 | 3.4% |
| Bhutanese | 51 | 2.0% |
| Central American | 158 | 6.2% |
| Central American Indian | 62 | 2.5% |
| Cuban | 12 | 0.5% |
| Danish | 30 | 1.2% |
| Eastern European | 116 | 4.6% |
| Ecuadorian | 5 | 0.2% |
| English | 83 | 3.3% |
| European | 101 | 4.0% |
| German | 64 | 2.5% |
| Guatemalan | 35 | 1.4% |
| Indian (Asian) | 5 | 0.2% |
| Irish | 101 | 4.0% |
| Italian | 241 | 9.5% |
| Korean | 90 | 3.6% |
| Lebanese | 36 | 1.4% |
| Mexican | 1,028 | 40.6% |
| Navajo | 18 | 0.7% |
| Polish | 12 | 0.5% |
| Portuguese | 170 | 6.7% |
| Russian | 61 | 2.4% |
| Salvadoran | 123 | 4.9% |
| Scandinavian | 44 | 1.7% |
| Scottish | 17 | 0.7% |
| South American | 5 | 0.2% |
| Spanish | 75 | 3.0% |
| Thai | 84 | 3.3% |
| Ukrainian | 12 | 0.5% | View All 31 Rows |
Immigrants in Bayview CDP Contra Costa County
The most numerous immigrant groups reported in Bayview CDP Contra Costa County came from Central America (681 | 26.9%), Latin America (681 | 26.9%), Mexico (641 | 25.4%), Asia (271 | 10.7%), and Western Asia (121 | 4.8%), together accounting for 94.7% of all Bayview CDP Contra Costa County residents.
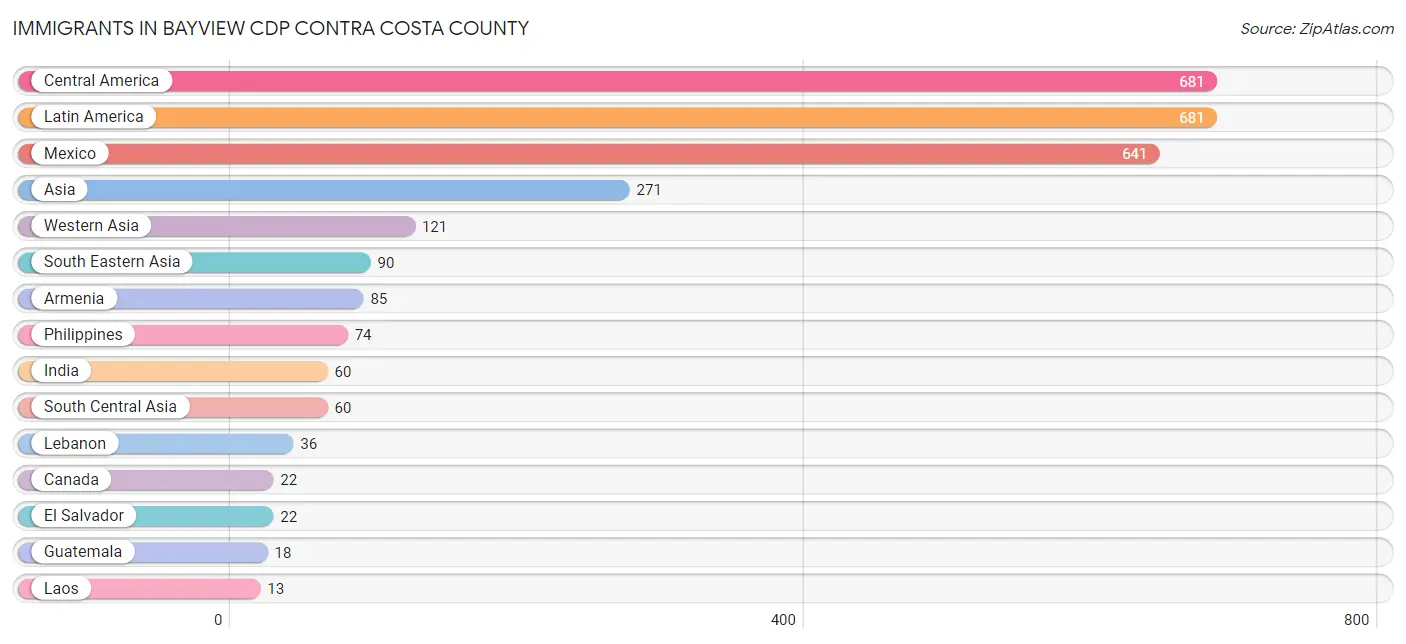
| Immigration Origin | # Population | % Population |
| Armenia | 85 | 3.4% |
| Asia | 271 | 10.7% |
| Canada | 22 | 0.9% |
| Central America | 681 | 26.9% |
| El Salvador | 22 | 0.9% |
| Guatemala | 18 | 0.7% |
| India | 60 | 2.4% |
| Laos | 13 | 0.5% |
| Latin America | 681 | 26.9% |
| Lebanon | 36 | 1.4% |
| Mexico | 641 | 25.4% |
| Philippines | 74 | 2.9% |
| South Central Asia | 60 | 2.4% |
| South Eastern Asia | 90 | 3.6% |
| Vietnam | 3 | 0.1% |
| Western Asia | 121 | 4.8% | View All 16 Rows |
Sex and Age in Bayview CDP Contra Costa County
Sex and Age in Bayview CDP Contra Costa County
The most populous age groups in Bayview CDP Contra Costa County are 20 to 24 Years (208 | 15.4%) for men and 25 to 29 Years (176 | 14.9%) for women.
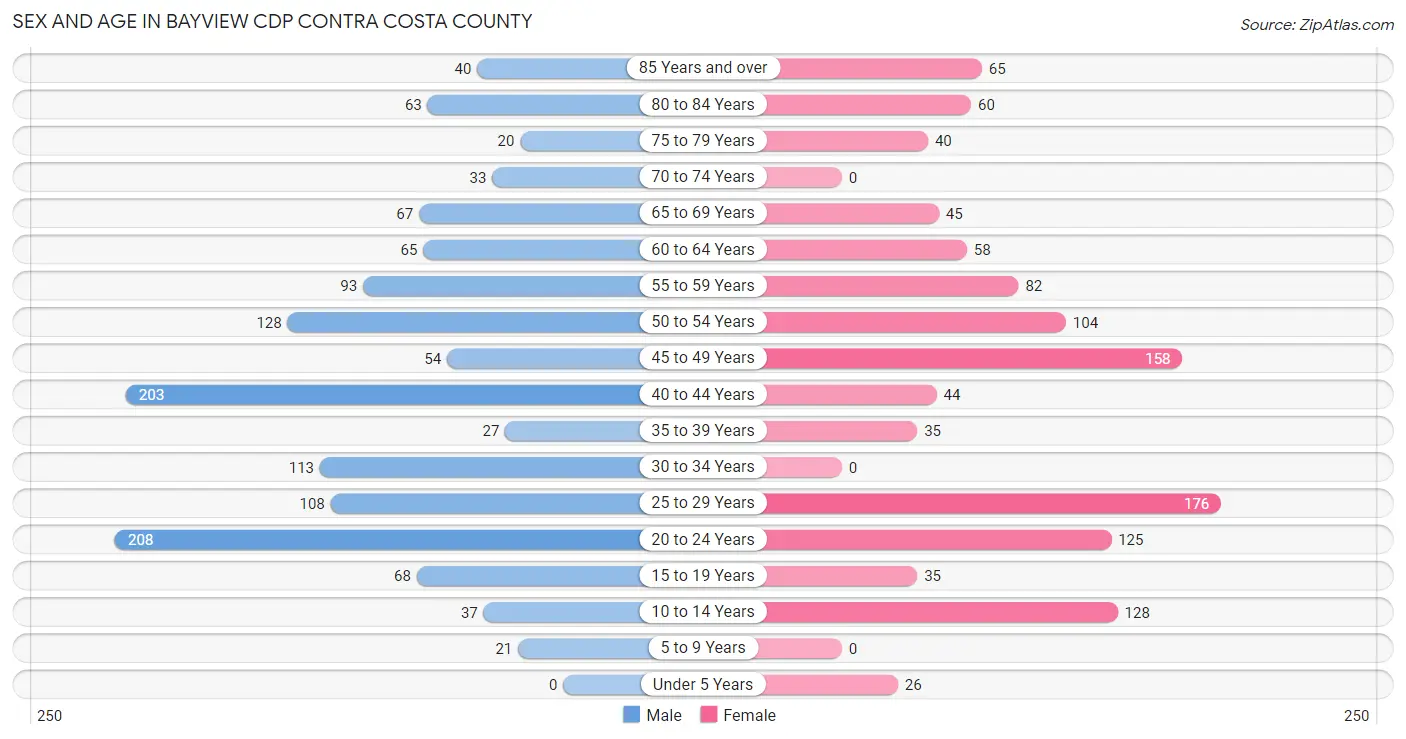
| Age Bracket | Male | Female |
| Under 5 Years | 0 (0.0%) | 26 (2.2%) |
| 5 to 9 Years | 21 (1.6%) | 0 (0.0%) |
| 10 to 14 Years | 37 (2.7%) | 128 (10.8%) |
| 15 to 19 Years | 68 (5.0%) | 35 (3.0%) |
| 20 to 24 Years | 208 (15.4%) | 125 (10.6%) |
| 25 to 29 Years | 108 (8.0%) | 176 (14.9%) |
| 30 to 34 Years | 113 (8.4%) | 0 (0.0%) |
| 35 to 39 Years | 27 (2.0%) | 35 (3.0%) |
| 40 to 44 Years | 203 (15.1%) | 44 (3.7%) |
| 45 to 49 Years | 54 (4.0%) | 158 (13.4%) |
| 50 to 54 Years | 128 (9.5%) | 104 (8.8%) |
| 55 to 59 Years | 93 (6.9%) | 82 (6.9%) |
| 60 to 64 Years | 65 (4.8%) | 58 (4.9%) |
| 65 to 69 Years | 67 (5.0%) | 45 (3.8%) |
| 70 to 74 Years | 33 (2.5%) | 0 (0.0%) |
| 75 to 79 Years | 20 (1.5%) | 40 (3.4%) |
| 80 to 84 Years | 63 (4.7%) | 60 (5.1%) |
| 85 Years and over | 40 (3.0%) | 65 (5.5%) |
| Total | 1,348 (100.0%) | 1,181 (100.0%) |
Families and Households in Bayview CDP Contra Costa County
Median Family Size in Bayview CDP Contra Costa County
The median family size in Bayview CDP Contra Costa County is 3.59 persons per family, with single female/mother families (241 | 37.4%) accounting for the largest median family size of 4.08 persons per family. On the other hand, single male/father families (40 | 6.2%) represent the smallest median family size with 2.65 persons per family.
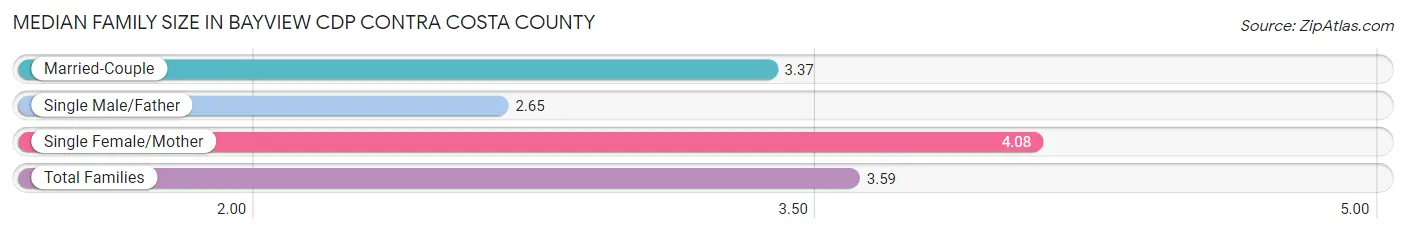
| Family Type | # Families | Family Size |
| Married-Couple | 364 (56.4%) | 3.37 |
| Single Male/Father | 40 (6.2%) | 2.65 |
| Single Female/Mother | 241 (37.4%) | 4.08 |
| Total Families | 645 (100.0%) | 3.59 |
Median Household Size in Bayview CDP Contra Costa County
The median household size in Bayview CDP Contra Costa County is 3.12 persons per household, with single female/mother households (241 | 29.9%) accounting for the largest median household size of 4.12 persons per household. non-family households (162 | 20.1%) represent the smallest median household size with 1.10 persons per household.
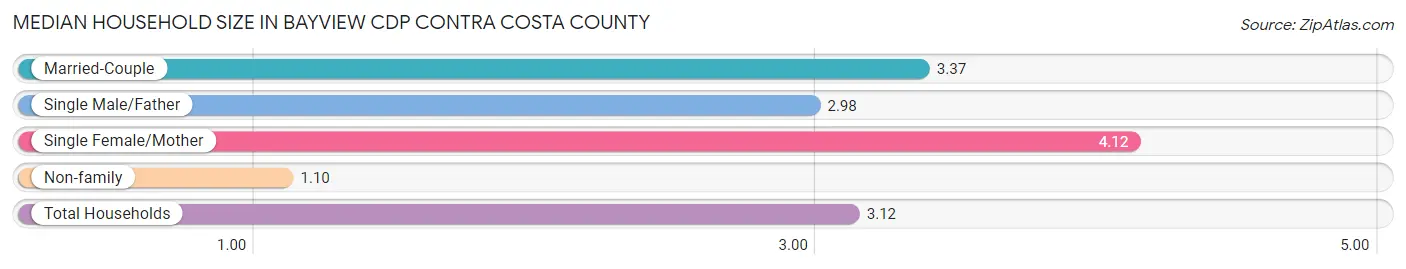
| Household Type | # Households | Household Size |
| Married-Couple | 364 (45.1%) | 3.37 |
| Single Male/Father | 40 (5.0%) | 2.98 |
| Single Female/Mother | 241 (29.9%) | 4.12 |
| Non-family | 162 (20.1%) | 1.10 |
| Total Households | 807 (100.0%) | 3.12 |
Household Size by Marriage Status in Bayview CDP Contra Costa County
Out of a total of 807 households in Bayview CDP Contra Costa County, 645 (79.9%) are family households, while 162 (20.1%) are nonfamily households. The most numerous type of family households are 5-person households, comprising 216, and the most common type of nonfamily households are 1-person households, comprising 142.
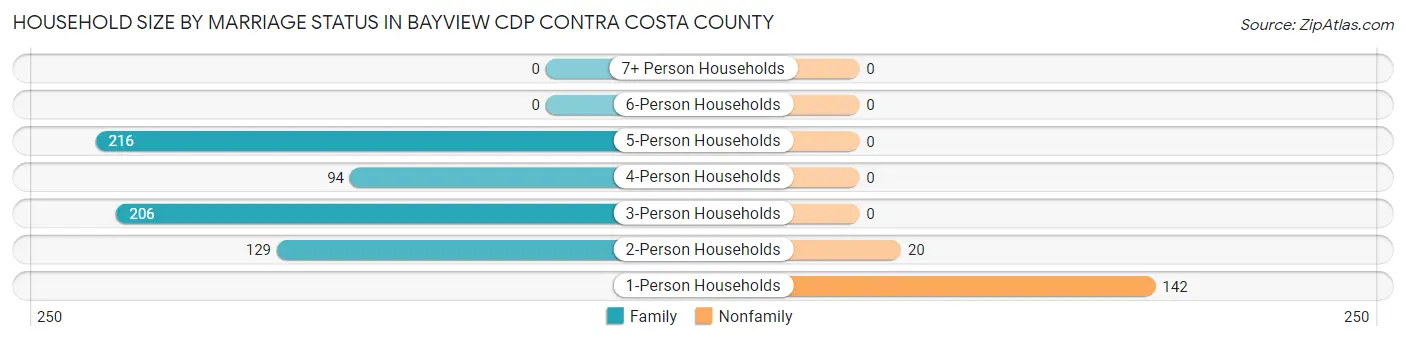
| Household Size | Family Households | Nonfamily Households |
| 1-Person Households | - | 142 (17.6%) |
| 2-Person Households | 129 (16.0%) | 20 (2.5%) |
| 3-Person Households | 206 (25.5%) | 0 (0.0%) |
| 4-Person Households | 94 (11.7%) | 0 (0.0%) |
| 5-Person Households | 216 (26.8%) | 0 (0.0%) |
| 6-Person Households | 0 (0.0%) | 0 (0.0%) |
| 7+ Person Households | 0 (0.0%) | 0 (0.0%) |
| Total | 645 (79.9%) | 162 (20.1%) |
Female Fertility in Bayview CDP Contra Costa County
Fertility by Age in Bayview CDP Contra Costa County
Average fertility rate in Bayview CDP Contra Costa County is 16.0 births per 1,000 women. Women in the age bracket of 35 to 50 years have the highest fertility rate with 36.0 births per 1,000 women. Women in the age bracket of 35 to 50 years acount for 100.0% of all women with births.
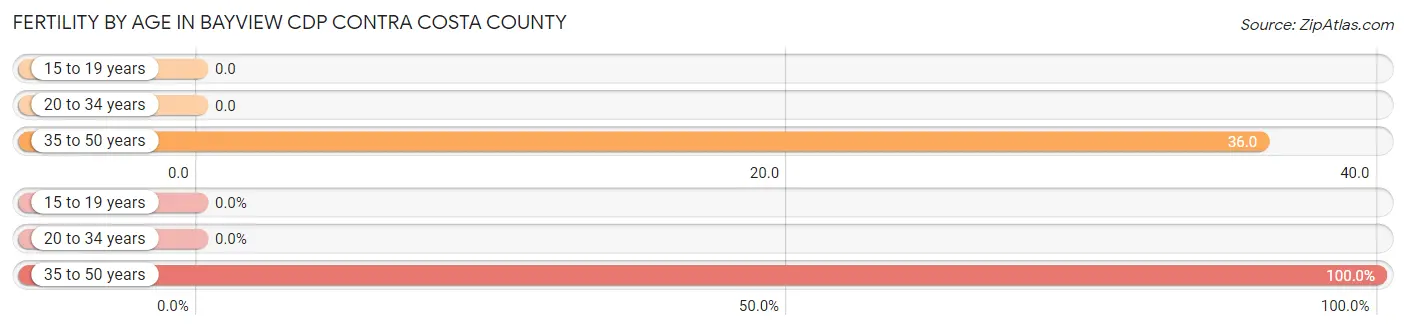
| Age Bracket | Women with Births | Births / 1,000 Women |
| 15 to 19 years | 0 (0.0%) | 0.0 |
| 20 to 34 years | 0 (0.0%) | 0.0 |
| 35 to 50 years | 10 (100.0%) | 36.0 |
| Total | 10 (100.0%) | 16.0 |
Fertility by Age by Marriage Status in Bayview CDP Contra Costa County
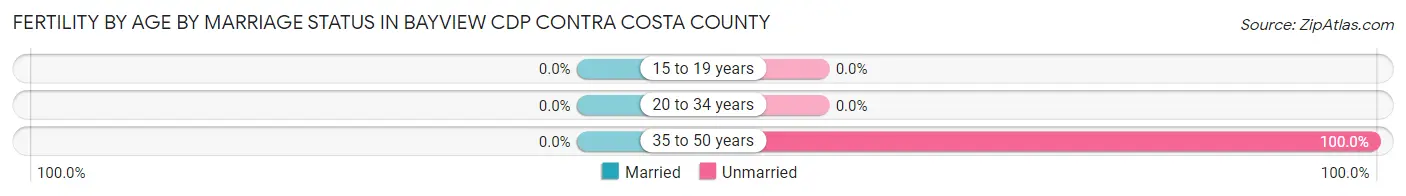
| Age Bracket | Married | Unmarried |
| 15 to 19 years | 0 (0.0%) | 0 (0.0%) |
| 20 to 34 years | 0 (0.0%) | 0 (0.0%) |
| 35 to 50 years | 0 (0.0%) | 10 (100.0%) |
| Total | 0 (0.0%) | 10 (100.0%) |
Fertility by Education in Bayview CDP Contra Costa County
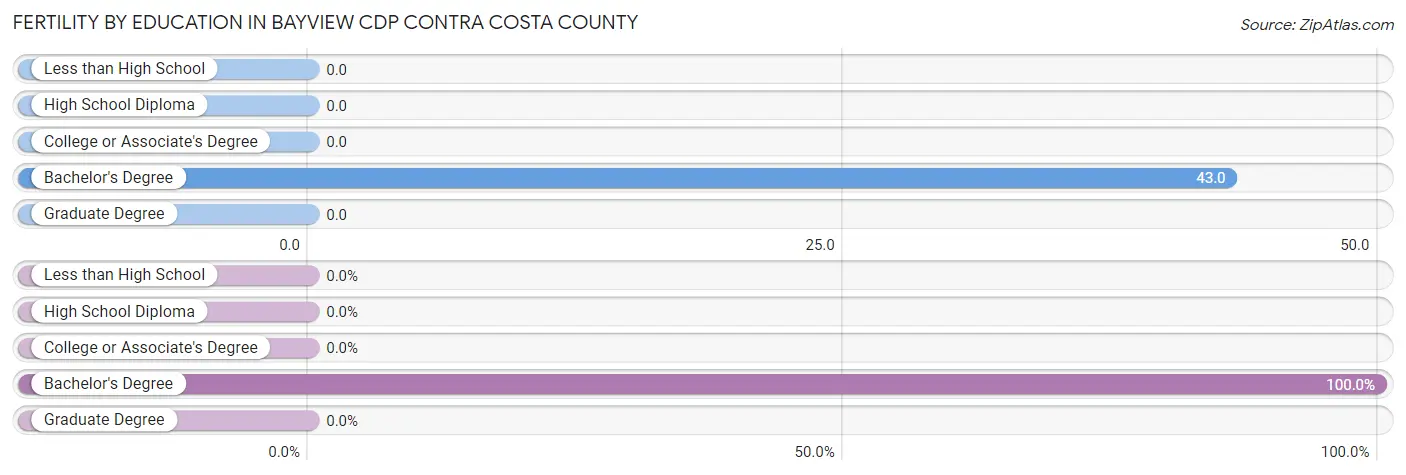
| Educational Attainment | Women with Births | Births / 1,000 Women |
| Less than High School | 0 (0.0%) | 0.0 |
| High School Diploma | 0 (0.0%) | 0.0 |
| College or Associate's Degree | 0 (0.0%) | 0.0 |
| Bachelor's Degree | 10 (100.0%) | 43.0 |
| Graduate Degree | 0 (0.0%) | 0.0 |
| Total | 10 (100.0%) | 16.0 |
Fertility by Education by Marriage Status in Bayview CDP Contra Costa County
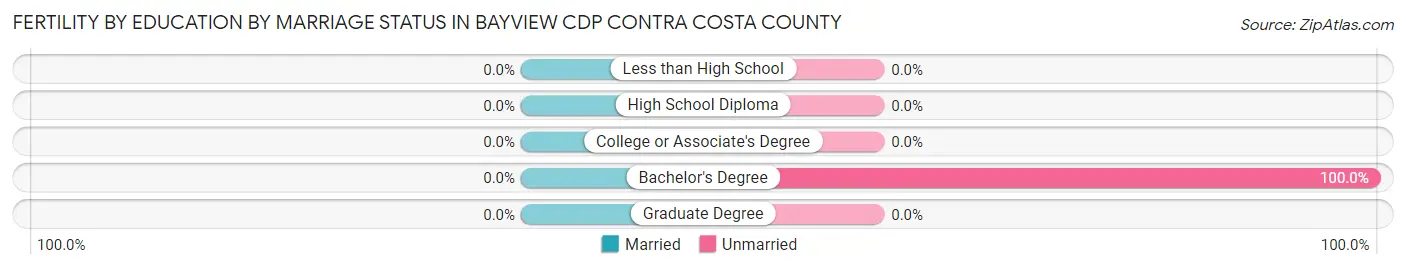
| Educational Attainment | Married | Unmarried |
| Less than High School | 0 (0.0%) | 0 (0.0%) |
| High School Diploma | 0 (0.0%) | 0 (0.0%) |
| College or Associate's Degree | 0 (0.0%) | 0 (0.0%) |
| Bachelor's Degree | 0 (0.0%) | 10 (100.0%) |
| Graduate Degree | 0 (0.0%) | 0 (0.0%) |
| Total | 0 (0.0%) | 10 (100.0%) |
Employment Characteristics in Bayview CDP Contra Costa County
Employment by Class of Employer in Bayview CDP Contra Costa County
Among the 1,394 employed individuals in Bayview CDP Contra Costa County, private company employees (1,037 | 74.4%), local government employees (177 | 12.7%), and self-employed (not incorporated) (56 | 4.0%) make up the most common classes of employment.
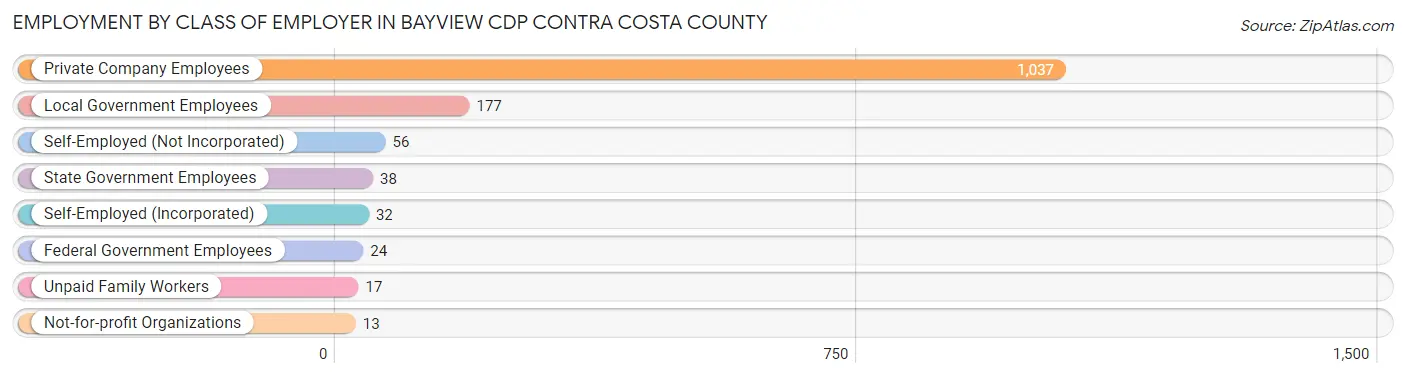
| Employer Class | # Employees | % Employees |
| Private Company Employees | 1,037 | 74.4% |
| Self-Employed (Incorporated) | 32 | 2.3% |
| Self-Employed (Not Incorporated) | 56 | 4.0% |
| Not-for-profit Organizations | 13 | 0.9% |
| Local Government Employees | 177 | 12.7% |
| State Government Employees | 38 | 2.7% |
| Federal Government Employees | 24 | 1.7% |
| Unpaid Family Workers | 17 | 1.2% |
| Total | 1,394 | 100.0% |
Employment Status by Age in Bayview CDP Contra Costa County
According to the labor force statistics for Bayview CDP Contra Costa County, out of the total population over 16 years of age (2,305), 67.0% or 1,544 individuals are in the labor force, with 9.7% or 150 of them unemployed. The age group with the highest labor force participation rate is 20 to 24 years, with 100.0% or 333 individuals in the labor force. Within the labor force, the 20 to 24 years age range has the highest percentage of unemployed individuals, with 26.1% or 87 of them being unemployed.
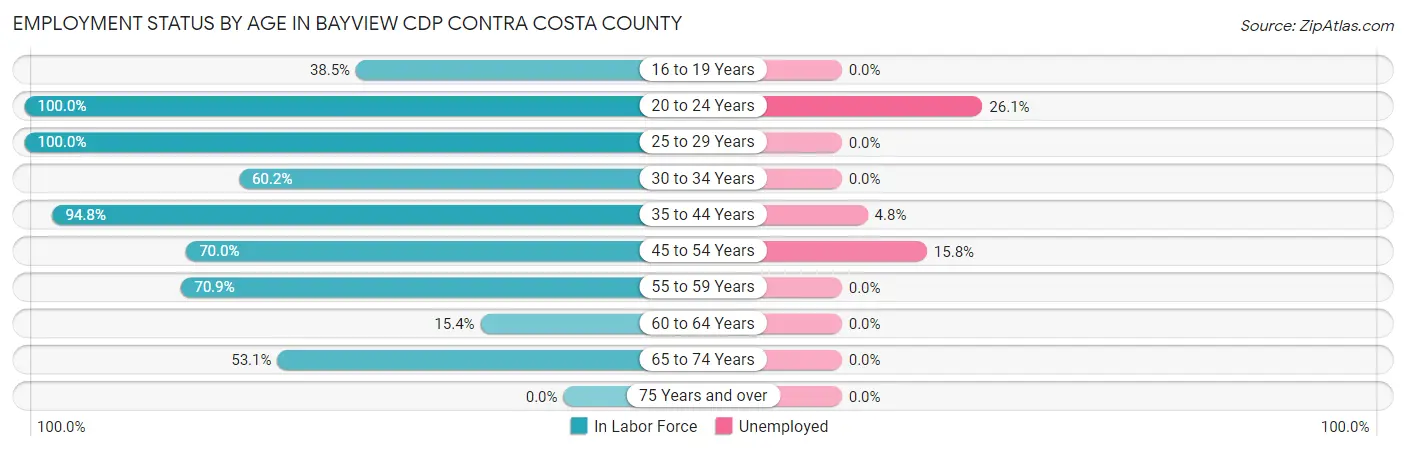
| Age Bracket | In Labor Force | Unemployed |
| 16 to 19 Years | 35 (38.5%) | 0 (0.0%) |
| 20 to 24 Years | 333 (100.0%) | 87 (26.1%) |
| 25 to 29 Years | 284 (100.0%) | 0 (0.0%) |
| 30 to 34 Years | 68 (60.2%) | 0 (0.0%) |
| 35 to 44 Years | 293 (94.8%) | 14 (4.8%) |
| 45 to 54 Years | 311 (70.0%) | 49 (15.8%) |
| 55 to 59 Years | 124 (70.9%) | 0 (0.0%) |
| 60 to 64 Years | 19 (15.4%) | 0 (0.0%) |
| 65 to 74 Years | 77 (53.1%) | 0 (0.0%) |
| 75 Years and over | 0 (0.0%) | 0 (0.0%) |
| Total | 1,544 (67.0%) | 150 (9.7%) |
Employment Status by Educational Attainment in Bayview CDP Contra Costa County
According to labor force statistics for Bayview CDP Contra Costa County, 75.9% of individuals (1,099) out of the total population between 25 and 64 years of age (1,448) are in the labor force, with 5.7% or 63 of them being unemployed. The group with the highest labor force participation rate are those with the educational attainment of bachelor's degree or higher, with 98.1% or 403 individuals in the labor force. Within the labor force, individuals with less than high school education have the highest percentage of unemployment, with 59.3% or 51 of them being unemployed.
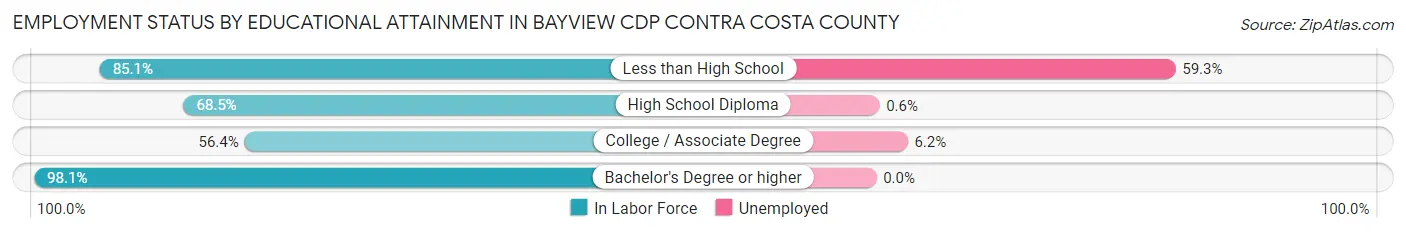
| Educational Attainment | In Labor Force | Unemployed |
| Less than High School | 86 (85.1%) | 60 (59.3%) |
| High School Diploma | 464 (68.5%) | 4 (0.6%) |
| College / Associate Degree | 146 (56.4%) | 16 (6.2%) |
| Bachelor's Degree or higher | 403 (98.1%) | 0 (0.0%) |
| Total | 1,099 (75.9%) | 83 (5.7%) |
Employment Occupations by Sex in Bayview CDP Contra Costa County
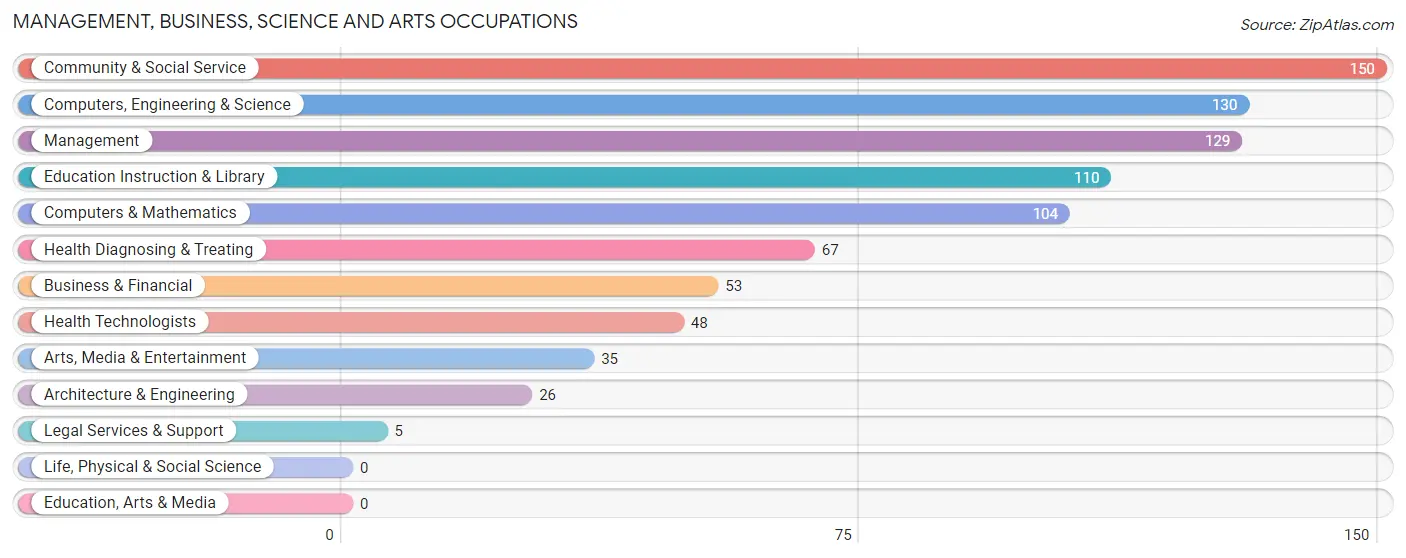
Management, Business, Science and Arts Occupations
The most common Management, Business, Science and Arts occupations in Bayview CDP Contra Costa County are Community & Social Service (150 | 10.8%), Computers, Engineering & Science (130 | 9.3%), Management (129 | 9.2%), Education Instruction & Library (110 | 7.9%), and Computers & Mathematics (104 | 7.5%).
Management, Business, Science and Arts Occupations by Sex
Within the Management, Business, Science and Arts occupations in Bayview CDP Contra Costa County, the most male-oriented occupations are Computers, Engineering & Science (100.0%), Computers & Mathematics (100.0%), and Architecture & Engineering (100.0%), while the most female-oriented occupations are Business & Financial (100.0%), Legal Services & Support (100.0%), and Health Technologists (100.0%).
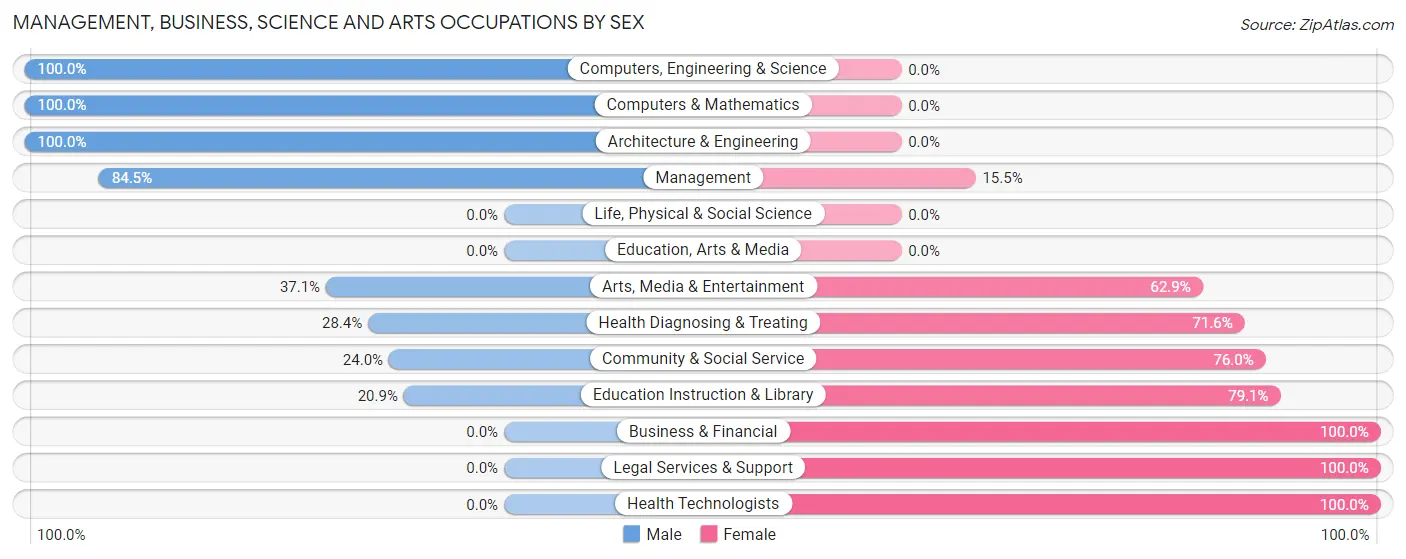
| Occupation | Male | Female |
| Management | 109 (84.5%) | 20 (15.5%) |
| Business & Financial | 0 (0.0%) | 53 (100.0%) |
| Computers, Engineering & Science | 130 (100.0%) | 0 (0.0%) |
| Computers & Mathematics | 104 (100.0%) | 0 (0.0%) |
| Architecture & Engineering | 26 (100.0%) | 0 (0.0%) |
| Life, Physical & Social Science | 0 (0.0%) | 0 (0.0%) |
| Community & Social Service | 36 (24.0%) | 114 (76.0%) |
| Education, Arts & Media | 0 (0.0%) | 0 (0.0%) |
| Legal Services & Support | 0 (0.0%) | 5 (100.0%) |
| Education Instruction & Library | 23 (20.9%) | 87 (79.1%) |
| Arts, Media & Entertainment | 13 (37.1%) | 22 (62.9%) |
| Health Diagnosing & Treating | 19 (28.4%) | 48 (71.6%) |
| Health Technologists | 0 (0.0%) | 48 (100.0%) |
| Total (Category) | 294 (55.6%) | 235 (44.4%) |
| Total (Overall) | 869 (62.3%) | 525 (37.7%) |
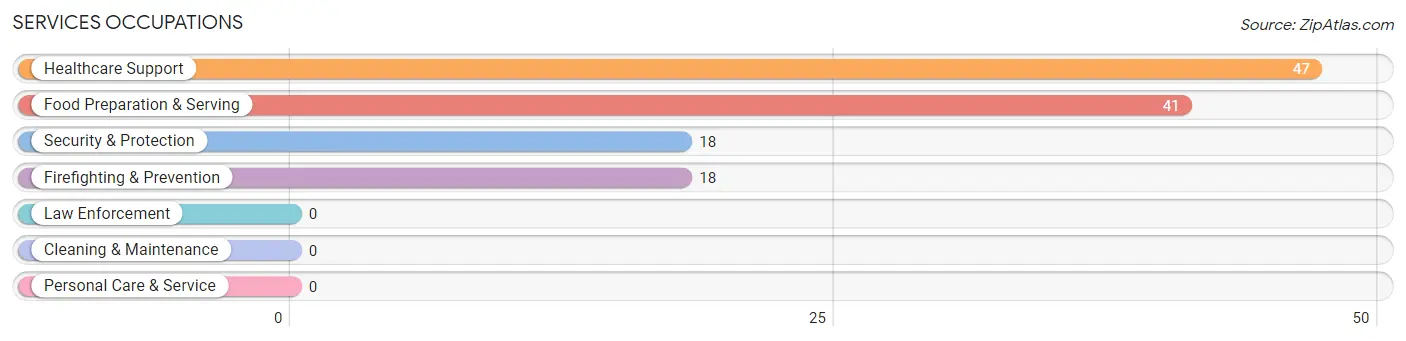
Services Occupations
The most common Services occupations in Bayview CDP Contra Costa County are Healthcare Support (47 | 3.4%), Food Preparation & Serving (41 | 2.9%), Security & Protection (18 | 1.3%), and Firefighting & Prevention (18 | 1.3%).
Services Occupations by Sex
Within the Services occupations in Bayview CDP Contra Costa County, the most male-oriented occupations are Healthcare Support (68.1%), and Food Preparation & Serving (7.3%), while the most female-oriented occupations are Security & Protection (100.0%), Firefighting & Prevention (100.0%), and Food Preparation & Serving (92.7%).
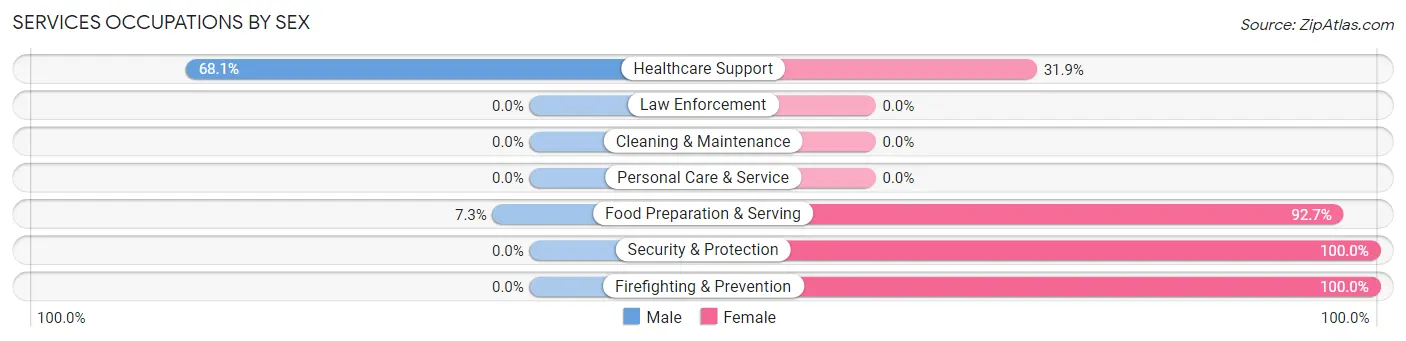
| Occupation | Male | Female |
| Healthcare Support | 32 (68.1%) | 15 (31.9%) |
| Security & Protection | 0 (0.0%) | 18 (100.0%) |
| Firefighting & Prevention | 0 (0.0%) | 18 (100.0%) |
| Law Enforcement | 0 (0.0%) | 0 (0.0%) |
| Food Preparation & Serving | 3 (7.3%) | 38 (92.7%) |
| Cleaning & Maintenance | 0 (0.0%) | 0 (0.0%) |
| Personal Care & Service | 0 (0.0%) | 0 (0.0%) |
| Total (Category) | 35 (33.0%) | 71 (67.0%) |
| Total (Overall) | 869 (62.3%) | 525 (37.7%) |
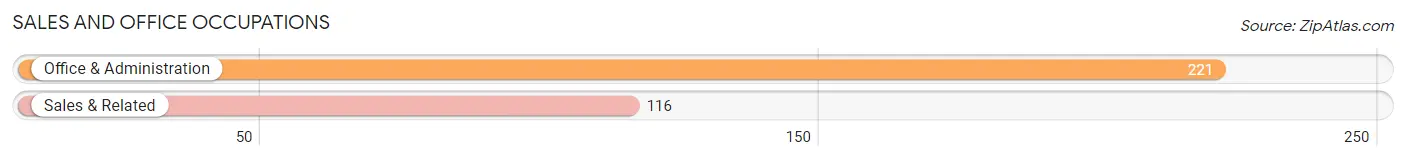
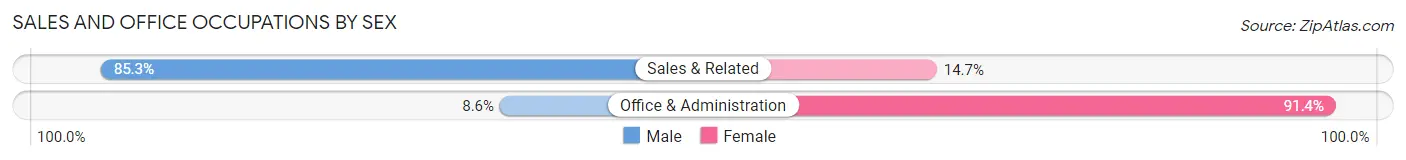
Sales and Office Occupations
The most common Sales and Office occupations in Bayview CDP Contra Costa County are Office & Administration (221 | 15.9%), and Sales & Related (116 | 8.3%).
Sales and Office Occupations by Sex
| Occupation | Male | Female |
| Sales & Related | 99 (85.3%) | 17 (14.7%) |
| Office & Administration | 19 (8.6%) | 202 (91.4%) |
| Total (Category) | 118 (35.0%) | 219 (65.0%) |
| Total (Overall) | 869 (62.3%) | 525 (37.7%) |
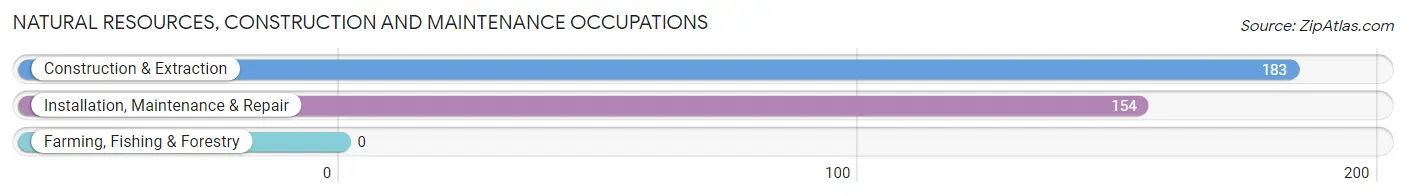
Natural Resources, Construction and Maintenance Occupations
The most common Natural Resources, Construction and Maintenance occupations in Bayview CDP Contra Costa County are Construction & Extraction (183 | 13.1%), and Installation, Maintenance & Repair (154 | 11.1%).
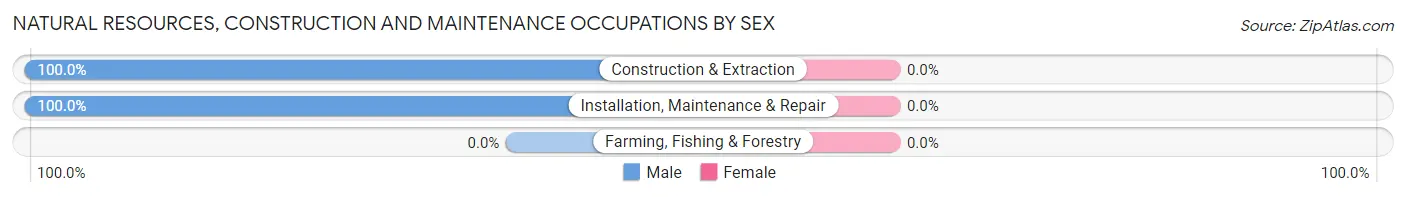
Natural Resources, Construction and Maintenance Occupations by Sex
| Occupation | Male | Female |
| Farming, Fishing & Forestry | 0 (0.0%) | 0 (0.0%) |
| Construction & Extraction | 183 (100.0%) | 0 (0.0%) |
| Installation, Maintenance & Repair | 154 (100.0%) | 0 (0.0%) |
| Total (Category) | 337 (100.0%) | 0 (0.0%) |
| Total (Overall) | 869 (62.3%) | 525 (37.7%) |
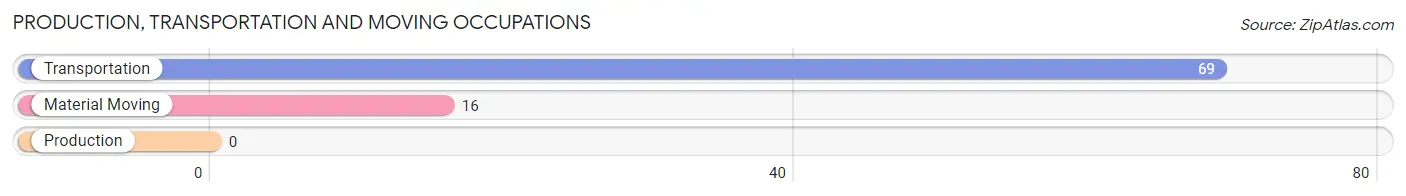
Production, Transportation and Moving Occupations
The most common Production, Transportation and Moving occupations in Bayview CDP Contra Costa County are Transportation (69 | 5.0%), and Material Moving (16 | 1.1%).
Production, Transportation and Moving Occupations by Sex
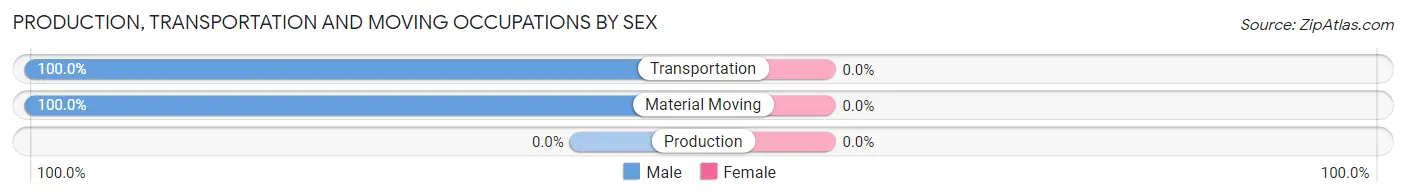
| Occupation | Male | Female |
| Production | 0 (0.0%) | 0 (0.0%) |
| Transportation | 69 (100.0%) | 0 (0.0%) |
| Material Moving | 16 (100.0%) | 0 (0.0%) |
| Total (Category) | 85 (100.0%) | 0 (0.0%) |
| Total (Overall) | 869 (62.3%) | 525 (37.7%) |
Employment Industries by Sex in Bayview CDP Contra Costa County
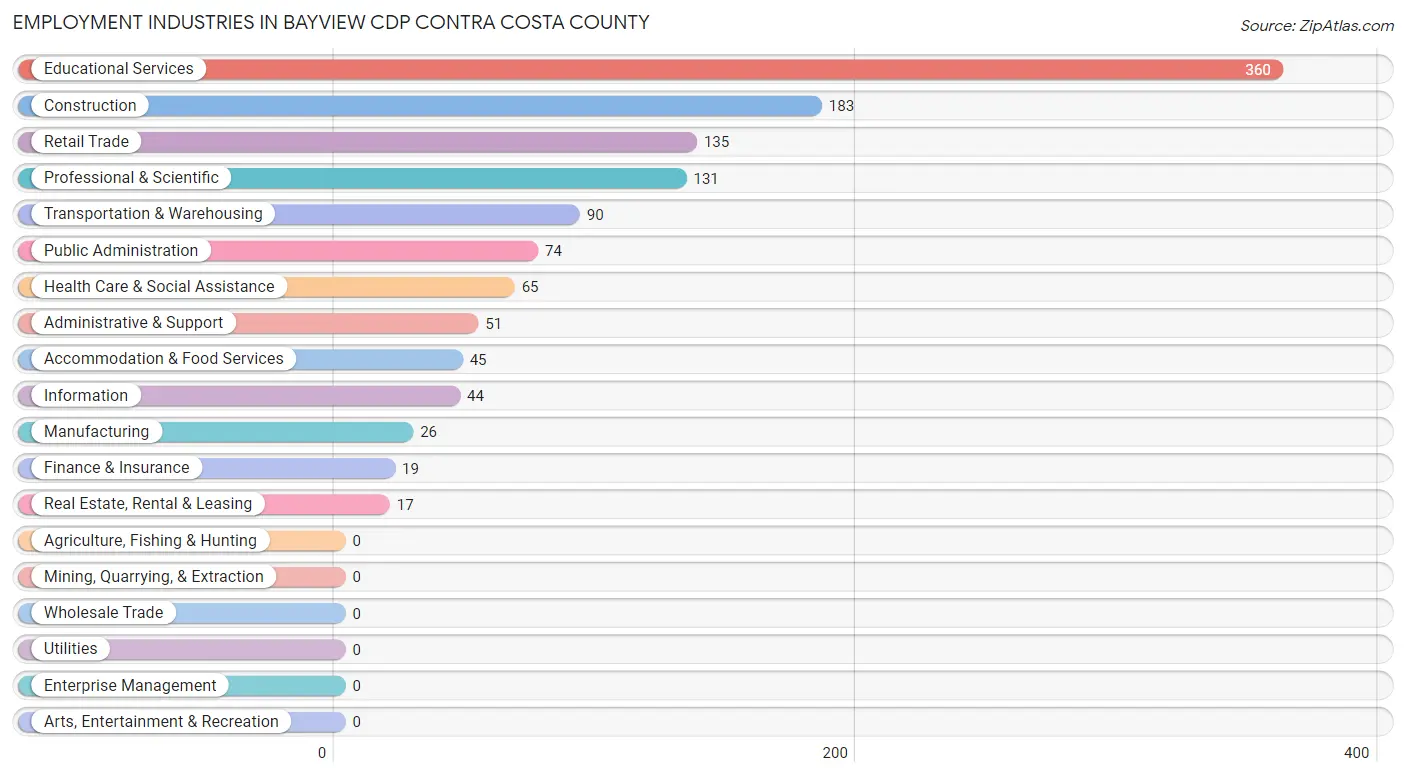
Employment Industries in Bayview CDP Contra Costa County
The major employment industries in Bayview CDP Contra Costa County include Educational Services (360 | 25.8%), Construction (183 | 13.1%), Retail Trade (135 | 9.7%), Professional & Scientific (131 | 9.4%), and Transportation & Warehousing (90 | 6.5%).
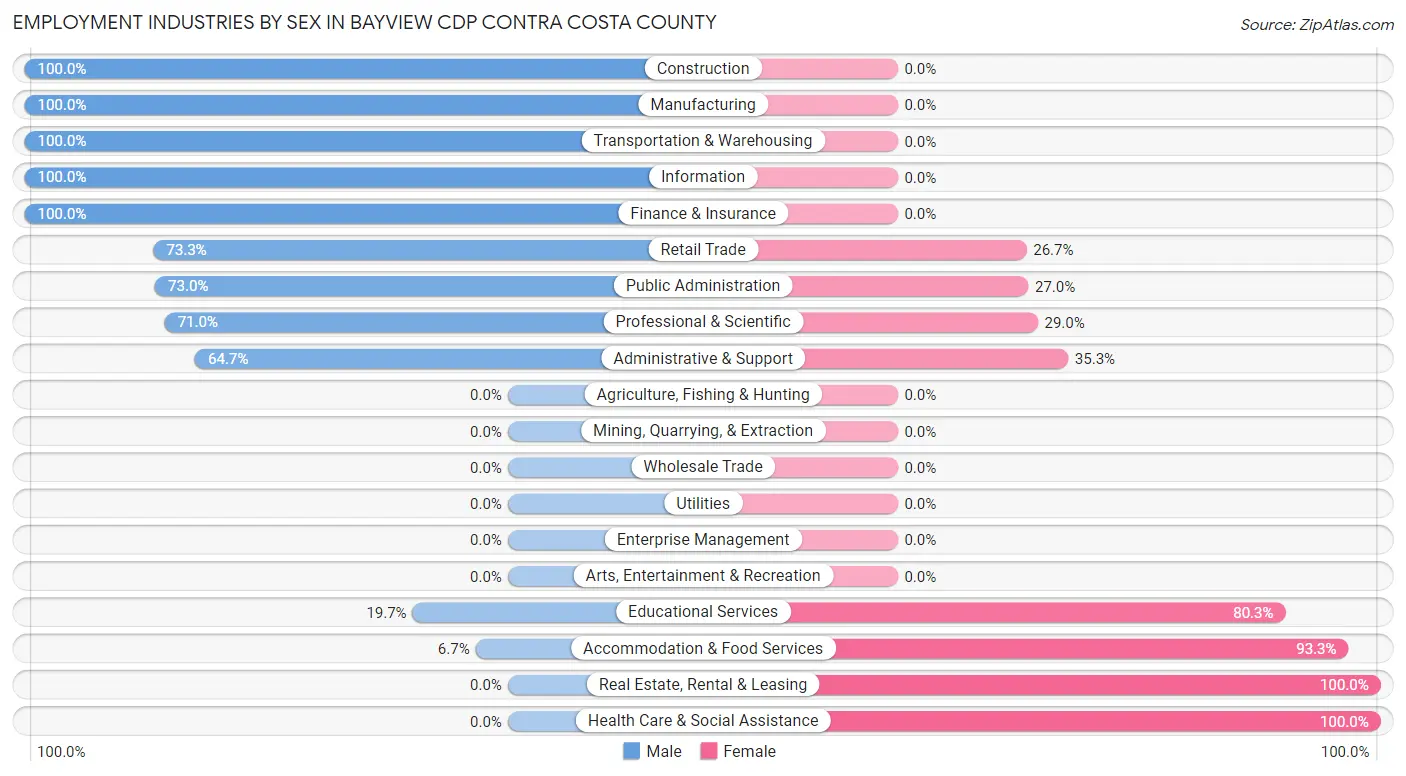
Employment Industries by Sex in Bayview CDP Contra Costa County
The Bayview CDP Contra Costa County industries that see more men than women are Construction (100.0%), Manufacturing (100.0%), and Transportation & Warehousing (100.0%), whereas the industries that tend to have a higher number of women are Real Estate, Rental & Leasing (100.0%), Health Care & Social Assistance (100.0%), and Accommodation & Food Services (93.3%).
| Industry | Male | Female |
| Agriculture, Fishing & Hunting | 0 (0.0%) | 0 (0.0%) |
| Mining, Quarrying, & Extraction | 0 (0.0%) | 0 (0.0%) |
| Construction | 183 (100.0%) | 0 (0.0%) |
| Manufacturing | 26 (100.0%) | 0 (0.0%) |
| Wholesale Trade | 0 (0.0%) | 0 (0.0%) |
| Retail Trade | 99 (73.3%) | 36 (26.7%) |
| Transportation & Warehousing | 90 (100.0%) | 0 (0.0%) |
| Utilities | 0 (0.0%) | 0 (0.0%) |
| Information | 44 (100.0%) | 0 (0.0%) |
| Finance & Insurance | 19 (100.0%) | 0 (0.0%) |
| Real Estate, Rental & Leasing | 0 (0.0%) | 17 (100.0%) |
| Professional & Scientific | 93 (71.0%) | 38 (29.0%) |
| Enterprise Management | 0 (0.0%) | 0 (0.0%) |
| Administrative & Support | 33 (64.7%) | 18 (35.3%) |
| Educational Services | 71 (19.7%) | 289 (80.3%) |
| Health Care & Social Assistance | 0 (0.0%) | 65 (100.0%) |
| Arts, Entertainment & Recreation | 0 (0.0%) | 0 (0.0%) |
| Accommodation & Food Services | 3 (6.7%) | 42 (93.3%) |
| Public Administration | 54 (73.0%) | 20 (27.0%) |
| Total | 869 (62.3%) | 525 (37.7%) |
Education in Bayview CDP Contra Costa County
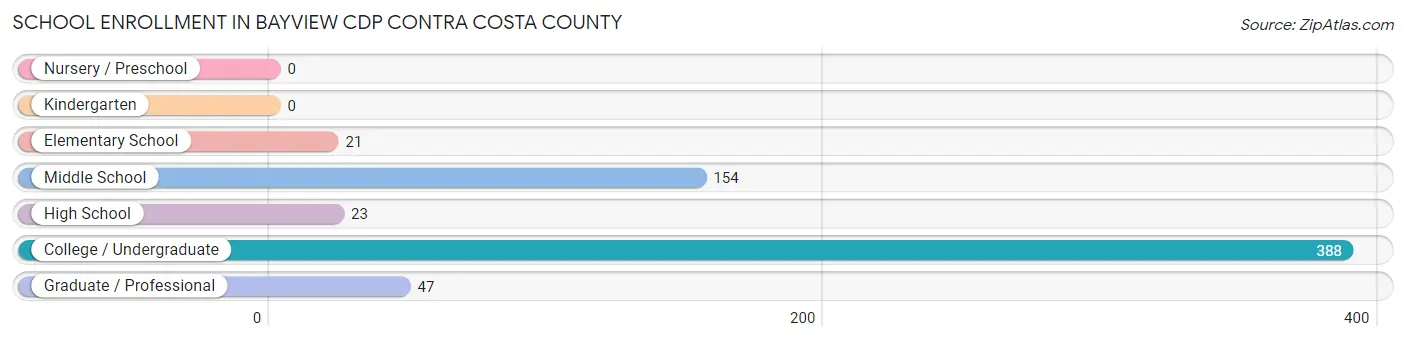
School Enrollment in Bayview CDP Contra Costa County
The most common levels of schooling among the 633 students in Bayview CDP Contra Costa County are college / undergraduate (388 | 61.3%), middle school (154 | 24.3%), and graduate / professional (47 | 7.4%).
| School Level | # Students | % Students |
| Nursery / Preschool | 0 | 0.0% |
| Kindergarten | 0 | 0.0% |
| Elementary School | 21 | 3.3% |
| Middle School | 154 | 24.3% |
| High School | 23 | 3.6% |
| College / Undergraduate | 388 | 61.3% |
| Graduate / Professional | 47 | 7.4% |
| Total | 633 | 100.0% |
School Enrollment by Age by Funding Source in Bayview CDP Contra Costa County
Out of a total of 633 students who are enrolled in schools in Bayview CDP Contra Costa County, 43 (6.8%) attend a private institution, while the remaining 590 (93.2%) are enrolled in public schools. The age group of 25 to 34 year olds has the highest likelihood of being enrolled in private schools, with 34 (56.7% in the age bracket) enrolled. Conversely, the age group of 5 to 9 year old has the lowest likelihood of being enrolled in a private school, with 21 (100.0% in the age bracket) attending a public institution.
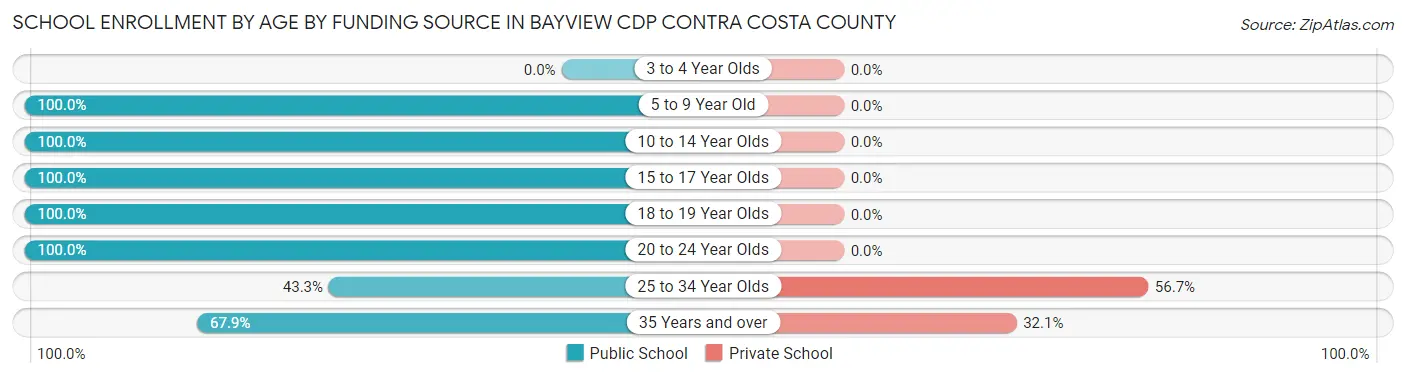
| Age Bracket | Public School | Private School |
| 3 to 4 Year Olds | 0 (0.0%) | 0 (0.0%) |
| 5 to 9 Year Old | 21 (100.0%) | 0 (0.0%) |
| 10 to 14 Year Olds | 165 (100.0%) | 0 (0.0%) |
| 15 to 17 Year Olds | 12 (100.0%) | 0 (0.0%) |
| 18 to 19 Year Olds | 76 (100.0%) | 0 (0.0%) |
| 20 to 24 Year Olds | 271 (100.0%) | 0 (0.0%) |
| 25 to 34 Year Olds | 26 (43.3%) | 34 (56.7%) |
| 35 Years and over | 19 (67.9%) | 9 (32.1%) |
| Total | 590 (93.2%) | 43 (6.8%) |
Educational Attainment by Field of Study in Bayview CDP Contra Costa County
Arts & humanities (129 | 27.0%), education (73 | 15.3%), psychology (50 | 10.5%), business (45 | 9.4%), and social sciences (39 | 8.2%) are the most common fields of study among 478 individuals in Bayview CDP Contra Costa County who have obtained a bachelor's degree or higher.
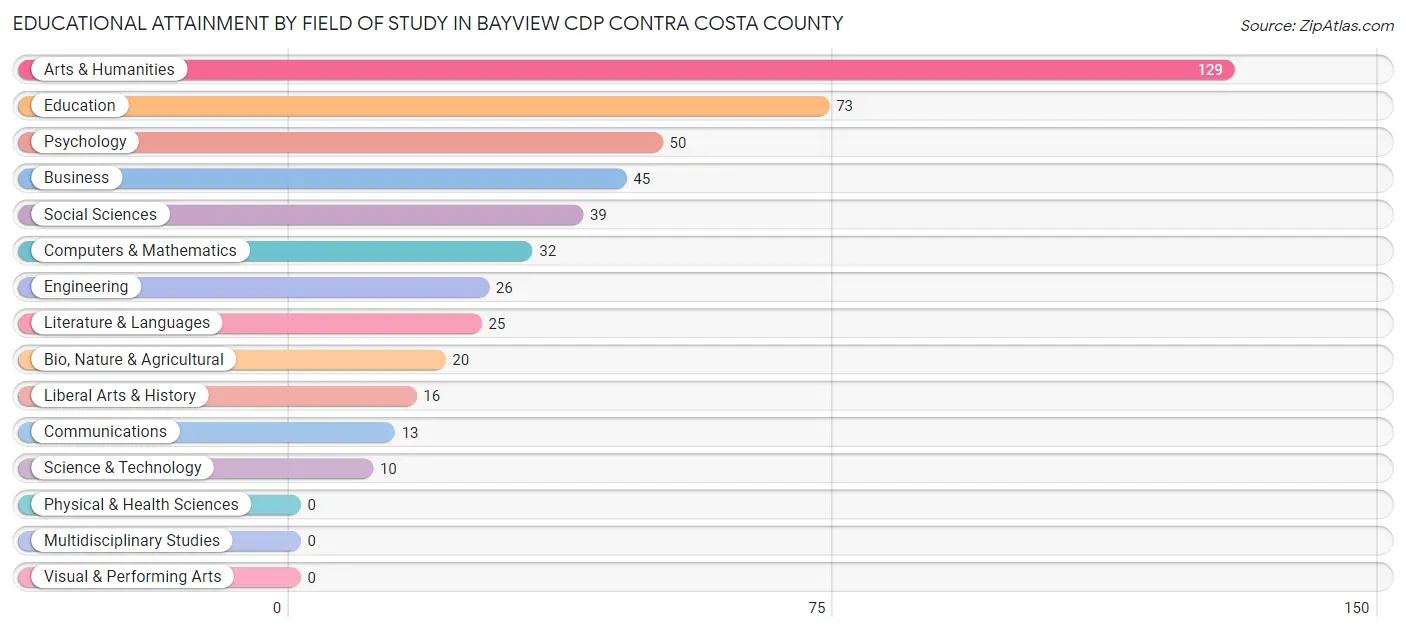
| Field of Study | # Graduates | % Graduates |
| Computers & Mathematics | 32 | 6.7% |
| Bio, Nature & Agricultural | 20 | 4.2% |
| Physical & Health Sciences | 0 | 0.0% |
| Psychology | 50 | 10.5% |
| Social Sciences | 39 | 8.2% |
| Engineering | 26 | 5.4% |
| Multidisciplinary Studies | 0 | 0.0% |
| Science & Technology | 10 | 2.1% |
| Business | 45 | 9.4% |
| Education | 73 | 15.3% |
| Literature & Languages | 25 | 5.2% |
| Liberal Arts & History | 16 | 3.4% |
| Visual & Performing Arts | 0 | 0.0% |
| Communications | 13 | 2.7% |
| Arts & Humanities | 129 | 27.0% |
| Total | 478 | 100.0% |
Transportation & Commute in Bayview CDP Contra Costa County
Vehicle Availability by Sex in Bayview CDP Contra Costa County
The most prevalent vehicle ownership categories in Bayview CDP Contra Costa County are males with 3 vehicles (497, accounting for 57.4%) and females with 3 vehicles (332, making up 94.7%).
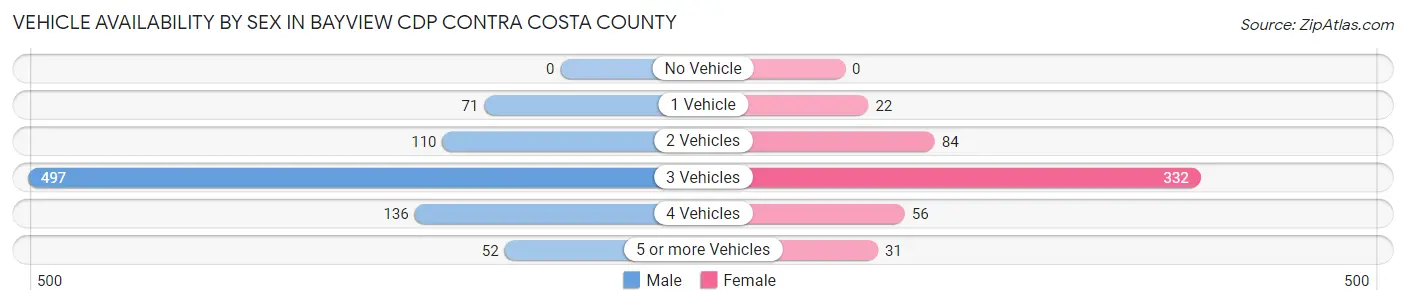
| Vehicles Available | Male | Female |
| No Vehicle | 0 (0.0%) | 0 (0.0%) |
| 1 Vehicle | 71 (8.2%) | 22 (4.2%) |
| 2 Vehicles | 110 (12.7%) | 84 (16.0%) |
| 3 Vehicles | 497 (57.4%) | 332 (63.2%) |
| 4 Vehicles | 136 (15.7%) | 56 (10.7%) |
| 5 or more Vehicles | 52 (6.0%) | 31 (5.9%) |
| Total | 866 (100.0%) | 525 (100.0%) |
Commute Time in Bayview CDP Contra Costa County
The most frequently occuring commute durations in Bayview CDP Contra Costa County are 30 to 34 minutes (285 commuters, 21.9%), 15 to 19 minutes (280 commuters, 21.5%), and 60 to 89 minutes (204 commuters, 15.7%).
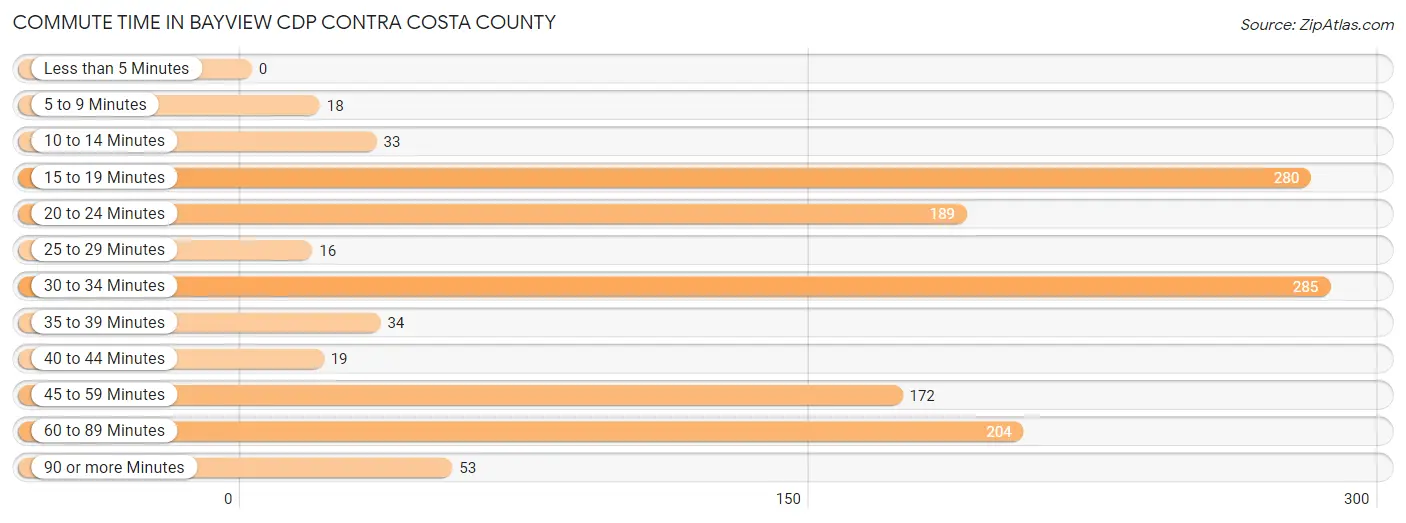
| Commute Time | # Commuters | % Commuters |
| Less than 5 Minutes | 0 | 0.0% |
| 5 to 9 Minutes | 18 | 1.4% |
| 10 to 14 Minutes | 33 | 2.5% |
| 15 to 19 Minutes | 280 | 21.5% |
| 20 to 24 Minutes | 189 | 14.5% |
| 25 to 29 Minutes | 16 | 1.2% |
| 30 to 34 Minutes | 285 | 21.9% |
| 35 to 39 Minutes | 34 | 2.6% |
| 40 to 44 Minutes | 19 | 1.5% |
| 45 to 59 Minutes | 172 | 13.2% |
| 60 to 89 Minutes | 204 | 15.7% |
| 90 or more Minutes | 53 | 4.1% |
Commute Time by Sex in Bayview CDP Contra Costa County
The most common commute times in Bayview CDP Contra Costa County are 15 to 19 minutes (215 commuters, 25.9%) for males and 30 to 34 minutes (175 commuters, 37.1%) for females.
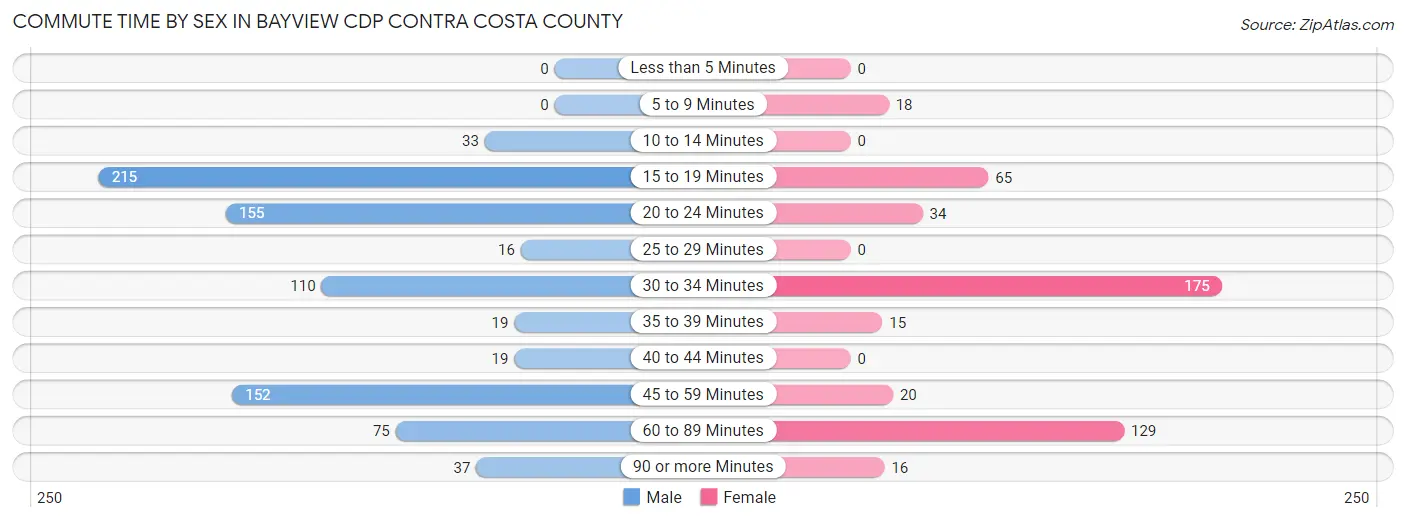
| Commute Time | Male | Female |
| Less than 5 Minutes | 0 (0.0%) | 0 (0.0%) |
| 5 to 9 Minutes | 0 (0.0%) | 18 (3.8%) |
| 10 to 14 Minutes | 33 (4.0%) | 0 (0.0%) |
| 15 to 19 Minutes | 215 (25.9%) | 65 (13.8%) |
| 20 to 24 Minutes | 155 (18.6%) | 34 (7.2%) |
| 25 to 29 Minutes | 16 (1.9%) | 0 (0.0%) |
| 30 to 34 Minutes | 110 (13.2%) | 175 (37.1%) |
| 35 to 39 Minutes | 19 (2.3%) | 15 (3.2%) |
| 40 to 44 Minutes | 19 (2.3%) | 0 (0.0%) |
| 45 to 59 Minutes | 152 (18.3%) | 20 (4.2%) |
| 60 to 89 Minutes | 75 (9.0%) | 129 (27.3%) |
| 90 or more Minutes | 37 (4.4%) | 16 (3.4%) |
Time of Departure to Work by Sex in Bayview CDP Contra Costa County
The most frequent times of departure to work in Bayview CDP Contra Costa County are 6:30 AM to 6:59 AM (433, 52.1%) for males and 9:00 AM to 9:59 AM (170, 36.0%) for females.
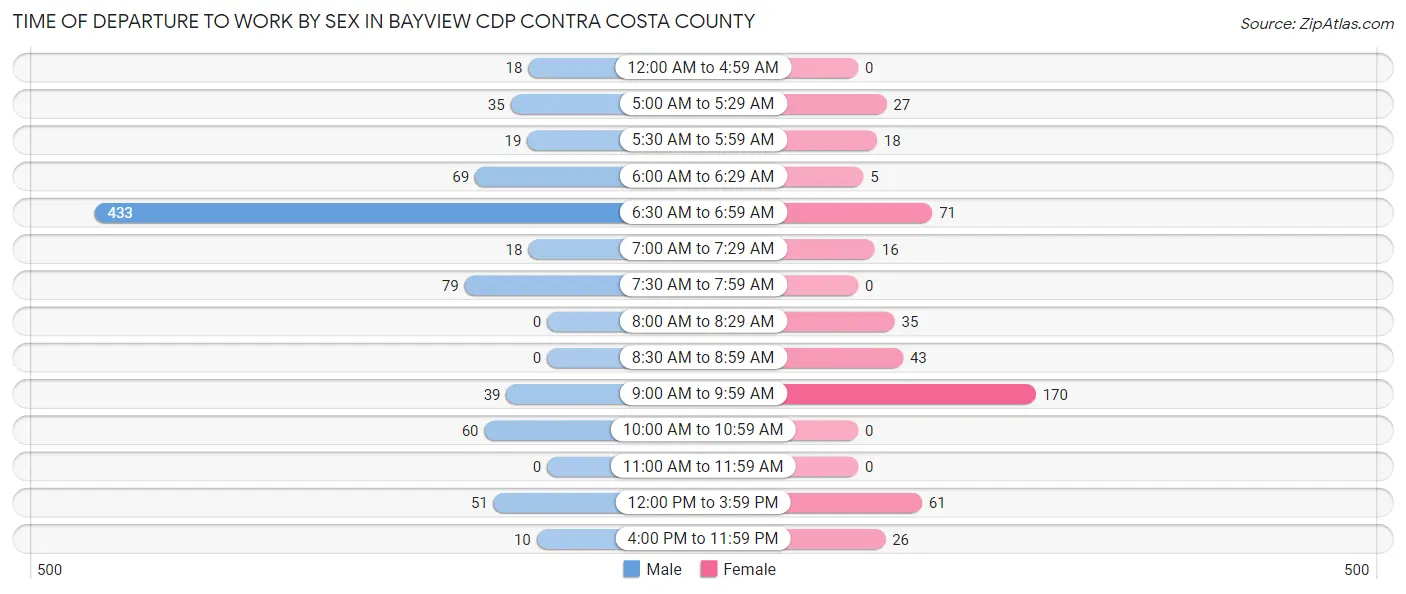
| Time of Departure | Male | Female |
| 12:00 AM to 4:59 AM | 18 (2.2%) | 0 (0.0%) |
| 5:00 AM to 5:29 AM | 35 (4.2%) | 27 (5.7%) |
| 5:30 AM to 5:59 AM | 19 (2.3%) | 18 (3.8%) |
| 6:00 AM to 6:29 AM | 69 (8.3%) | 5 (1.1%) |
| 6:30 AM to 6:59 AM | 433 (52.1%) | 71 (15.0%) |
| 7:00 AM to 7:29 AM | 18 (2.2%) | 16 (3.4%) |
| 7:30 AM to 7:59 AM | 79 (9.5%) | 0 (0.0%) |
| 8:00 AM to 8:29 AM | 0 (0.0%) | 35 (7.4%) |
| 8:30 AM to 8:59 AM | 0 (0.0%) | 43 (9.1%) |
| 9:00 AM to 9:59 AM | 39 (4.7%) | 170 (36.0%) |
| 10:00 AM to 10:59 AM | 60 (7.2%) | 0 (0.0%) |
| 11:00 AM to 11:59 AM | 0 (0.0%) | 0 (0.0%) |
| 12:00 PM to 3:59 PM | 51 (6.1%) | 61 (12.9%) |
| 4:00 PM to 11:59 PM | 10 (1.2%) | 26 (5.5%) |
| Total | 831 (100.0%) | 472 (100.0%) |
Housing Occupancy in Bayview CDP Contra Costa County
Occupancy by Ownership in Bayview CDP Contra Costa County
Of the total 807 dwellings in Bayview CDP Contra Costa County, owner-occupied units account for 598 (74.1%), while renter-occupied units make up 209 (25.9%).
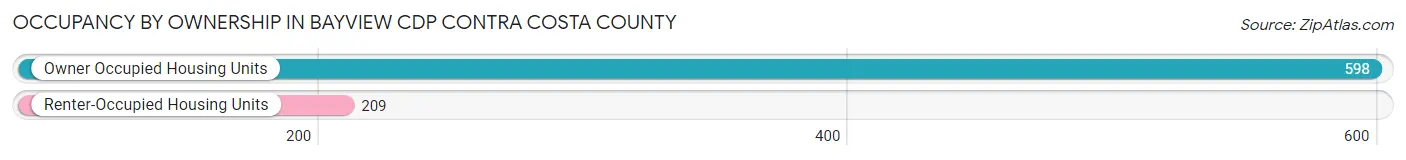
| Occupancy | # Housing Units | % Housing Units |
| Owner Occupied Housing Units | 598 | 74.1% |
| Renter-Occupied Housing Units | 209 | 25.9% |
| Total Occupied Housing Units | 807 | 100.0% |
Occupancy by Household Size in Bayview CDP Contra Costa County
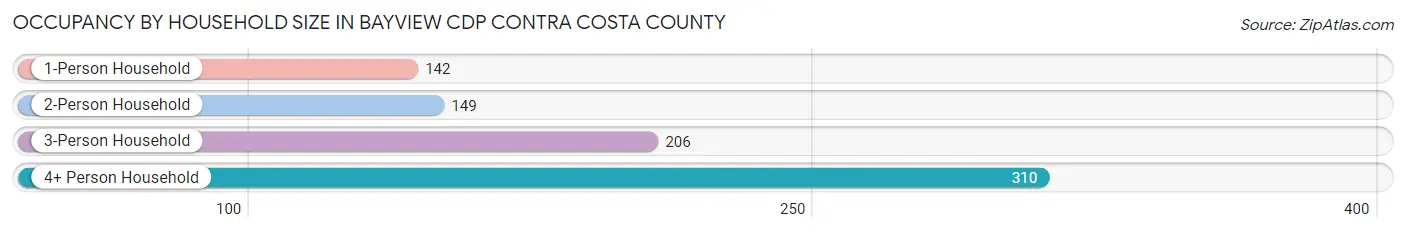
| Household Size | # Housing Units | % Housing Units |
| 1-Person Household | 142 | 17.6% |
| 2-Person Household | 149 | 18.5% |
| 3-Person Household | 206 | 25.5% |
| 4+ Person Household | 310 | 38.4% |
| Total Housing Units | 807 | 100.0% |
Occupancy by Ownership by Household Size in Bayview CDP Contra Costa County
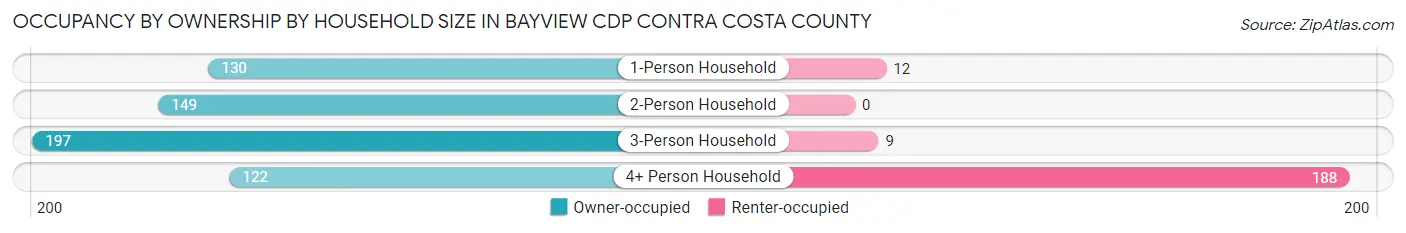
| Household Size | Owner-occupied | Renter-occupied |
| 1-Person Household | 130 (91.5%) | 12 (8.5%) |
| 2-Person Household | 149 (100.0%) | 0 (0.0%) |
| 3-Person Household | 197 (95.6%) | 9 (4.4%) |
| 4+ Person Household | 122 (39.4%) | 188 (60.7%) |
| Total Housing Units | 598 (74.1%) | 209 (25.9%) |
Occupancy by Educational Attainment in Bayview CDP Contra Costa County
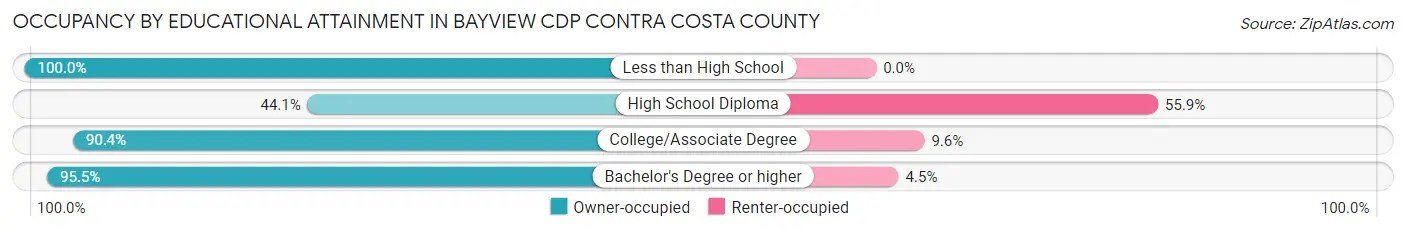
| Household Size | Owner-occupied | Renter-occupied |
| Less than High School | 74 (100.0%) | 0 (0.0%) |
| High School Diploma | 142 (44.1%) | 180 (55.9%) |
| College/Associate Degree | 189 (90.4%) | 20 (9.6%) |
| Bachelor's Degree or higher | 193 (95.5%) | 9 (4.5%) |
Occupancy by Age of Householder in Bayview CDP Contra Costa County
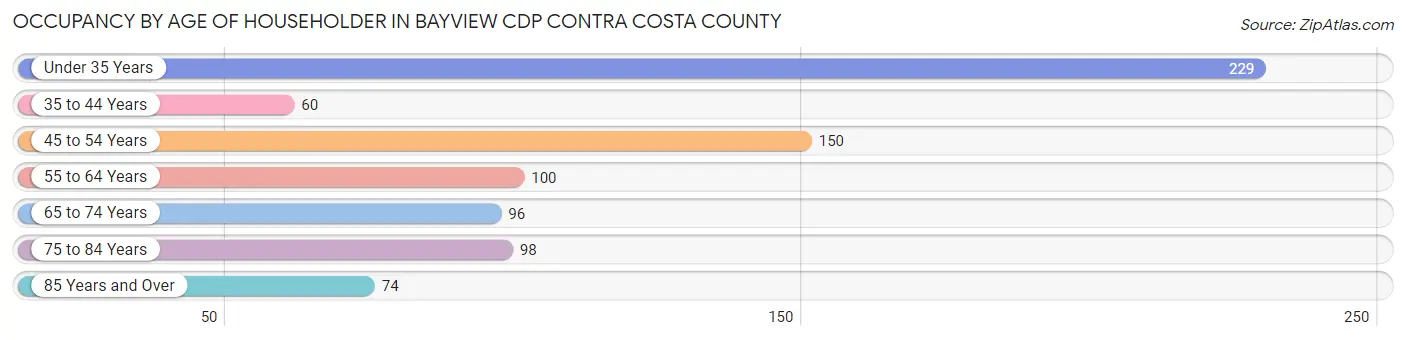
| Age Bracket | # Households | % Households |
| Under 35 Years | 229 | 28.4% |
| 35 to 44 Years | 60 | 7.4% |
| 45 to 54 Years | 150 | 18.6% |
| 55 to 64 Years | 100 | 12.4% |
| 65 to 74 Years | 96 | 11.9% |
| 75 to 84 Years | 98 | 12.1% |
| 85 Years and Over | 74 | 9.2% |
| Total | 807 | 100.0% |
Housing Finances in Bayview CDP Contra Costa County
Median Income by Occupancy in Bayview CDP Contra Costa County
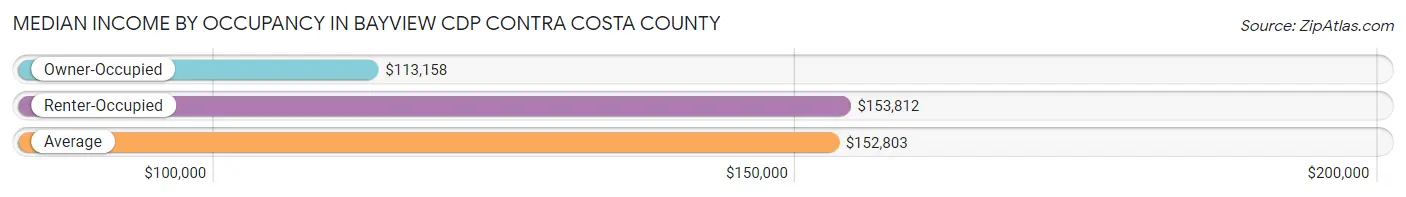
| Occupancy Type | # Households | Median Income |
| Owner-Occupied | 598 (74.1%) | $113,158 |
| Renter-Occupied | 209 (25.9%) | $153,812 |
| Average | 807 (100.0%) | $152,803 |
Occupancy by Householder Income Bracket in Bayview CDP Contra Costa County
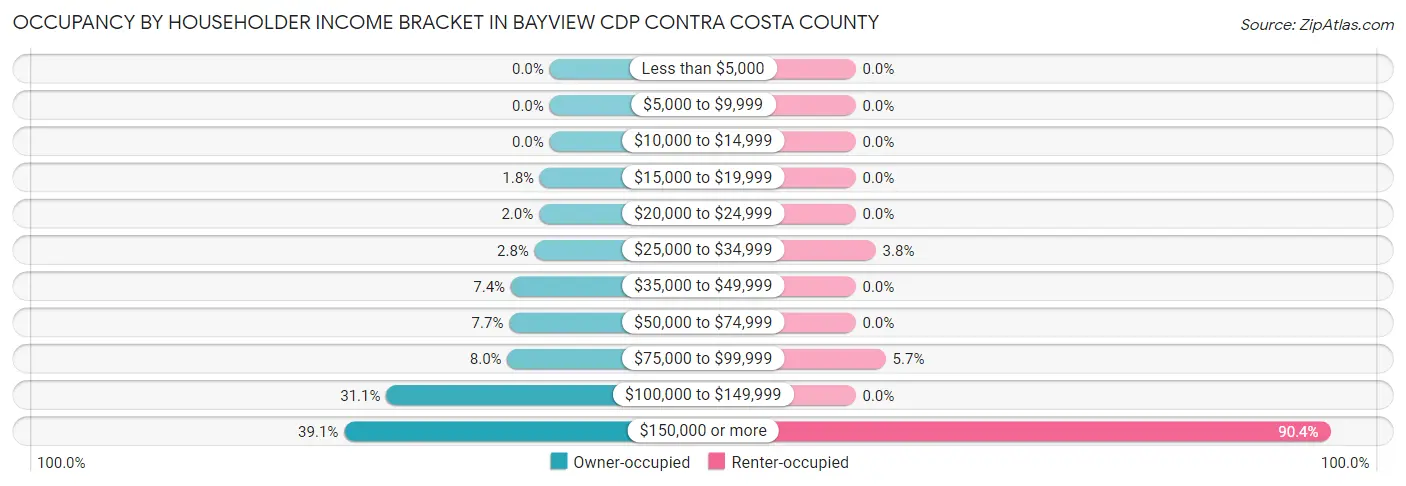
| Income Bracket | Owner-occupied | Renter-occupied |
| Less than $5,000 | 0 (0.0%) | 0 (0.0%) |
| $5,000 to $9,999 | 0 (0.0%) | 0 (0.0%) |
| $10,000 to $14,999 | 0 (0.0%) | 0 (0.0%) |
| $15,000 to $19,999 | 11 (1.8%) | 0 (0.0%) |
| $20,000 to $24,999 | 12 (2.0%) | 0 (0.0%) |
| $25,000 to $34,999 | 17 (2.8%) | 8 (3.8%) |
| $35,000 to $49,999 | 44 (7.4%) | 0 (0.0%) |
| $50,000 to $74,999 | 46 (7.7%) | 0 (0.0%) |
| $75,000 to $99,999 | 48 (8.0%) | 12 (5.7%) |
| $100,000 to $149,999 | 186 (31.1%) | 0 (0.0%) |
| $150,000 or more | 234 (39.1%) | 189 (90.4%) |
| Total | 598 (100.0%) | 209 (100.0%) |
Monthly Housing Cost Tiers in Bayview CDP Contra Costa County
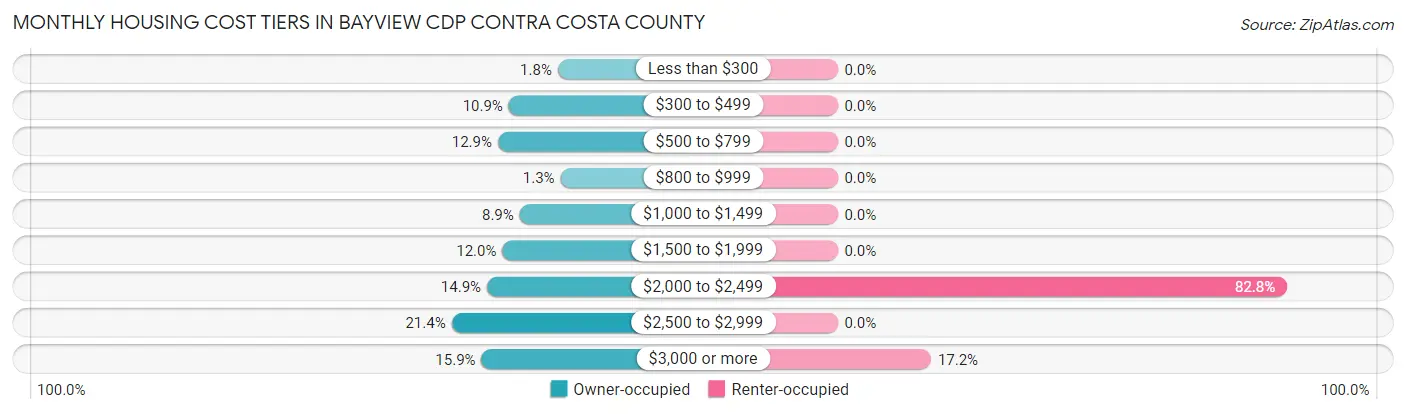
| Monthly Cost | Owner-occupied | Renter-occupied |
| Less than $300 | 11 (1.8%) | 0 (0.0%) |
| $300 to $499 | 65 (10.9%) | 0 (0.0%) |
| $500 to $799 | 77 (12.9%) | 0 (0.0%) |
| $800 to $999 | 8 (1.3%) | 0 (0.0%) |
| $1,000 to $1,499 | 53 (8.9%) | 0 (0.0%) |
| $1,500 to $1,999 | 72 (12.0%) | 0 (0.0%) |
| $2,000 to $2,499 | 89 (14.9%) | 173 (82.8%) |
| $2,500 to $2,999 | 128 (21.4%) | 0 (0.0%) |
| $3,000 or more | 95 (15.9%) | 36 (17.2%) |
| Total | 598 (100.0%) | 209 (100.0%) |
Physical Housing Characteristics in Bayview CDP Contra Costa County
Housing Structures in Bayview CDP Contra Costa County
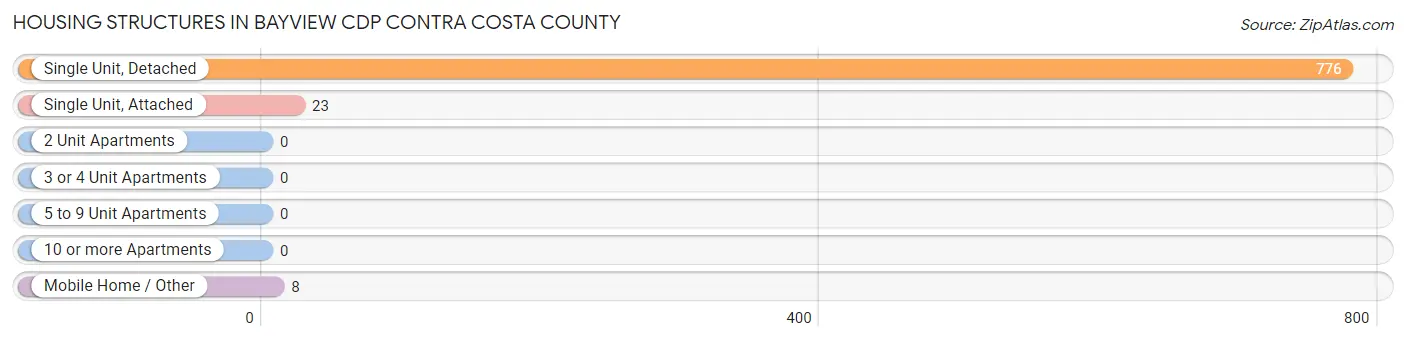
| Structure Type | # Housing Units | % Housing Units |
| Single Unit, Detached | 776 | 96.2% |
| Single Unit, Attached | 23 | 2.9% |
| 2 Unit Apartments | 0 | 0.0% |
| 3 or 4 Unit Apartments | 0 | 0.0% |
| 5 to 9 Unit Apartments | 0 | 0.0% |
| 10 or more Apartments | 0 | 0.0% |
| Mobile Home / Other | 8 | 1.0% |
| Total | 807 | 100.0% |
Housing Structures by Occupancy in Bayview CDP Contra Costa County
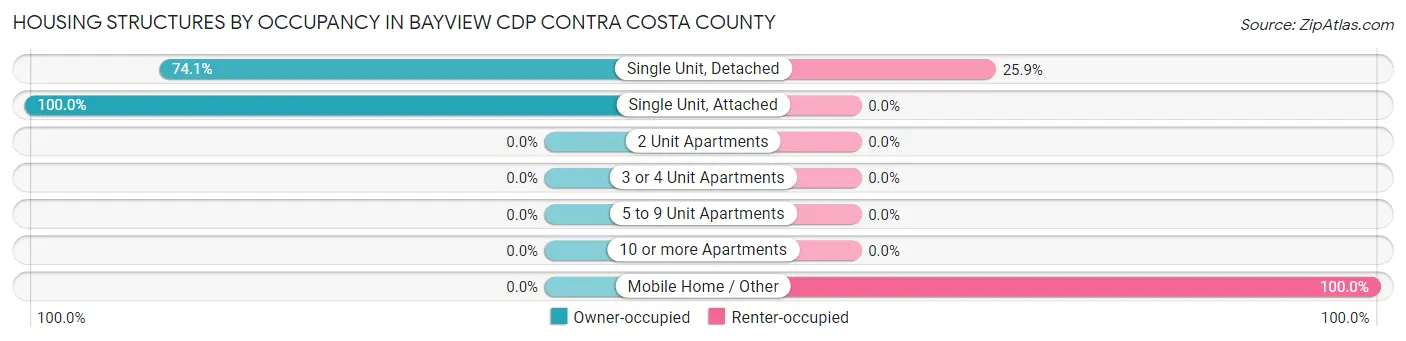
| Structure Type | Owner-occupied | Renter-occupied |
| Single Unit, Detached | 575 (74.1%) | 201 (25.9%) |
| Single Unit, Attached | 23 (100.0%) | 0 (0.0%) |
| 2 Unit Apartments | 0 (0.0%) | 0 (0.0%) |
| 3 or 4 Unit Apartments | 0 (0.0%) | 0 (0.0%) |
| 5 to 9 Unit Apartments | 0 (0.0%) | 0 (0.0%) |
| 10 or more Apartments | 0 (0.0%) | 0 (0.0%) |
| Mobile Home / Other | 0 (0.0%) | 8 (100.0%) |
| Total | 598 (74.1%) | 209 (25.9%) |
Housing Structures by Number of Rooms in Bayview CDP Contra Costa County
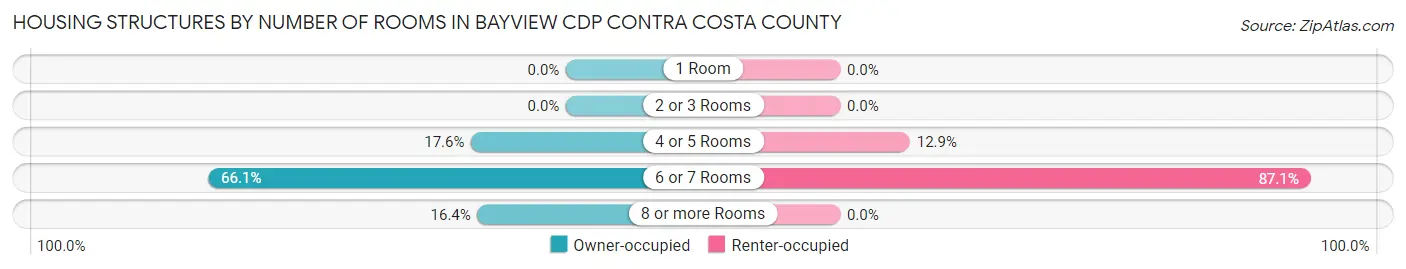
| Number of Rooms | Owner-occupied | Renter-occupied |
| 1 Room | 0 (0.0%) | 0 (0.0%) |
| 2 or 3 Rooms | 0 (0.0%) | 0 (0.0%) |
| 4 or 5 Rooms | 105 (17.6%) | 27 (12.9%) |
| 6 or 7 Rooms | 395 (66.0%) | 182 (87.1%) |
| 8 or more Rooms | 98 (16.4%) | 0 (0.0%) |
| Total | 598 (100.0%) | 209 (100.0%) |
Housing Structure by Heating Type in Bayview CDP Contra Costa County
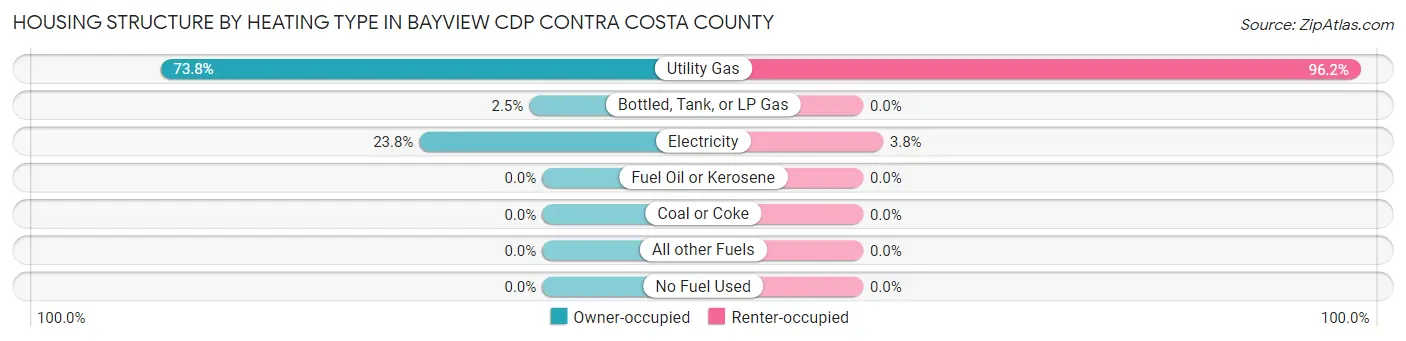
| Heating Type | Owner-occupied | Renter-occupied |
| Utility Gas | 441 (73.8%) | 201 (96.2%) |
| Bottled, Tank, or LP Gas | 15 (2.5%) | 0 (0.0%) |
| Electricity | 142 (23.7%) | 8 (3.8%) |
| Fuel Oil or Kerosene | 0 (0.0%) | 0 (0.0%) |
| Coal or Coke | 0 (0.0%) | 0 (0.0%) |
| All other Fuels | 0 (0.0%) | 0 (0.0%) |
| No Fuel Used | 0 (0.0%) | 0 (0.0%) |
| Total | 598 (100.0%) | 209 (100.0%) |
Household Vehicle Usage in Bayview CDP Contra Costa County
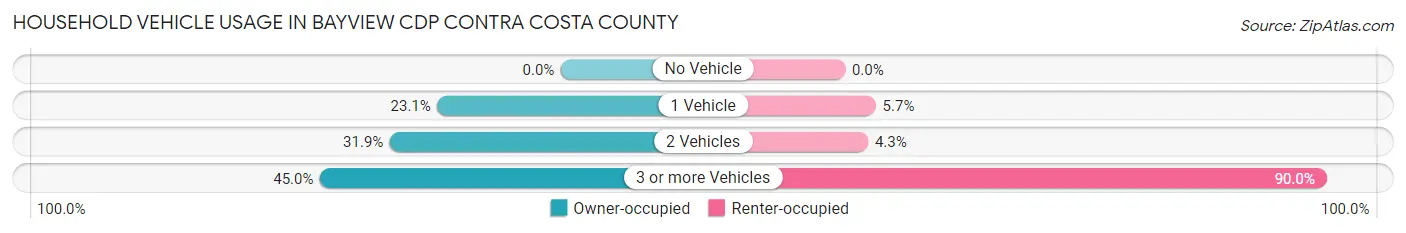
| Vehicles per Household | Owner-occupied | Renter-occupied |
| No Vehicle | 0 (0.0%) | 0 (0.0%) |
| 1 Vehicle | 138 (23.1%) | 12 (5.7%) |
| 2 Vehicles | 191 (31.9%) | 9 (4.3%) |
| 3 or more Vehicles | 269 (45.0%) | 188 (89.9%) |
| Total | 598 (100.0%) | 209 (100.0%) |
Real Estate & Mortgages in Bayview CDP Contra Costa County
Real Estate and Mortgage Overview in Bayview CDP Contra Costa County
| Characteristic | Without Mortgage | With Mortgage |
| Housing Units | 161 | 437 |
| Median Property Value | $603,800 | $681,800 |
| Median Household Income | - | - |
| Monthly Housing Costs | $520 | $95 |
| Real Estate Taxes | $1,914 | $0 |
Property Value by Mortgage Status in Bayview CDP Contra Costa County
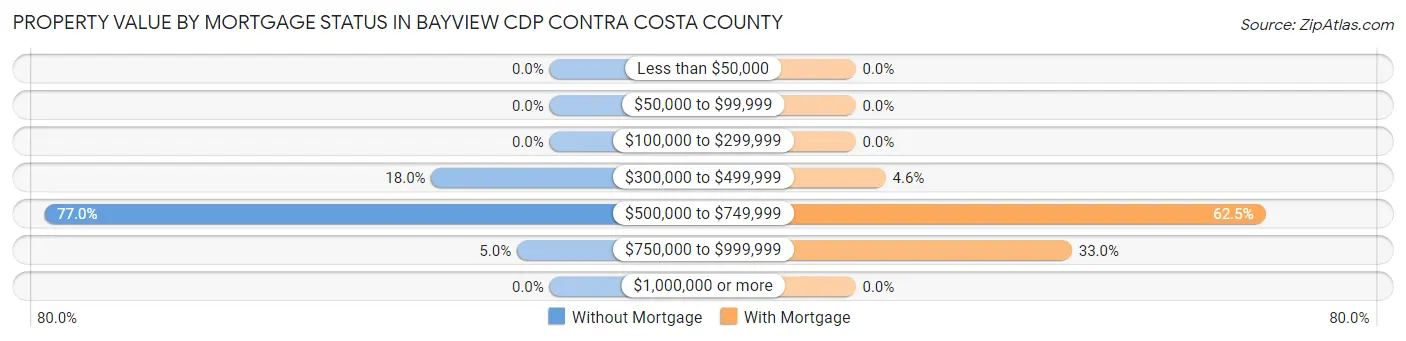
| Property Value | Without Mortgage | With Mortgage |
| Less than $50,000 | 0 (0.0%) | 0 (0.0%) |
| $50,000 to $99,999 | 0 (0.0%) | 0 (0.0%) |
| $100,000 to $299,999 | 0 (0.0%) | 0 (0.0%) |
| $300,000 to $499,999 | 29 (18.0%) | 20 (4.6%) |
| $500,000 to $749,999 | 124 (77.0%) | 273 (62.5%) |
| $750,000 to $999,999 | 8 (5.0%) | 144 (33.0%) |
| $1,000,000 or more | 0 (0.0%) | 0 (0.0%) |
| Total | 161 (100.0%) | 437 (100.0%) |
Household Income by Mortgage Status in Bayview CDP Contra Costa County
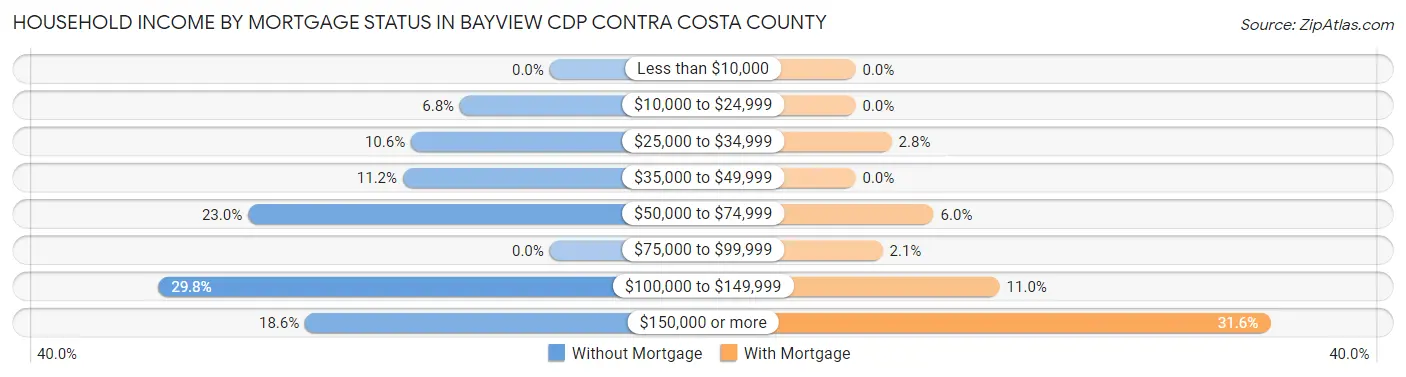
| Household Income | Without Mortgage | With Mortgage |
| Less than $10,000 | 0 (0.0%) | 0 (0.0%) |
| $10,000 to $24,999 | 11 (6.8%) | 0 (0.0%) |
| $25,000 to $34,999 | 17 (10.6%) | 12 (2.8%) |
| $35,000 to $49,999 | 18 (11.2%) | 0 (0.0%) |
| $50,000 to $74,999 | 37 (23.0%) | 26 (5.9%) |
| $75,000 to $99,999 | 0 (0.0%) | 9 (2.1%) |
| $100,000 to $149,999 | 48 (29.8%) | 48 (11.0%) |
| $150,000 or more | 30 (18.6%) | 138 (31.6%) |
| Total | 161 (100.0%) | 437 (100.0%) |
Property Value to Household Income Ratio in Bayview CDP Contra Costa County
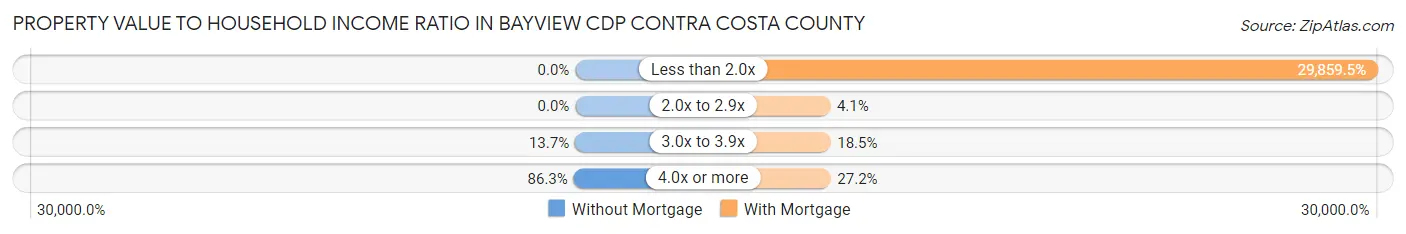
| Value-to-Income Ratio | Without Mortgage | With Mortgage |
| Less than 2.0x | 0 (0.0%) | 130,486 (29,859.5%) |
| 2.0x to 2.9x | 0 (0.0%) | 18 (4.1%) |
| 3.0x to 3.9x | 22 (13.7%) | 81 (18.5%) |
| 4.0x or more | 139 (86.3%) | 119 (27.2%) |
| Total | 161 (100.0%) | 437 (100.0%) |
Real Estate Taxes by Mortgage Status in Bayview CDP Contra Costa County
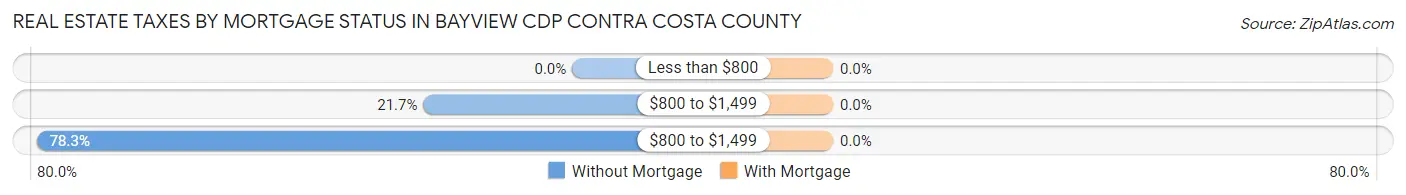
| Property Taxes | Without Mortgage | With Mortgage |
| Less than $800 | 0 (0.0%) | 0 (0.0%) |
| $800 to $1,499 | 35 (21.7%) | 0 (0.0%) |
| $800 to $1,499 | 126 (78.3%) | 0 (0.0%) |
| Total | 161 (100.0%) | 437 (100.0%) |
Health & Disability in Bayview CDP Contra Costa County
Health Insurance Coverage by Age in Bayview CDP Contra Costa County
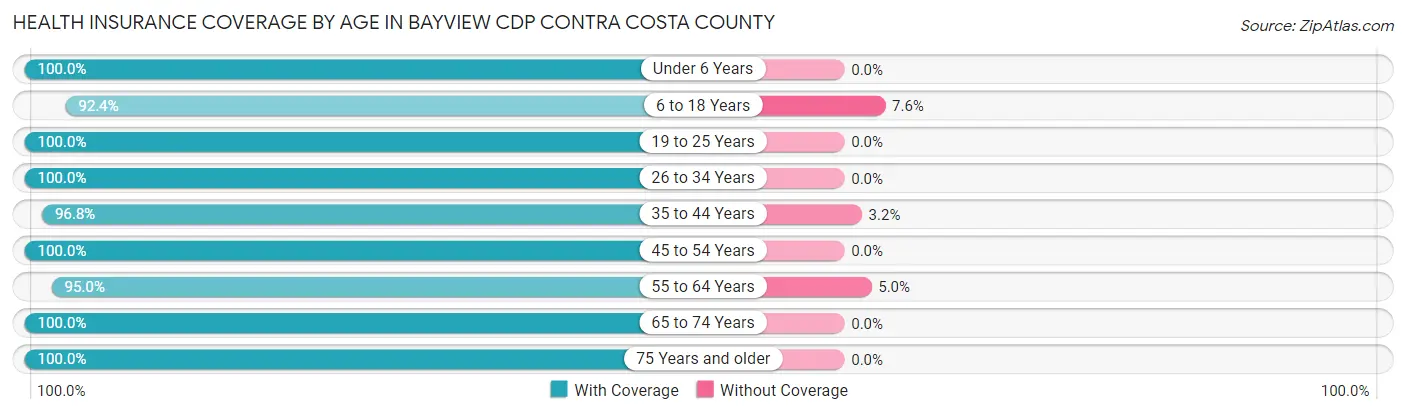
| Age Bracket | With Coverage | Without Coverage |
| Under 6 Years | 26 (100.0%) | 0 (0.0%) |
| 6 to 18 Years | 267 (92.4%) | 22 (7.6%) |
| 19 to 25 Years | 333 (100.0%) | 0 (0.0%) |
| 26 to 34 Years | 397 (100.0%) | 0 (0.0%) |
| 35 to 44 Years | 299 (96.8%) | 10 (3.2%) |
| 45 to 54 Years | 444 (100.0%) | 0 (0.0%) |
| 55 to 64 Years | 283 (95.0%) | 15 (5.0%) |
| 65 to 74 Years | 145 (100.0%) | 0 (0.0%) |
| 75 Years and older | 288 (100.0%) | 0 (0.0%) |
| Total | 2,482 (98.1%) | 47 (1.9%) |
Health Insurance Coverage by Citizenship Status in Bayview CDP Contra Costa County
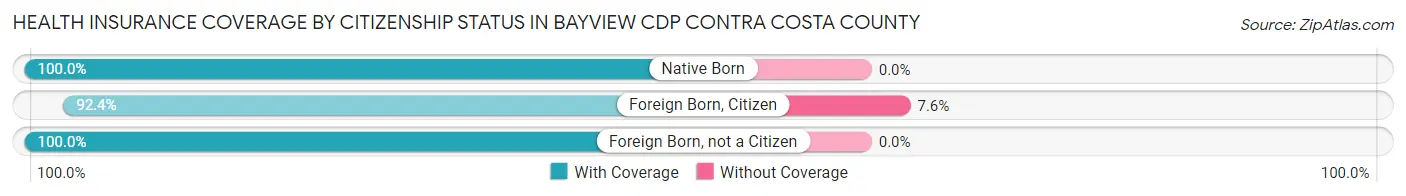
| Citizenship Status | With Coverage | Without Coverage |
| Native Born | 26 (100.0%) | 0 (0.0%) |
| Foreign Born, Citizen | 267 (92.4%) | 22 (7.6%) |
| Foreign Born, not a Citizen | 333 (100.0%) | 0 (0.0%) |
Health Insurance Coverage by Household Income in Bayview CDP Contra Costa County
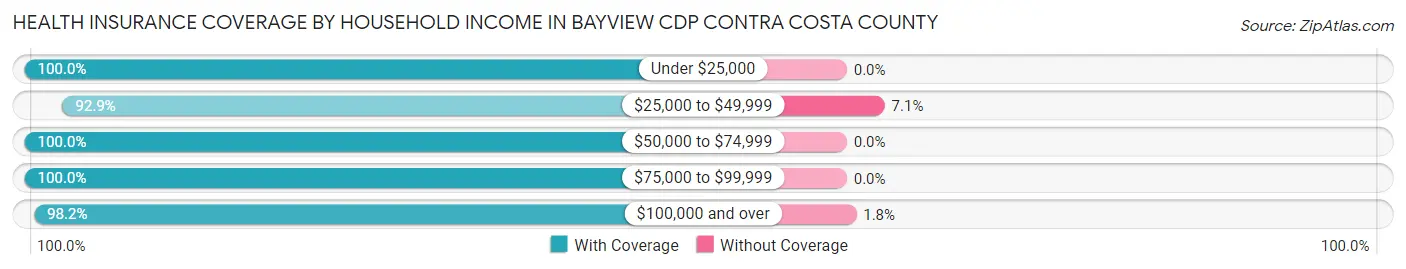
| Household Income | With Coverage | Without Coverage |
| Under $25,000 | 23 (100.0%) | 0 (0.0%) |
| $25,000 to $49,999 | 131 (92.9%) | 10 (7.1%) |
| $50,000 to $74,999 | 143 (100.0%) | 0 (0.0%) |
| $75,000 to $99,999 | 129 (100.0%) | 0 (0.0%) |
| $100,000 and over | 2,045 (98.2%) | 37 (1.8%) |
Public vs Private Health Insurance Coverage by Age in Bayview CDP Contra Costa County
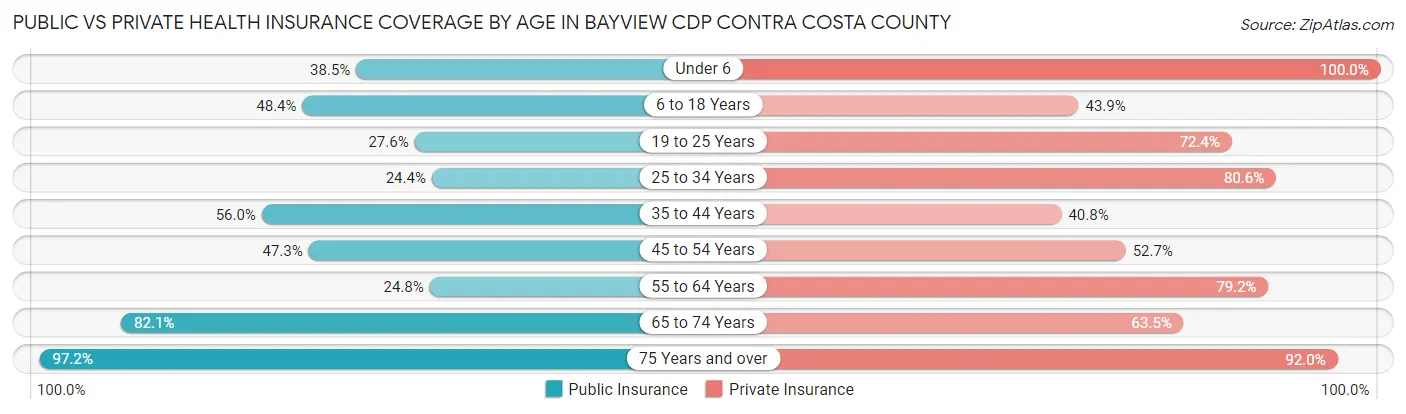
| Age Bracket | Public Insurance | Private Insurance |
| Under 6 | 10 (38.5%) | 26 (100.0%) |
| 6 to 18 Years | 140 (48.4%) | 127 (43.9%) |
| 19 to 25 Years | 92 (27.6%) | 241 (72.4%) |
| 25 to 34 Years | 97 (24.4%) | 320 (80.6%) |
| 35 to 44 Years | 173 (56.0%) | 126 (40.8%) |
| 45 to 54 Years | 210 (47.3%) | 234 (52.7%) |
| 55 to 64 Years | 74 (24.8%) | 236 (79.2%) |
| 65 to 74 Years | 119 (82.1%) | 92 (63.4%) |
| 75 Years and over | 280 (97.2%) | 265 (92.0%) |
| Total | 1,195 (47.2%) | 1,667 (65.9%) |
Disability Status by Sex by Age in Bayview CDP Contra Costa County
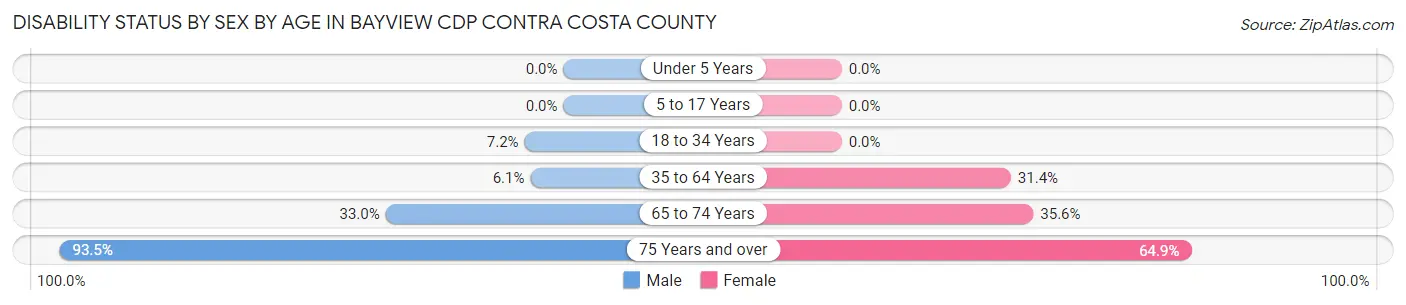
| Age Bracket | Male | Female |
| Under 5 Years | 0 (0.0%) | 0 (0.0%) |
| 5 to 17 Years | 0 (0.0%) | 0 (0.0%) |
| 18 to 34 Years | 34 (7.2%) | 0 (0.0%) |
| 35 to 64 Years | 35 (6.1%) | 151 (31.4%) |
| 65 to 74 Years | 33 (33.0%) | 16 (35.6%) |
| 75 Years and over | 115 (93.5%) | 107 (64.8%) |
Disability Class by Sex by Age in Bayview CDP Contra Costa County
Disability Class: Hearing Difficulty
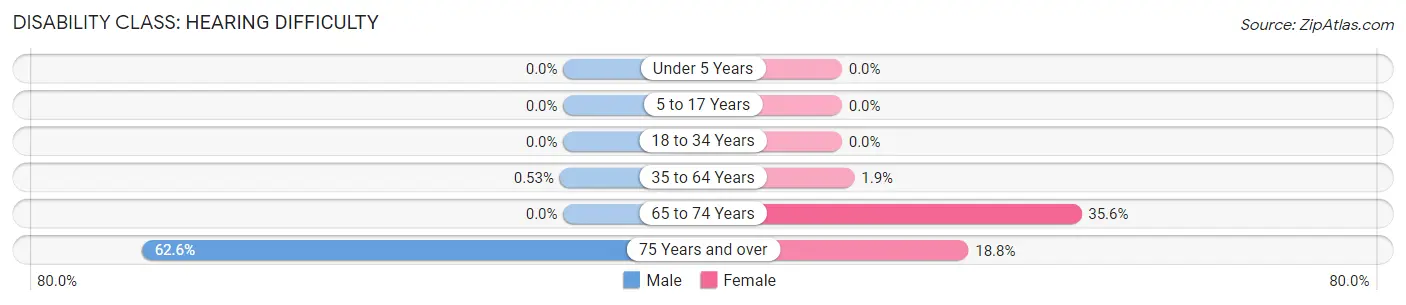
| Age Bracket | Male | Female |
| Under 5 Years | 0 (0.0%) | 0 (0.0%) |
| 5 to 17 Years | 0 (0.0%) | 0 (0.0%) |
| 18 to 34 Years | 0 (0.0%) | 0 (0.0%) |
| 35 to 64 Years | 3 (0.5%) | 9 (1.9%) |
| 65 to 74 Years | 0 (0.0%) | 16 (35.6%) |
| 75 Years and over | 77 (62.6%) | 31 (18.8%) |
Disability Class: Vision Difficulty
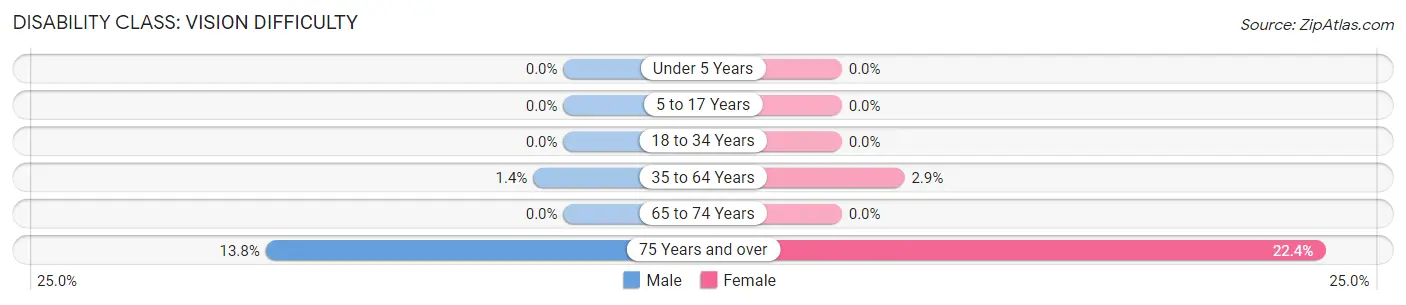
| Age Bracket | Male | Female |
| Under 5 Years | 0 (0.0%) | 0 (0.0%) |
| 5 to 17 Years | 0 (0.0%) | 0 (0.0%) |
| 18 to 34 Years | 0 (0.0%) | 0 (0.0%) |
| 35 to 64 Years | 8 (1.4%) | 14 (2.9%) |
| 65 to 74 Years | 0 (0.0%) | 0 (0.0%) |
| 75 Years and over | 17 (13.8%) | 37 (22.4%) |
Disability Class: Cognitive Difficulty
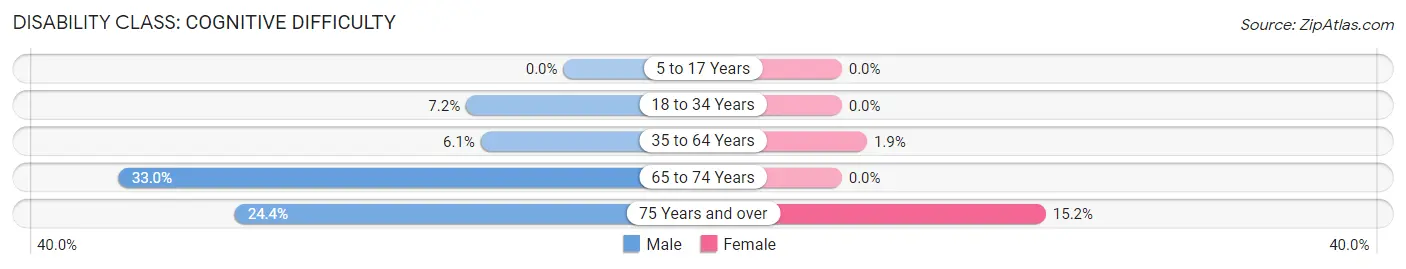
| Age Bracket | Male | Female |
| 5 to 17 Years | 0 (0.0%) | 0 (0.0%) |
| 18 to 34 Years | 34 (7.2%) | 0 (0.0%) |
| 35 to 64 Years | 35 (6.1%) | 9 (1.9%) |
| 65 to 74 Years | 33 (33.0%) | 0 (0.0%) |
| 75 Years and over | 30 (24.4%) | 25 (15.1%) |
Disability Class: Ambulatory Difficulty
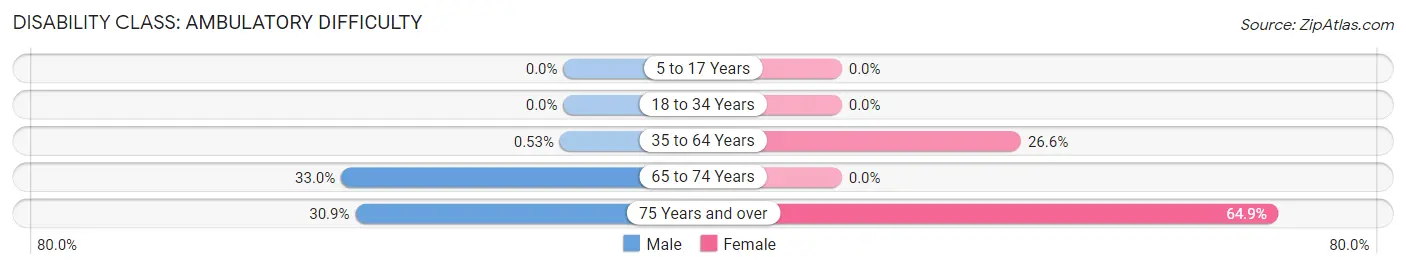
| Age Bracket | Male | Female |
| 5 to 17 Years | 0 (0.0%) | 0 (0.0%) |
| 18 to 34 Years | 0 (0.0%) | 0 (0.0%) |
| 35 to 64 Years | 3 (0.5%) | 128 (26.6%) |
| 65 to 74 Years | 33 (33.0%) | 0 (0.0%) |
| 75 Years and over | 38 (30.9%) | 107 (64.8%) |
Disability Class: Self-Care Difficulty
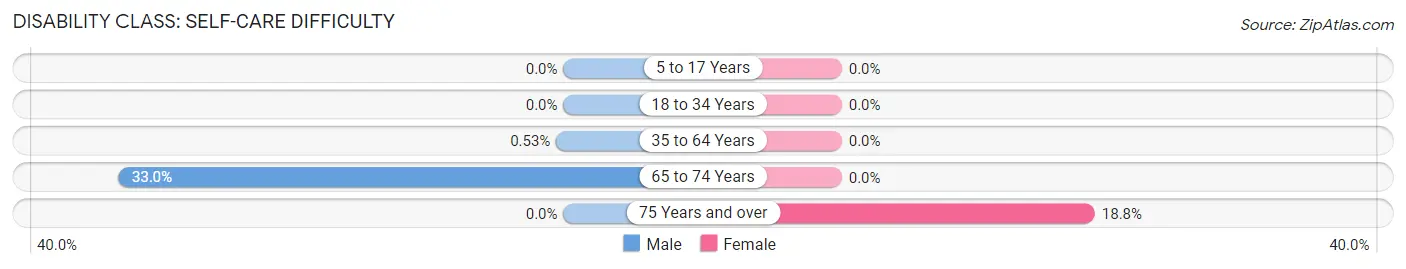
| Age Bracket | Male | Female |
| 5 to 17 Years | 0 (0.0%) | 0 (0.0%) |
| 18 to 34 Years | 0 (0.0%) | 0 (0.0%) |
| 35 to 64 Years | 3 (0.5%) | 0 (0.0%) |
| 65 to 74 Years | 33 (33.0%) | 0 (0.0%) |
| 75 Years and over | 0 (0.0%) | 31 (18.8%) |
Technology Access in Bayview CDP Contra Costa County
Computing Device Access in Bayview CDP Contra Costa County
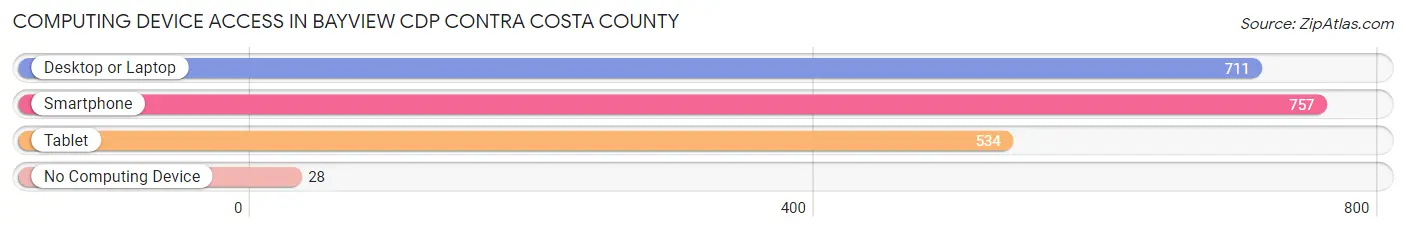
| Device Type | # Households | % Households |
| Desktop or Laptop | 711 | 88.1% |
| Smartphone | 757 | 93.8% |
| Tablet | 534 | 66.2% |
| No Computing Device | 28 | 3.5% |
| Total | 807 | 100.0% |
Internet Access in Bayview CDP Contra Costa County
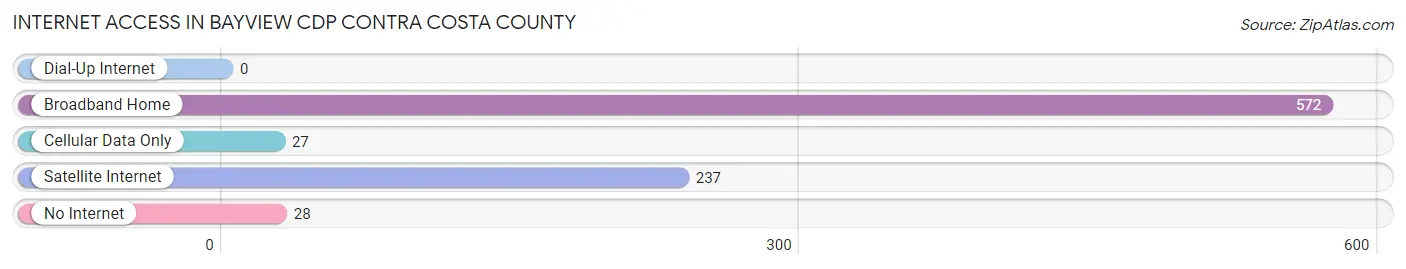
| Internet Type | # Households | % Households |
| Dial-Up Internet | 0 | 0.0% |
| Broadband Home | 572 | 70.9% |
| Cellular Data Only | 27 | 3.4% |
| Satellite Internet | 237 | 29.4% |
| No Internet | 28 | 3.5% |
| Total | 807 | 100.0% |
Bayview CDP Contra Costa County Summary
Bayview Cdp is a census-designated place (CDP) located in Contra Costa County, California. It is situated in the San Francisco Bay Area, and is part of the East Bay region. The population of Bayview Cdp was 4,845 at the 2010 census.
Geography
Bayview Cdp is located at 37°53'17" North, 122°14'45" West (37.8880, -122.2458). It is situated in the San Francisco Bay Area, and is part of the East Bay region. The CDP has a total area of 1.3 square miles, all of which is land.
Demographics
As of the 2010 census, there were 4,845 people, 1,845 households, and 1,220 families residing in the CDP. The population density was 3,717.3 people per square mile. There were 1,945 housing units at an average density of 1,491.2 per square mile. The racial makeup of the CDP was 44.3% White, 15.2% African American, 0.7% Native American, 16.2% Asian, 0.3% Pacific Islander, 19.3% from other races, and 4.2% from two or more races. Hispanic or Latino of any race were 33.2% of the population.
There were 1,845 households, out of which 33.2% had children under the age of 18 living with them, 43.2% were married couples living together, 15.7% had a female householder with no husband present, and 33.2% were non-families. 25.7% of all households were made up of individuals, and 8.2% had someone living alone who was 65 years of age or older. The average household size was 2.63 and the average family size was 3.17.
In the CDP, the population was spread out, with 25.2% under the age of 18, 10.2% from 18 to 24, 33.2% from 25 to 44, 21.2% from 45 to 64, and 10.2% who were 65 years of age or older. The median age was 33 years. For every 100 females, there were 97.2 males. For every 100 females age 18 and over, there were 95.2 males.
The median income for a household in the CDP was $50,972, and the median income for a family was $56,250. Males had a median income of $41,250 versus $35,000 for females. The per capita income for the CDP was $22,917. About 8.2% of families and 10.2% of the population were below the poverty line, including 14.2% of those under age 18 and 8.2% of those age 65 or over.
Economy
Bayview Cdp is home to a variety of businesses, including retail stores, restaurants, and professional services. The CDP is also home to a number of industrial and manufacturing businesses. The largest employers in the CDP are the Contra Costa County government, the City of Richmond, and the Chevron Corporation.
The CDP is served by the Bay Area Rapid Transit (BART) system, which provides access to the rest of the Bay Area. The CDP is also served by the Richmond-San Rafael Bridge, which connects the CDP to Marin County.
Conclusion
Bayview Cdp is a census-designated place located in Contra Costa County, California. It is situated in the San Francisco Bay Area, and is part of the East Bay region. The population of Bayview Cdp was 4,845 at the 2010 census. The CDP has a total area of 1.3 square miles, all of which is land. The racial makeup of the CDP was 44.3% White, 15.2% African American, 0.7% Native American, 16.2% Asian, 0.3% Pacific Islander, 19.3% from other races, and 4.2% from two or more races. The CDP is home to a variety of businesses, including retail stores, restaurants, and professional services. The CDP is also served by the Bay Area Rapid Transit (BART) system, which provides access to the rest of the Bay Area. The CDP is also served by the Richmond-San Rafael Bridge, which connects the CDP to Marin County.
Common Questions
What is Per Capita Income in Bayview CDP Contra Costa County?
Per Capita income in Bayview CDP Contra Costa County is $49,367.
What is the Median Family Income in Bayview CDP Contra Costa County?
Median Family Income in Bayview CDP Contra Costa County is $154,061.
What is the Median Household income in Bayview CDP Contra Costa County?
Median Household Income in Bayview CDP Contra Costa County is $152,803.
What is Income or Wage Gap in Bayview CDP Contra Costa County?
Income or Wage Gap in Bayview CDP Contra Costa County is 11.7%.
Women in Bayview CDP Contra Costa County earn 88.3 cents for every dollar earned by a man.
What is Inequality or Gini Index in Bayview CDP Contra Costa County?
Inequality or Gini Index in Bayview CDP Contra Costa County is 0.32.
What is the Total Population of Bayview CDP Contra Costa County?
Total Population of Bayview CDP Contra Costa County is 2,529.
What is the Total Male Population of Bayview CDP Contra Costa County?
Total Male Population of Bayview CDP Contra Costa County is 1,348.
What is the Total Female Population of Bayview CDP Contra Costa County?
Total Female Population of Bayview CDP Contra Costa County is 1,181.
What is the Ratio of Males per 100 Females in Bayview CDP Contra Costa County?
There are 114.14 Males per 100 Females in Bayview CDP Contra Costa County.
What is the Ratio of Females per 100 Males in Bayview CDP Contra Costa County?
There are 87.61 Females per 100 Males in Bayview CDP Contra Costa County.
What is the Median Population Age in Bayview CDP Contra Costa County?
Median Population Age in Bayview CDP Contra Costa County is 44.5 Years.
What is the Average Family Size in Bayview CDP Contra Costa County
Average Family Size in Bayview CDP Contra Costa County is 3.6 People.
What is the Average Household Size in Bayview CDP Contra Costa County
Average Household Size in Bayview CDP Contra Costa County is 3.1 People.
How Large is the Labor Force in Bayview CDP Contra Costa County?
There are 1,544 People in the Labor Forcein in Bayview CDP Contra Costa County.
What is the Percentage of People in the Labor Force in Bayview CDP Contra Costa County?
67.0% of People are in the Labor Force in Bayview CDP Contra Costa County.
What is the Unemployment Rate in Bayview CDP Contra Costa County?
Unemployment Rate in Bayview CDP Contra Costa County is 9.7%.