Zip Codes with the Highest Percentage of Population Employed in Installation, Maintenance & Repair in Novato, CA
RELATED REPORTS & OPTIONS
Installation, Maintenance & Repair
Novato
Compare Zip Codes
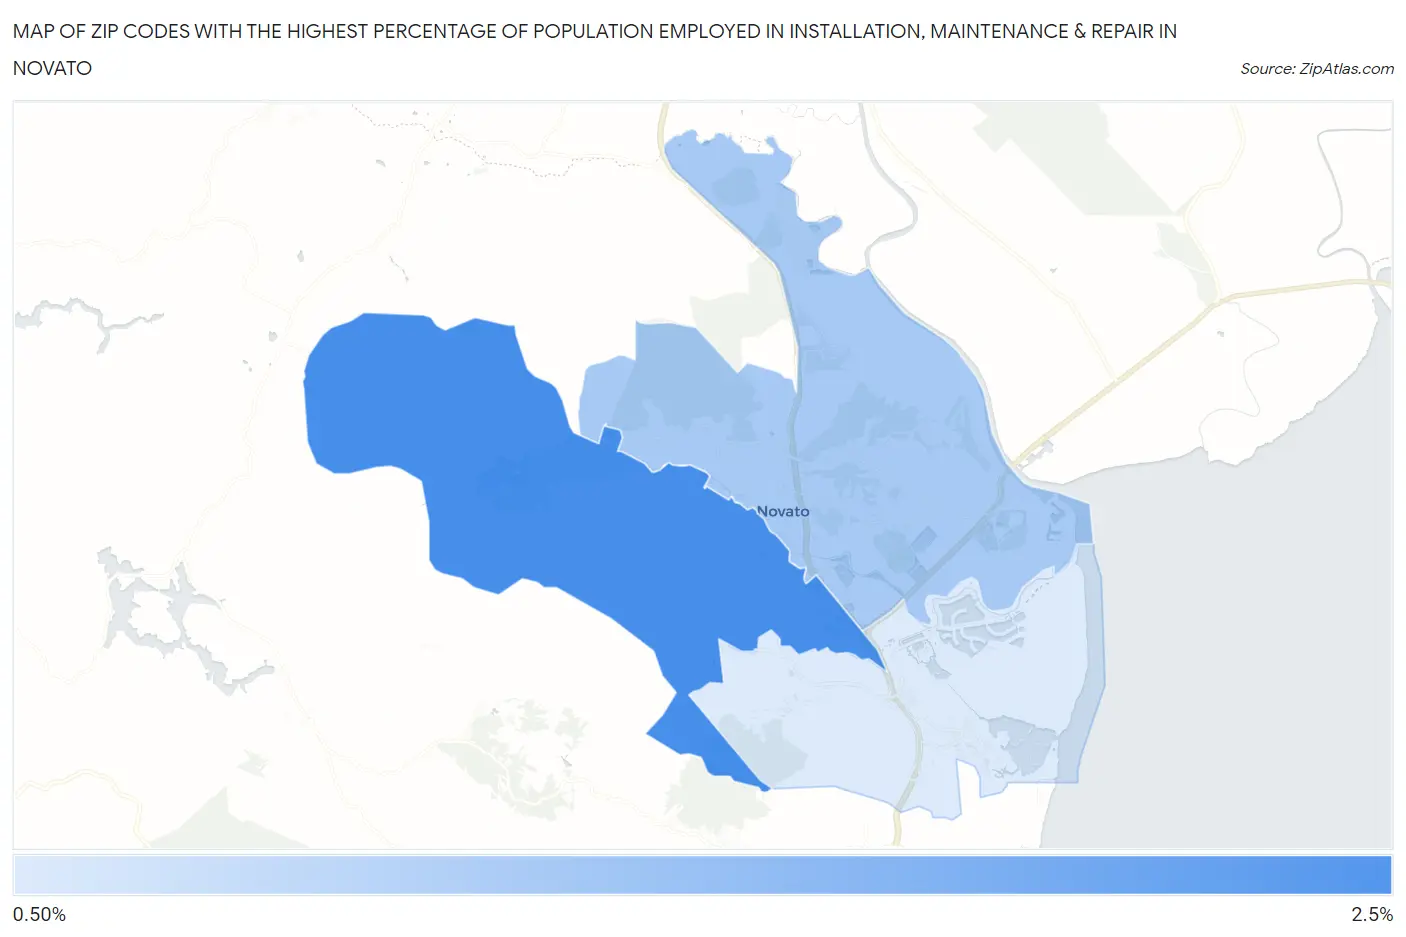
Map of Zip Codes with the Highest Percentage of Population Employed in Installation, Maintenance & Repair in Novato
0.93%
2.1%
Zip Codes with the Highest Percentage of Population Employed in Installation, Maintenance & Repair in Novato, CA
| Zip Code | % Employed | vs State | vs National | |
| 1. | 94947 | 2.1% | 2.6%(-0.496)#945 | 3.1%(-1.01)#21,732 |
| 2. | 94945 | 1.3% | 2.6%(-1.23)#1,162 | 3.1%(-1.74)#24,795 |
| 3. | 94949 | 0.93% | 2.6%(-1.62)#1,266 | 3.1%(-2.13)#26,103 |
1
Common Questions
What are the Top Zip Codes with the Highest Percentage of Population Employed in Installation, Maintenance & Repair in Novato, CA?
Top Zip Codes with the Highest Percentage of Population Employed in Installation, Maintenance & Repair in Novato, CA are:
What zip code has the Highest Percentage of Population Employed in Installation, Maintenance & Repair in Novato, CA?
94947 has the Highest Percentage of Population Employed in Installation, Maintenance & Repair in Novato, CA with 2.1%.
What is the Percentage of Population Employed in Installation, Maintenance & Repair in Novato, CA?
Percentage of Population Employed in Installation, Maintenance & Repair in Novato is 1.6%.
What is the Percentage of Population Employed in Installation, Maintenance & Repair in California?
Percentage of Population Employed in Installation, Maintenance & Repair in California is 2.6%.
What is the Percentage of Population Employed in Installation, Maintenance & Repair in the United States?
Percentage of Population Employed in Installation, Maintenance & Repair in the United States is 3.1%.