Cities with the Most Immigrants from Netherlands in California
RELATED REPORTS & OPTIONS
Netherlands
California
Compare Cities
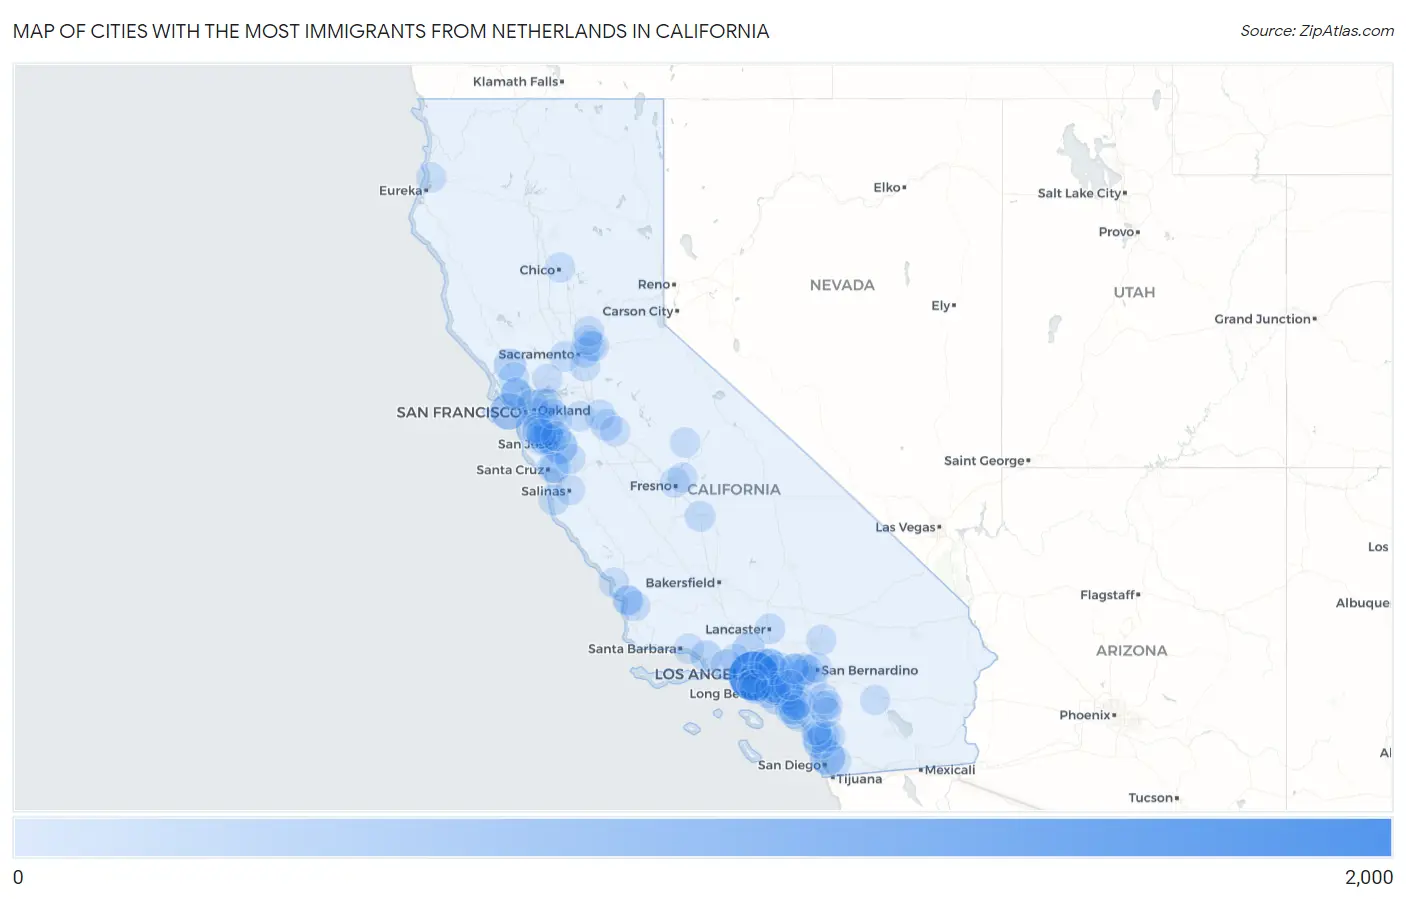
Map of Cities with the Most Immigrants from Netherlands in California
0
2,000
Cities with the Most Immigrants from Netherlands in California
| City | Netherlands | vs State | vs National | |
| 1. | Los Angeles | 1,662 | 17,937(9.27%)#1 | 83,187(2.00%)#2 |
| 2. | San Francisco | 586 | 17,937(3.27%)#2 | 83,187(0.70%)#5 |
| 3. | San Diego | 459 | 17,937(2.56%)#3 | 83,187(0.55%)#7 |
| 4. | San Jose | 417 | 17,937(2.32%)#4 | 83,187(0.50%)#9 |
| 5. | Encinitas | 304 | 17,937(1.69%)#5 | 83,187(0.37%)#18 |
| 6. | Irvine | 253 | 17,937(1.41%)#6 | 83,187(0.30%)#23 |
| 7. | Santa Clarita | 240 | 17,937(1.34%)#7 | 83,187(0.29%)#26 |
| 8. | Santa Rosa | 240 | 17,937(1.34%)#8 | 83,187(0.29%)#27 |
| 9. | Pasadena | 204 | 17,937(1.14%)#9 | 83,187(0.25%)#32 |
| 10. | Huntington Beach | 171 | 17,937(0.95%)#10 | 83,187(0.21%)#36 |
| 11. | San Marcos | 169 | 17,937(0.94%)#11 | 83,187(0.20%)#38 |
| 12. | Long Beach | 167 | 17,937(0.93%)#12 | 83,187(0.20%)#39 |
| 13. | Lakewood | 160 | 17,937(0.89%)#13 | 83,187(0.19%)#41 |
| 14. | San Buenaventura Ventura | 154 | 17,937(0.86%)#14 | 83,187(0.19%)#46 |
| 15. | Santa Clara | 141 | 17,937(0.79%)#15 | 83,187(0.17%)#50 |
| 16. | Mountain View | 137 | 17,937(0.76%)#16 | 83,187(0.16%)#53 |
| 17. | Modesto | 136 | 17,937(0.76%)#17 | 83,187(0.16%)#55 |
| 18. | Riverside | 134 | 17,937(0.75%)#18 | 83,187(0.16%)#57 |
| 19. | Rancho Cucamonga | 134 | 17,937(0.75%)#19 | 83,187(0.16%)#59 |
| 20. | Sleepy Hollow | 130 | 17,937(0.72%)#20 | 83,187(0.16%)#61 |
| 21. | Thousand Oaks | 129 | 17,937(0.72%)#21 | 83,187(0.16%)#63 |
| 22. | Soquel | 127 | 17,937(0.71%)#22 | 83,187(0.15%)#65 |
| 23. | Rancho Santa Margarita | 126 | 17,937(0.70%)#23 | 83,187(0.15%)#68 |
| 24. | Oakland | 125 | 17,937(0.70%)#24 | 83,187(0.15%)#69 |
| 25. | Fremont | 120 | 17,937(0.67%)#25 | 83,187(0.14%)#74 |
| 26. | Berkeley | 114 | 17,937(0.64%)#26 | 83,187(0.14%)#79 |
| 27. | Visalia | 112 | 17,937(0.62%)#27 | 83,187(0.13%)#82 |
| 28. | Escondido | 110 | 17,937(0.61%)#28 | 83,187(0.13%)#84 |
| 29. | San Mateo | 109 | 17,937(0.61%)#29 | 83,187(0.13%)#87 |
| 30. | Pleasanton | 105 | 17,937(0.59%)#30 | 83,187(0.13%)#90 |
| 31. | Upland | 103 | 17,937(0.57%)#31 | 83,187(0.12%)#92 |
| 32. | Aptos | 103 | 17,937(0.57%)#32 | 83,187(0.12%)#94 |
| 33. | Lafayette | 101 | 17,937(0.56%)#33 | 83,187(0.12%)#97 |
| 34. | Carmel By The Sea | 99 | 17,937(0.55%)#34 | 83,187(0.12%)#100 |
| 35. | Carlsbad | 98 | 17,937(0.55%)#35 | 83,187(0.12%)#101 |
| 36. | San Clemente | 98 | 17,937(0.55%)#36 | 83,187(0.12%)#102 |
| 37. | Tustin | 96 | 17,937(0.54%)#37 | 83,187(0.12%)#105 |
| 38. | Orange | 93 | 17,937(0.52%)#38 | 83,187(0.11%)#109 |
| 39. | Monrovia | 93 | 17,937(0.52%)#39 | 83,187(0.11%)#111 |
| 40. | Ripon | 93 | 17,937(0.52%)#40 | 83,187(0.11%)#112 |
| 41. | Palo Alto | 92 | 17,937(0.51%)#41 | 83,187(0.11%)#113 |
| 42. | Petaluma | 92 | 17,937(0.51%)#42 | 83,187(0.11%)#114 |
| 43. | La Habra | 86 | 17,937(0.48%)#43 | 83,187(0.10%)#124 |
| 44. | Ontario | 85 | 17,937(0.47%)#44 | 83,187(0.10%)#126 |
| 45. | Sunnyvale | 85 | 17,937(0.47%)#45 | 83,187(0.10%)#127 |
| 46. | Redwood City | 83 | 17,937(0.46%)#46 | 83,187(0.10%)#131 |
| 47. | Buena Park | 77 | 17,937(0.43%)#47 | 83,187(0.09%)#145 |
| 48. | Davis | 77 | 17,937(0.43%)#48 | 83,187(0.09%)#146 |
| 49. | Altadena | 76 | 17,937(0.42%)#49 | 83,187(0.09%)#150 |
| 50. | Lancaster | 75 | 17,937(0.42%)#50 | 83,187(0.09%)#151 |
| 51. | Citrus Heights | 75 | 17,937(0.42%)#51 | 83,187(0.09%)#153 |
| 52. | Laguna Beach | 75 | 17,937(0.42%)#52 | 83,187(0.09%)#157 |
| 53. | Fontana | 73 | 17,937(0.41%)#53 | 83,187(0.09%)#161 |
| 54. | Oceanside | 73 | 17,937(0.41%)#54 | 83,187(0.09%)#162 |
| 55. | Morgan Hill | 71 | 17,937(0.40%)#55 | 83,187(0.09%)#174 |
| 56. | Dana Point | 70 | 17,937(0.39%)#56 | 83,187(0.08%)#176 |
| 57. | Apple Valley | 69 | 17,937(0.38%)#57 | 83,187(0.08%)#179 |
| 58. | Temple City | 69 | 17,937(0.38%)#58 | 83,187(0.08%)#181 |
| 59. | Toro Canyon | 69 | 17,937(0.38%)#59 | 83,187(0.08%)#183 |
| 60. | Murrieta | 68 | 17,937(0.38%)#60 | 83,187(0.08%)#185 |
| 61. | Laguna Niguel | 65 | 17,937(0.36%)#61 | 83,187(0.08%)#194 |
| 62. | Elk Grove | 64 | 17,937(0.36%)#62 | 83,187(0.08%)#197 |
| 63. | Arden Arcade | 63 | 17,937(0.35%)#63 | 83,187(0.08%)#202 |
| 64. | Orangevale | 63 | 17,937(0.35%)#64 | 83,187(0.08%)#204 |
| 65. | Walnut Creek | 62 | 17,937(0.35%)#65 | 83,187(0.07%)#206 |
| 66. | Lincoln | 62 | 17,937(0.35%)#66 | 83,187(0.07%)#208 |
| 67. | Cypress | 62 | 17,937(0.35%)#67 | 83,187(0.07%)#209 |
| 68. | Culver City | 62 | 17,937(0.35%)#68 | 83,187(0.07%)#210 |
| 69. | Lucas Valley Marinwood | 61 | 17,937(0.34%)#69 | 83,187(0.07%)#219 |
| 70. | Tracy | 60 | 17,937(0.33%)#70 | 83,187(0.07%)#223 |
| 71. | Simi Valley | 59 | 17,937(0.33%)#71 | 83,187(0.07%)#226 |
| 72. | Turlock | 59 | 17,937(0.33%)#72 | 83,187(0.07%)#228 |
| 73. | San Bernardino | 58 | 17,937(0.32%)#73 | 83,187(0.07%)#232 |
| 74. | Menifee | 58 | 17,937(0.32%)#74 | 83,187(0.07%)#235 |
| 75. | Mission Viejo | 58 | 17,937(0.32%)#75 | 83,187(0.07%)#236 |
| 76. | Torrance | 57 | 17,937(0.32%)#76 | 83,187(0.07%)#240 |
| 77. | Claremont | 55 | 17,937(0.31%)#77 | 83,187(0.07%)#247 |
| 78. | Oakhurst | 55 | 17,937(0.31%)#78 | 83,187(0.07%)#250 |
| 79. | Foster City | 54 | 17,937(0.30%)#79 | 83,187(0.06%)#254 |
| 80. | Glendale | 53 | 17,937(0.30%)#80 | 83,187(0.06%)#257 |
| 81. | Salinas | 53 | 17,937(0.30%)#81 | 83,187(0.06%)#258 |
| 82. | Fresno | 52 | 17,937(0.29%)#82 | 83,187(0.06%)#263 |
| 83. | Roseville | 50 | 17,937(0.28%)#83 | 83,187(0.06%)#271 |
| 84. | Nipomo | 50 | 17,937(0.28%)#84 | 83,187(0.06%)#276 |
| 85. | Chico | 49 | 17,937(0.27%)#85 | 83,187(0.06%)#277 |
| 86. | Yorba Linda | 49 | 17,937(0.27%)#86 | 83,187(0.06%)#278 |
| 87. | Oceano | 49 | 17,937(0.27%)#87 | 83,187(0.06%)#284 |
| 88. | Temecula | 47 | 17,937(0.26%)#88 | 83,187(0.06%)#296 |
| 89. | Menlo Park | 47 | 17,937(0.26%)#89 | 83,187(0.06%)#299 |
| 90. | San Ramon | 46 | 17,937(0.26%)#90 | 83,187(0.06%)#309 |
| 91. | Milpitas | 45 | 17,937(0.25%)#91 | 83,187(0.05%)#316 |
| 92. | Morro Bay | 45 | 17,937(0.25%)#92 | 83,187(0.05%)#319 |
| 93. | Clovis | 44 | 17,937(0.25%)#93 | 83,187(0.05%)#320 |
| 94. | Fairfield | 44 | 17,937(0.25%)#94 | 83,187(0.05%)#321 |
| 95. | Manhattan Beach | 44 | 17,937(0.25%)#95 | 83,187(0.05%)#324 |
| 96. | French Valley | 43 | 17,937(0.24%)#96 | 83,187(0.05%)#331 |
| 97. | La Quinta | 43 | 17,937(0.24%)#97 | 83,187(0.05%)#332 |
| 98. | Casa De Oro Mount Helix | 43 | 17,937(0.24%)#98 | 83,187(0.05%)#333 |
| 99. | Mckinleyville | 42 | 17,937(0.23%)#99 | 83,187(0.05%)#337 |
| 100. | Grover Beach | 42 | 17,937(0.23%)#100 | 83,187(0.05%)#339 |
Common Questions
What are the Top 10 Cities with the Most Immigrants from Netherlands in California?
Top 10 Cities with the Most Immigrants from Netherlands in California are:
#1
1,662
#2
586
#3
459
#4
417
#5
304
#6
253
#7
240
#8
240
#9
204
#10
171
What city has the Most Immigrants from Netherlands in California?
Los Angeles has the Most Immigrants from Netherlands in California with 1,662.
What is the Total Immigrants from Netherlands in the State of California?
Total Immigrants from Netherlands in California is 17,937.
What is the Total Immigrants from Netherlands in the United States?
Total Immigrants from Netherlands in the United States is 83,187.