Married-Couple Family Poverty by Race, Ethnicity and Immigration Origin
SELECT DEMOGRAPHIC
Select Demographic
Married-Couple Family Poverty
Common Questions
What are the top races in the United States with the lowest poverty level among married-couple families?
The top races in the United States with the lowest poverty level among married-couple families are:
#1
Asians
4.7%
(97.6/100)
#2
Whites/Caucasians
4.8%
(93.1/100)
#3
Hawaiians
5.1%
(62.3/100)
What are the top ancestries in the United States with the lowest poverty level among married-couple families?
The top ancestries in the United States with the lowest poverty level among married-couple families are:
#1
Chinese
3.6%
(100.0/100)
#2
Norwegians
3.7%
(100.0/100)
#3
Slovenes
3.8%
(100.0/100)
#4
Swedes
3.9%
(100.0/100)
#5
Luxembourgers
3.9%
(100.0/100)
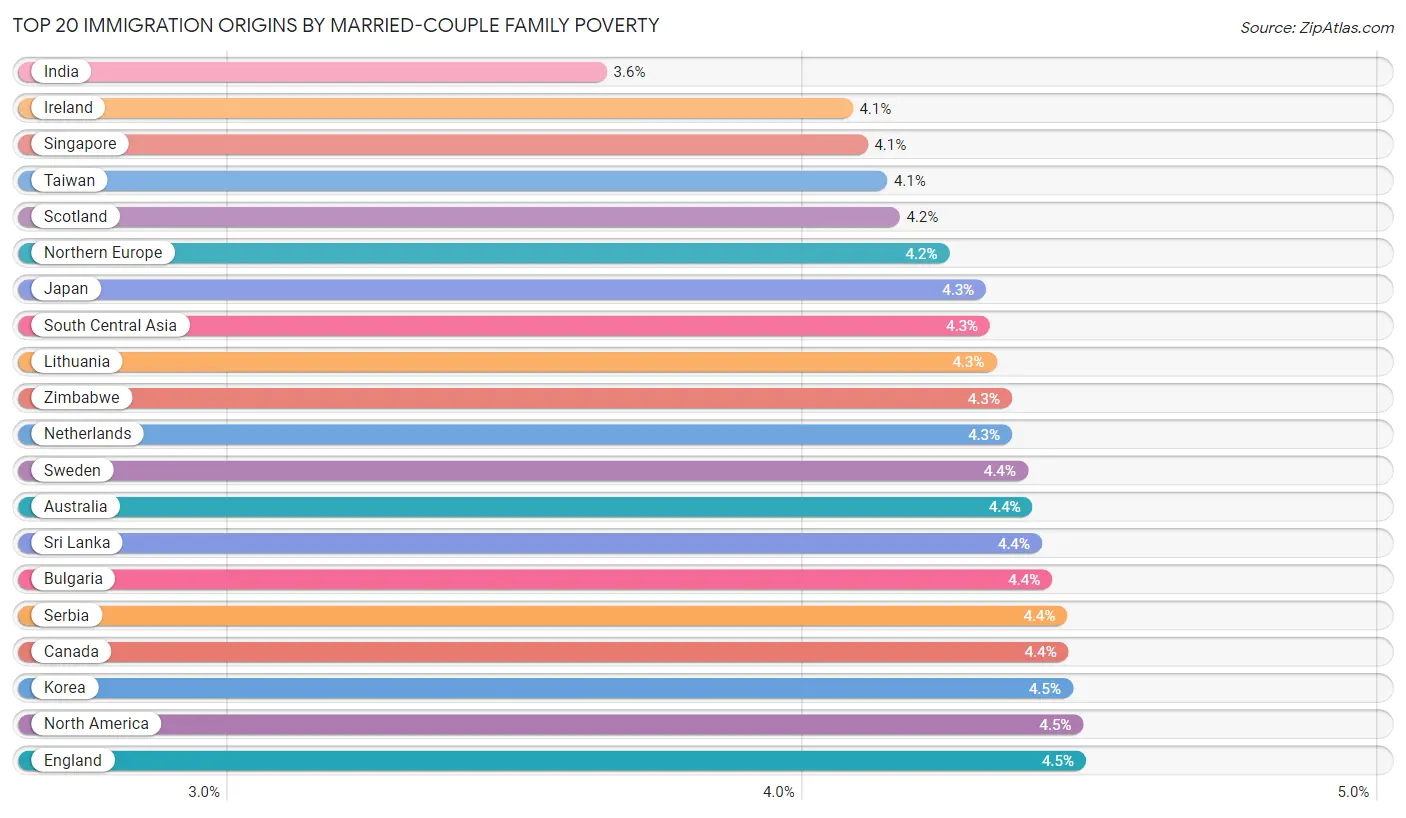
What are the top immigration origins in the United States with the lowest poverty level among married-couple families?
The top immigration origins in the United States with the lowest poverty level among married-couple families are:
#1
Immigrants from India
3.6%
(100.0/100)
#2
Immigrants from Ireland
4.1%
(99.9/100)
#3
Immigrants from Singapore
4.1%
(99.9/100)
#4
Immigrants from Taiwan
4.1%
(99.9/100)
#5
Immigrants from Scotland
4.2%
(99.9/100)
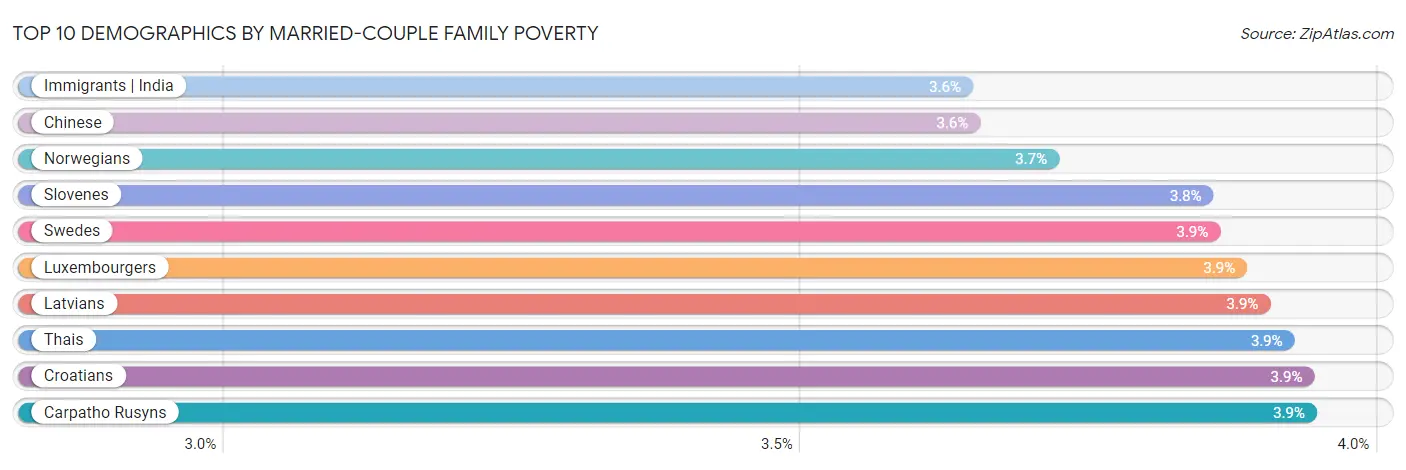
Top 10 Demographics by Married-Couple Family Poverty
The best off demographics with the lowest poverty level among married-couple families in the United States are Immigrants from India (3.6%, 100.0/100), Chinese (3.6%, 100.0/100), Norwegian (3.7%, 100.0/100), Slovene (3.8%, 100.0/100), and Swedish (3.9%, 100.0/100).
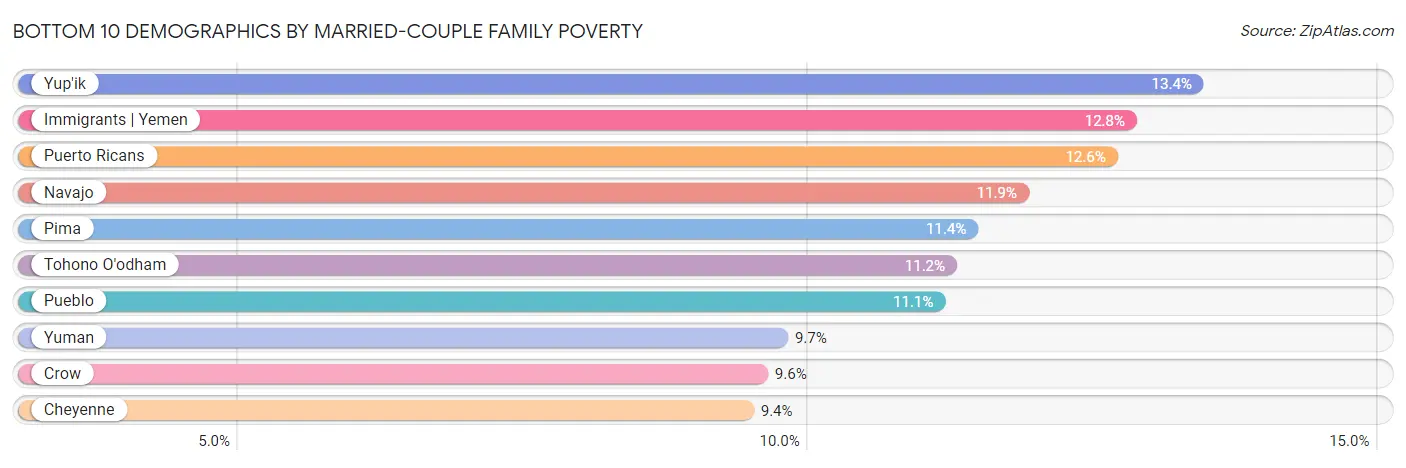
Bottom 10 Demographics by Married-Couple Family Poverty
The worst off demographics with the highest poverty level among married-couple families in the United States are Yup'ik (13.4%, 0.0/100), Immigrants from Yemen (12.8%, 0.0/100), Puerto Rican (12.6%, 0.0/100), Navajo (11.9%, 0.0/100), and Pima (11.4%, 0.0/100).
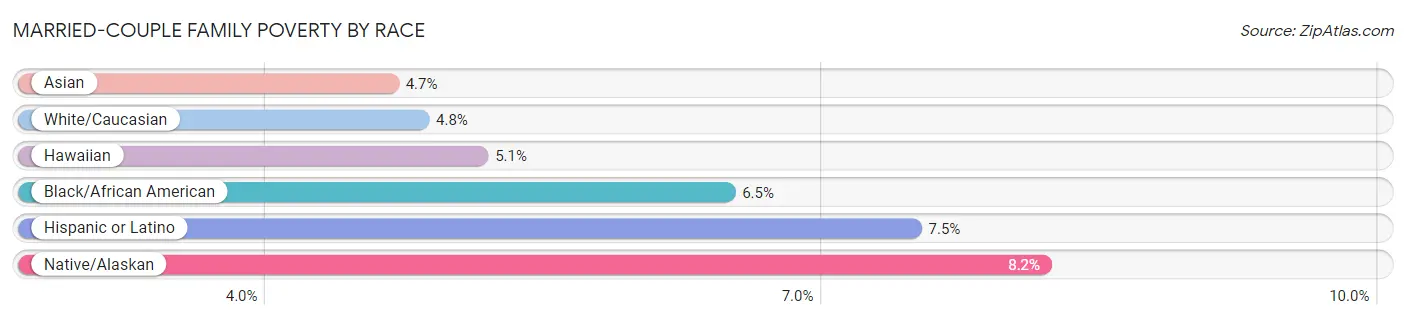
Married-Couple Family Poverty by Race
Top demographics by Married-Couple Family Poverty within the race category in the United States are Asians (4.7%, 97.6/100), Whites/Caucasians (4.8%, 93.1/100), and Hawaiians (5.1%, 62.3/100).
| Race | Rating | Rank | Married-Couple Family Poverty |
| Asian | 97.6 /100 | #102 | Exceptional 4.7% |
| Black/African American | 0.0 /100 | #285 | Tragic 6.5% |
| Hawaiian | 62.3 /100 | #164 | Good 5.1% |
| Hispanic or Latino | 0.0 /100 | #327 | Tragic 7.5% |
| Native/Alaskan | 0.0 /100 | #329 | Tragic 8.2% |
| White/Caucasian | 93.1 /100 | #122 | Exceptional 4.8% |
Married-Couple Family Poverty by Ancestry
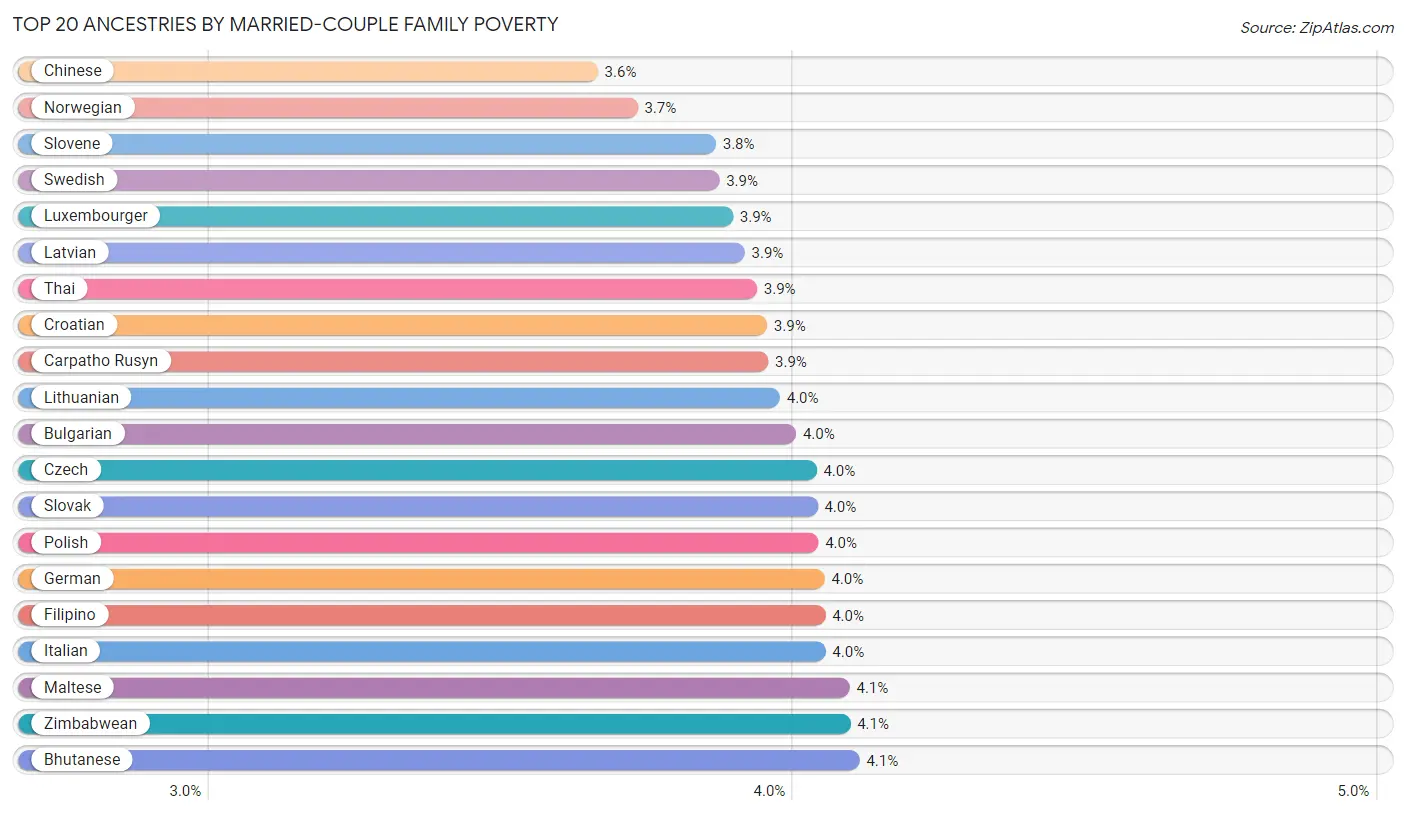
Top 20 Ancestries by Married-Couple Family Poverty
Top demographics by Married-Couple Family Poverty within the ancestry category in the United States are Chinese (3.6%, 100.0/100), Norwegians (3.7%, 100.0/100), Slovenes (3.8%, 100.0/100), Swedes (3.9%, 100.0/100), and Luxembourgers (3.9%, 100.0/100).
| Ancestry | Rating | Rank | Married-Couple Family Poverty |
| Afghan | 11.2 /100 | #218 | Poor 5.5% |
| African | 0.7 /100 | #253 | Tragic 6.0% |
| Alaska Native | 0.2 /100 | #268 | Tragic 6.2% |
| Alaskan Athabascan | 0.4 /100 | #259 | Tragic 6.1% |
| Albanian | 77.2 /100 | #152 | Good 5.0% |
| Aleut | 97.0 /100 | #105 | Exceptional 4.7% |
| Alsatian | 51.2 /100 | #173 | Average 5.2% |
| American | 35.4 /100 | #185 | Fair 5.3% |
| Apache | 0.0 /100 | #336 | Tragic 9.0% |
| Arab | 5.4 /100 | #228 | Tragic 5.7% |
| Arapaho | 0.0 /100 | #293 | Tragic 6.6% |
| Argentinean | 70.7 /100 | #157 | Good 5.1% |
| Armenian | 12.8 /100 | #215 | Poor 5.5% |
| Assyrian/Chaldean/Syriac | 89.4 /100 | #135 | Excellent 4.9% |
| Australian | 99.7 /100 | #48 | Exceptional 4.3% |
| Austrian | 99.7 /100 | #54 | Exceptional 4.3% |
| Bahamian | 0.0 /100 | #294 | Tragic 6.6% |
| Bangladeshi | 0.5 /100 | #256 | Tragic 6.0% |
| Barbadian | 0.1 /100 | #274 | Tragic 6.3% |
| Basque | 98.5 /100 | #91 | Exceptional 4.6% |
| Belgian | 99.9 /100 | #38 | Exceptional 4.2% |
| Belizean | 0.0 /100 | #291 | Tragic 6.5% |
| Bermudan | 52.9 /100 | #171 | Average 5.2% |
| Bhutanese | 99.9 /100 | #23 | Exceptional 4.1% |
| Blackfeet | 0.2 /100 | #265 | Tragic 6.2% |
| Bolivian | 98.6 /100 | #88 | Exceptional 4.6% |
| Brazilian | 78.3 /100 | #150 | Good 5.0% |
| British | 99.8 /100 | #46 | Exceptional 4.3% |
| British West Indian | 0.0 /100 | #314 | Tragic 7.1% |
| Bulgarian | 100.0 /100 | #12 | Exceptional 4.0% |
| Burmese | 99.7 /100 | #50 | Exceptional 4.3% |
| Cajun | 6.9 /100 | #222 | Tragic 5.6% |
| Cambodian | 99.2 /100 | #75 | Exceptional 4.5% |
| Canadian | 98.8 /100 | #82 | Exceptional 4.5% |
| Cape Verdean | 30.7 /100 | #192 | Fair 5.3% |
| Carpatho Rusyn | 100.0 /100 | #10 | Exceptional 3.9% |
| Celtic | 94.8 /100 | #116 | Exceptional 4.8% |
| Central American | 0.0 /100 | #301 | Tragic 6.7% |
| Central American Indian | 0.0 /100 | #331 | Tragic 8.3% |
| Cherokee | 2.7 /100 | #238 | Tragic 5.8% |
| Cheyenne | 0.0 /100 | #338 | Tragic 9.4% |
| Chickasaw | 2.3 /100 | #244 | Tragic 5.8% |
| Chilean | 86.0 /100 | #138 | Excellent 4.9% |
| Chinese | 100.0 /100 | #2 | Exceptional 3.6% |
| Chippewa | 18.9 /100 | #205 | Poor 5.4% |
| Choctaw | 0.1 /100 | #275 | Tragic 6.3% |
| Colombian | 9.2 /100 | #220 | Tragic 5.6% |
| Colville | 0.1 /100 | #273 | Tragic 6.3% |
| Comanche | 0.7 /100 | #255 | Tragic 6.0% |
| Costa Rican | 61.5 /100 | #167 | Good 5.1% |
| Cree | 1.2 /100 | #248 | Tragic 5.9% |
| Creek | 0.2 /100 | #266 | Tragic 6.2% |
| Croatian | 100.0 /100 | #9 | Exceptional 3.9% |
| Crow | 0.0 /100 | #339 | Tragic 9.6% |
| Cuban | 0.0 /100 | #304 | Tragic 6.8% |
| Cypriot | 99.9 /100 | #26 | Exceptional 4.1% |
| Czech | 100.0 /100 | #13 | Exceptional 4.0% |
| Czechoslovakian | 99.7 /100 | #58 | Exceptional 4.4% |
| Danish | 99.9 /100 | #27 | Exceptional 4.1% |
| Delaware | 73.7 /100 | #154 | Good 5.1% |
| Dominican | 0.0 /100 | #332 | Tragic 8.3% |
| Dutch | 99.9 /100 | #34 | Exceptional 4.2% |
| Dutch West Indian | 0.0 /100 | #284 | Tragic 6.4% |
| Eastern European | 99.9 /100 | #24 | Exceptional 4.1% |
| Ecuadorian | 0.0 /100 | #287 | Tragic 6.5% |
| Egyptian | 92.0 /100 | #127 | Exceptional 4.8% |
| English | 99.9 /100 | #36 | Exceptional 4.2% |
| Estonian | 99.9 /100 | #31 | Exceptional 4.2% |
| Ethiopian | 68.1 /100 | #161 | Good 5.1% |
| European | 99.9 /100 | #35 | Exceptional 4.2% |
| Fijian | 2.5 /100 | #240 | Tragic 5.8% |
| Filipino | 100.0 /100 | #17 | Exceptional 4.0% |
| Finnish | 99.9 /100 | #30 | Exceptional 4.2% |
| French | 99.7 /100 | #55 | Exceptional 4.3% |
| French American Indian | 16.1 /100 | #208 | Poor 5.5% |
| French Canadian | 99.8 /100 | #40 | Exceptional 4.2% |
| German | 100.0 /100 | #16 | Exceptional 4.0% |
| German Russian | 85.1 /100 | #139 | Excellent 5.0% |
| Ghanaian | 3.3 /100 | #236 | Tragic 5.7% |
| Greek | 99.9 /100 | #32 | Exceptional 4.2% |
| Guamanian/Chamorro | 86.5 /100 | #137 | Excellent 4.9% |
| Guatemalan | 0.0 /100 | #307 | Tragic 7.0% |
| Guyanese | 0.0 /100 | #286 | Tragic 6.5% |
| Haitian | 0.0 /100 | #305 | Tragic 6.8% |
| Hmong | 83.2 /100 | #144 | Excellent 5.0% |
| Honduran | 0.0 /100 | #316 | Tragic 7.2% |
| Hopi | 0.0 /100 | #309 | Tragic 7.1% |
| Houma | 0.0 /100 | #279 | Tragic 6.4% |
| Hungarian | 34.7 /100 | #186 | Fair 5.3% |
| Icelander | 99.0 /100 | #80 | Exceptional 4.5% |
| Indian (Asian) | 93.2 /100 | #121 | Exceptional 4.8% |
| Indonesian | 0.1 /100 | #277 | Tragic 6.3% |
| Inupiat | 0.0 /100 | #315 | Tragic 7.1% |
| Iranian | 99.9 /100 | #37 | Exceptional 4.2% |
| Iraqi | 1.4 /100 | #247 | Tragic 5.9% |
| Irish | 99.9 /100 | #33 | Exceptional 4.2% |
| Iroquois | 13.1 /100 | #214 | Poor 5.5% |
| Israeli | 33.1 /100 | #188 | Fair 5.3% |
| Italian | 100.0 /100 | #18 | Exceptional 4.0% |
| Jamaican | 0.3 /100 | #260 | Tragic 6.1% |
| Japanese | 9.8 /100 | #219 | Tragic 5.6% |
| Jordanian | 93.1 /100 | #123 | Exceptional 4.8% |
| Kenyan | 94.7 /100 | #117 | Exceptional 4.8% |
| Kiowa | 0.0 /100 | #297 | Tragic 6.6% |
| Korean | 98.3 /100 | #93 | Exceptional 4.6% |
| Laotian | 96.6 /100 | #108 | Exceptional 4.7% |
| Latvian | 100.0 /100 | #7 | Exceptional 3.9% |
| Lebanese | 24.1 /100 | #201 | Fair 5.4% |
| Liberian | 26.3 /100 | #197 | Fair 5.4% |
| Lithuanian | 100.0 /100 | #11 | Exceptional 4.0% |
| Lumbee | 0.0 /100 | #333 | Tragic 8.3% |
| Luxembourger | 100.0 /100 | #6 | Exceptional 3.9% |
| Macedonian | 99.4 /100 | #65 | Exceptional 4.4% |
| Malaysian | 29.5 /100 | #193 | Fair 5.4% |
| Maltese | 99.9 /100 | #20 | Exceptional 4.1% |
| Marshallese | 47.9 /100 | #175 | Average 5.2% |
| Menominee | 47.8 /100 | #176 | Average 5.2% |
| Mexican | 0.0 /100 | #317 | Tragic 7.2% |
| Mexican American Indian | 0.0 /100 | #281 | Tragic 6.4% |
| Mongolian | 79.8 /100 | #146 | Good 5.0% |
| Moroccan | 4.9 /100 | #230 | Tragic 5.7% |
| Native Hawaiian | 98.0 /100 | #98 | Exceptional 4.6% |
| Navajo | 0.0 /100 | #344 | Tragic 11.9% |
| Nepalese | 0.0 /100 | #289 | Tragic 6.5% |
| New Zealander | 99.4 /100 | #69 | Exceptional 4.4% |
| Nicaraguan | 0.0 /100 | #299 | Tragic 6.7% |
| Nigerian | 14.3 /100 | #211 | Poor 5.5% |
| Northern European | 99.8 /100 | #41 | Exceptional 4.3% |
| Norwegian | 100.0 /100 | #3 | Exceptional 3.7% |
| Okinawan | 99.6 /100 | #61 | Exceptional 4.4% |
| Osage | 18.4 /100 | #206 | Poor 5.4% |
| Ottawa | 54.5 /100 | #169 | Average 5.2% |
| Paiute | 0.0 /100 | #330 | Tragic 8.3% |
| Pakistani | 96.2 /100 | #111 | Exceptional 4.7% |
| Palestinian | 91.2 /100 | #128 | Exceptional 4.9% |
| Panamanian | 9.2 /100 | #221 | Tragic 5.6% |
| Paraguayan | 61.5 /100 | #166 | Good 5.1% |
| Pennsylvania German | 68.5 /100 | #160 | Good 5.1% |
| Peruvian | 37.6 /100 | #183 | Fair 5.3% |
| Pima | 0.0 /100 | #343 | Tragic 11.4% |
| Polish | 100.0 /100 | #15 | Exceptional 4.0% |
| Portuguese | 98.3 /100 | #95 | Exceptional 4.6% |
| Potawatomi | 12.4 /100 | #216 | Poor 5.5% |
| Pueblo | 0.0 /100 | #341 | Tragic 11.1% |
| Puerto Rican | 0.0 /100 | #345 | Tragic 12.6% |
| Puget Sound Salish | 90.4 /100 | #132 | Exceptional 4.9% |
| Romanian | 92.5 /100 | #124 | Exceptional 4.8% |
| Russian | 99.7 /100 | #52 | Exceptional 4.3% |
| Salvadoran | 0.0 /100 | #288 | Tragic 6.5% |
| Samoan | 90.2 /100 | #134 | Exceptional 4.9% |
| Scandinavian | 99.9 /100 | #28 | Exceptional 4.1% |
| Scotch-Irish | 99.1 /100 | #78 | Exceptional 4.5% |
| Scottish | 99.8 /100 | #42 | Exceptional 4.3% |
| Seminole | 0.0 /100 | #282 | Tragic 6.4% |
| Senegalese | 0.3 /100 | #261 | Tragic 6.1% |
| Serbian | 99.8 /100 | #45 | Exceptional 4.3% |
| Shoshone | 0.3 /100 | #262 | Tragic 6.1% |
| Sierra Leonean | 64.1 /100 | #163 | Good 5.1% |
| Sioux | 0.0 /100 | #335 | Tragic 8.7% |
| Slavic | 99.4 /100 | #68 | Exceptional 4.4% |
| Slovak | 100.0 /100 | #14 | Exceptional 4.0% |
| Slovene | 100.0 /100 | #4 | Exceptional 3.8% |
| Somali | 2.3 /100 | #243 | Tragic 5.8% |
| South African | 98.7 /100 | #85 | Exceptional 4.6% |
| South American | 5.7 /100 | #226 | Tragic 5.6% |
| South American Indian | 32.5 /100 | #189 | Fair 5.3% |
| Soviet Union | 90.7 /100 | #130 | Exceptional 4.9% |
| Spaniard | 27.4 /100 | #196 | Fair 5.4% |
| Spanish | 41.4 /100 | #179 | Average 5.3% |
| Spanish American | 0.2 /100 | #267 | Tragic 6.2% |
| Spanish American Indian | 0.0 /100 | #308 | Tragic 7.1% |
| Sri Lankan | 72.2 /100 | #156 | Good 5.1% |
| Subsaharan African | 4.9 /100 | #229 | Tragic 5.7% |
| Sudanese | 6.4 /100 | #224 | Tragic 5.6% |
| Swedish | 100.0 /100 | #5 | Exceptional 3.9% |
| Swiss | 99.8 /100 | #43 | Exceptional 4.3% |
| Syrian | 78.7 /100 | #147 | Good 5.0% |
| Taiwanese | 94.8 /100 | #115 | Exceptional 4.8% |
| Thai | 100.0 /100 | #8 | Exceptional 3.9% |
| Tlingit-Haida | 99.6 /100 | #60 | Exceptional 4.4% |
| Tohono O'Odham | 0.0 /100 | #342 | Tragic 11.2% |
| Tongan | 95.9 /100 | #112 | Exceptional 4.7% |
| Trinidadian and Tobagonian | 0.1 /100 | #272 | Tragic 6.2% |
| Tsimshian | 1.1 /100 | #249 | Tragic 5.9% |
| Turkish | 99.7 /100 | #49 | Exceptional 4.3% |
| U.S. Virgin Islander | 0.0 /100 | #296 | Tragic 6.6% |
| Ugandan | 31.6 /100 | #190 | Fair 5.3% |
| Ukrainian | 99.2 /100 | #73 | Exceptional 4.5% |
| Uruguayan | 25.0 /100 | #199 | Fair 5.4% |
| Ute | 0.0 /100 | #283 | Tragic 6.4% |
| Venezuelan | 2.7 /100 | #239 | Tragic 5.8% |
| Vietnamese | 0.0 /100 | #323 | Tragic 7.4% |
| Welsh | 99.7 /100 | #53 | Exceptional 4.3% |
| West Indian | 0.0 /100 | #280 | Tragic 6.4% |
| Yakama | 0.0 /100 | #337 | Tragic 9.0% |
| Yaqui | 0.1 /100 | #276 | Tragic 6.3% |
| Yugoslavian | 97.8 /100 | #101 | Exceptional 4.6% |
| Yuman | 0.0 /100 | #340 | Tragic 9.7% |
| Yup'ik | 0.0 /100 | #347 | Tragic 13.4% |
| Zimbabwean | 99.9 /100 | #21 | Exceptional 4.1% |
Married-Couple Family Poverty by Immigration
Top 20 Immigration Origins by Married-Couple Family Poverty
Top demographics by Married-Couple Family Poverty within the immigration category in the United States are Immigrants from India (3.6%, 100.0/100), Immigrants from Ireland (4.1%, 99.9/100), Immigrants from Singapore (4.1%, 99.9/100), Immigrants from Taiwan (4.1%, 99.9/100), and Immigrants from Scotland (4.2%, 99.9/100).
| Immigration | Rating | Rank | Married-Couple Family Poverty |
| Nonimmigrants | 35.8 /100 | #184 | Fair 5.3% |
| Immigrants | 0.5 /100 | #258 | Tragic 6.0% |
| Afghanistan | 2.1 /100 | #245 | Tragic 5.8% |
| Africa | 17.6 /100 | #207 | Poor 5.5% |
| Albania | 33.8 /100 | #187 | Fair 5.3% |
| Argentina | 54.4 /100 | #170 | Average 5.2% |
| Armenia | 0.0 /100 | #312 | Tragic 7.1% |
| Asia | 92.3 /100 | #126 | Exceptional 4.8% |
| Australia | 99.6 /100 | #62 | Exceptional 4.4% |
| Austria | 99.2 /100 | #74 | Exceptional 4.5% |
| Bahamas | 0.1 /100 | #271 | Tragic 6.2% |
| Bangladesh | 0.0 /100 | #326 | Tragic 7.5% |
| Barbados | 0.0 /100 | #290 | Tragic 6.5% |
| Belarus | 26.2 /100 | #198 | Fair 5.4% |
| Belgium | 98.2 /100 | #97 | Exceptional 4.6% |
| Belize | 0.0 /100 | #300 | Tragic 6.7% |
| Bolivia | 96.2 /100 | #110 | Exceptional 4.7% |
| Bosnia and Herzegovina | 92.5 /100 | #125 | Exceptional 4.8% |
| Brazil | 84.6 /100 | #141 | Excellent 5.0% |
| Bulgaria | 99.5 /100 | #64 | Exceptional 4.4% |
| Burma/Myanmar | 0.5 /100 | #257 | Tragic 6.0% |
| Cabo Verde | 30.9 /100 | #191 | Fair 5.3% |
| Cambodia | 6.1 /100 | #225 | Tragic 5.6% |
| Cameroon | 77.3 /100 | #151 | Good 5.0% |
| Canada | 99.4 /100 | #67 | Exceptional 4.4% |
| Caribbean | 0.0 /100 | #321 | Tragic 7.3% |
| Central America | 0.0 /100 | #324 | Tragic 7.4% |
| Chile | 38.8 /100 | #181 | Fair 5.3% |
| China | 84.6 /100 | #142 | Excellent 5.0% |
| Colombia | 3.7 /100 | #233 | Tragic 5.7% |
| Congo | 0.2 /100 | #264 | Tragic 6.1% |
| Costa Rica | 19.4 /100 | #204 | Poor 5.4% |
| Croatia | 98.7 /100 | #84 | Exceptional 4.6% |
| Cuba | 0.0 /100 | #325 | Tragic 7.5% |
| Czechoslovakia | 98.5 /100 | #89 | Exceptional 4.6% |
| Denmark | 98.8 /100 | #83 | Exceptional 4.6% |
| Dominica | 0.0 /100 | #311 | Tragic 7.1% |
| Dominican Republic | 0.0 /100 | #334 | Tragic 8.4% |
| Eastern Africa | 50.0 /100 | #174 | Average 5.2% |
| Eastern Asia | 94.0 /100 | #119 | Exceptional 4.8% |
| Eastern Europe | 90.5 /100 | #131 | Exceptional 4.9% |
| Ecuador | 0.0 /100 | #302 | Tragic 6.7% |
| Egypt | 83.4 /100 | #143 | Excellent 5.0% |
| El Salvador | 0.0 /100 | #303 | Tragic 6.8% |
| England | 99.3 /100 | #72 | Exceptional 4.5% |
| Eritrea | 1.1 /100 | #250 | Tragic 5.9% |
| Ethiopia | 72.4 /100 | #155 | Good 5.1% |
| Europe | 97.9 /100 | #99 | Exceptional 4.6% |
| Fiji | 6.7 /100 | #223 | Tragic 5.6% |
| France | 96.9 /100 | #106 | Exceptional 4.7% |
| Germany | 96.8 /100 | #107 | Exceptional 4.7% |
| Ghana | 1.0 /100 | #251 | Tragic 5.9% |
| Greece | 98.9 /100 | #81 | Exceptional 4.5% |
| Grenada | 0.0 /100 | #320 | Tragic 7.3% |
| Guatemala | 0.0 /100 | #318 | Tragic 7.2% |
| Guyana | 0.0 /100 | #298 | Tragic 6.7% |
| Haiti | 0.0 /100 | #306 | Tragic 7.0% |
| Honduras | 0.0 /100 | #322 | Tragic 7.3% |
| Hong Kong | 96.4 /100 | #109 | Exceptional 4.7% |
| Hungary | 88.7 /100 | #136 | Excellent 4.9% |
| India | 100.0 /100 | #1 | Exceptional 3.6% |
| Indonesia | 95.1 /100 | #114 | Exceptional 4.8% |
| Iran | 99.0 /100 | #79 | Exceptional 4.5% |
| Iraq | 4.4 /100 | #231 | Tragic 5.7% |
| Ireland | 99.9 /100 | #19 | Exceptional 4.1% |
| Israel | 27.8 /100 | #194 | Fair 5.4% |
| Italy | 98.3 /100 | #94 | Exceptional 4.6% |
| Jamaica | 0.1 /100 | #270 | Tragic 6.2% |
| Japan | 99.8 /100 | #44 | Exceptional 4.3% |
| Jordan | 66.5 /100 | #162 | Good 5.1% |
| Kazakhstan | 45.1 /100 | #177 | Average 5.2% |
| Kenya | 90.2 /100 | #133 | Exceptional 4.9% |
| Korea | 99.4 /100 | #70 | Exceptional 4.5% |
| Kuwait | 76.3 /100 | #153 | Good 5.0% |
| Laos | 4.4 /100 | #232 | Tragic 5.7% |
| Latin America | 0.0 /100 | #319 | Tragic 7.2% |
| Latvia | 99.1 /100 | #77 | Exceptional 4.5% |
| Lebanon | 0.0 /100 | #292 | Tragic 6.6% |
| Liberia | 13.3 /100 | #213 | Poor 5.5% |
| Lithuania | 99.7 /100 | #51 | Exceptional 4.3% |
| Malaysia | 62.2 /100 | #165 | Good 5.1% |
| Mexico | 0.0 /100 | #328 | Tragic 7.6% |
| Micronesia | 14.4 /100 | #210 | Poor 5.5% |
| Middle Africa | 23.8 /100 | #202 | Fair 5.4% |
| Moldova | 97.1 /100 | #104 | Exceptional 4.7% |
| Morocco | 24.3 /100 | #200 | Fair 5.4% |
| Nepal | 95.9 /100 | #113 | Exceptional 4.7% |
| Netherlands | 99.7 /100 | #57 | Exceptional 4.3% |
| Nicaragua | 0.0 /100 | #310 | Tragic 7.1% |
| Nigeria | 11.3 /100 | #217 | Poor 5.5% |
| North America | 99.3 /100 | #71 | Exceptional 4.5% |
| North Macedonia | 98.6 /100 | #87 | Exceptional 4.6% |
| Northern Africa | 51.3 /100 | #172 | Average 5.2% |
| Northern Europe | 99.8 /100 | #39 | Exceptional 4.2% |
| Norway | 98.4 /100 | #92 | Exceptional 4.6% |
| Oceania | 78.6 /100 | #149 | Good 5.0% |
| Pakistan | 90.7 /100 | #129 | Exceptional 4.9% |
| Panama | 2.5 /100 | #241 | Tragic 5.8% |
| Peru | 21.8 /100 | #203 | Fair 5.4% |
| Philippines | 94.6 /100 | #118 | Exceptional 4.8% |
| Poland | 98.3 /100 | #96 | Exceptional 4.6% |
| Portugal | 84.8 /100 | #140 | Excellent 5.0% |
| Romania | 97.3 /100 | #103 | Exceptional 4.7% |
| Russia | 78.7 /100 | #148 | Good 5.0% |
| Saudi Arabia | 70.3 /100 | #159 | Good 5.1% |
| Scotland | 99.9 /100 | #29 | Exceptional 4.2% |
| Senegal | 0.3 /100 | #263 | Tragic 6.1% |
| Serbia | 99.4 /100 | #66 | Exceptional 4.4% |
| Sierra Leone | 39.3 /100 | #180 | Fair 5.3% |
| Singapore | 99.9 /100 | #22 | Exceptional 4.1% |
| Somalia | 0.7 /100 | #254 | Tragic 6.0% |
| South Africa | 99.1 /100 | #76 | Exceptional 4.5% |
| South America | 3.1 /100 | #237 | Tragic 5.7% |
| South Central Asia | 99.8 /100 | #47 | Exceptional 4.3% |
| South Eastern Asia | 70.4 /100 | #158 | Good 5.1% |
| Southern Europe | 93.4 /100 | #120 | Exceptional 4.8% |
| Spain | 79.9 /100 | #145 | Good 5.0% |
| Sri Lanka | 99.6 /100 | #63 | Exceptional 4.4% |
| St. Vincent and the Grenadines | 0.0 /100 | #313 | Tragic 7.1% |
| Sudan | 3.5 /100 | #235 | Tragic 5.7% |
| Sweden | 99.6 /100 | #59 | Exceptional 4.4% |
| Switzerland | 98.5 /100 | #90 | Exceptional 4.6% |
| Syria | 15.4 /100 | #209 | Poor 5.5% |
| Taiwan | 99.9 /100 | #25 | Exceptional 4.1% |
| Thailand | 14.0 /100 | #212 | Poor 5.5% |
| Trinidad and Tobago | 0.1 /100 | #278 | Tragic 6.4% |
| Turkey | 98.6 /100 | #86 | Exceptional 4.6% |
| Uganda | 54.9 /100 | #168 | Average 5.2% |
| Ukraine | 44.9 /100 | #178 | Average 5.2% |
| Uruguay | 3.7 /100 | #234 | Tragic 5.7% |
| Uzbekistan | 0.0 /100 | #295 | Tragic 6.6% |
| Venezuela | 1.8 /100 | #246 | Tragic 5.8% |
| Vietnam | 37.7 /100 | #182 | Fair 5.3% |
| West Indies | 0.1 /100 | #269 | Tragic 6.2% |
| Western Africa | 2.4 /100 | #242 | Tragic 5.8% |
| Western Asia | 0.7 /100 | #252 | Tragic 6.0% |
| Western Europe | 97.9 /100 | #100 | Exceptional 4.6% |
| Yemen | 0.0 /100 | #346 | Tragic 12.8% |
| Zaire | 5.6 /100 | #227 | Tragic 5.6% |
| Zimbabwe | 99.7 /100 | #56 | Exceptional 4.3% |
| Azores | 27.5 /100 | #195 | Fair 5.4% |