Bend, CA Map & Demographics
Bend Map
Bend Overview
$50,562
PER CAPITA INCOME
0.44
INEQUALITY / GINI INDEX
414
TOTAL POPULATION
151
MALE POPULATION
263
FEMALE POPULATION
57.41
MALES / 100 FEMALES
174.17
FEMALES / 100 MALES
61.7
MEDIAN AGE
2.9
AVG FAMILY SIZE
2.5
AVG HOUSEHOLD SIZE
172
LABOR FORCE [ PEOPLE ]
41.5%
PERCENT IN LABOR FORCE
Income in Bend
Income Overview in Bend
| Characteristic | Number | Measure |
| Per Capita Income | 414 | $50,562 |
| Median Family Income | 133 | $0 |
| Mean Family Income | 133 | $148,758 |
| Median Household Income | 166 | $0 |
| Mean Household Income | 166 | $126,094 |
| Income Deficit | 133 | $0 |
| Wage / Income Gap (%) | 414 | 0.00% |
| Wage / Income Gap ($) | 414 | 100.00¢ per $1 |
| Gini / Inequality Index | 414 | 0.44 |
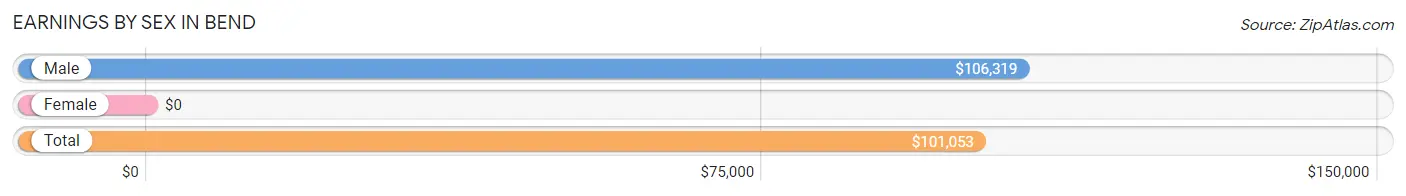
Earnings by Sex in Bend
| Sex | Number | Average Earnings |
| Male | 90 (52.3%) | $106,319 |
| Female | 82 (47.7%) | $0 |
| Total | 172 (100.0%) | $101,053 |
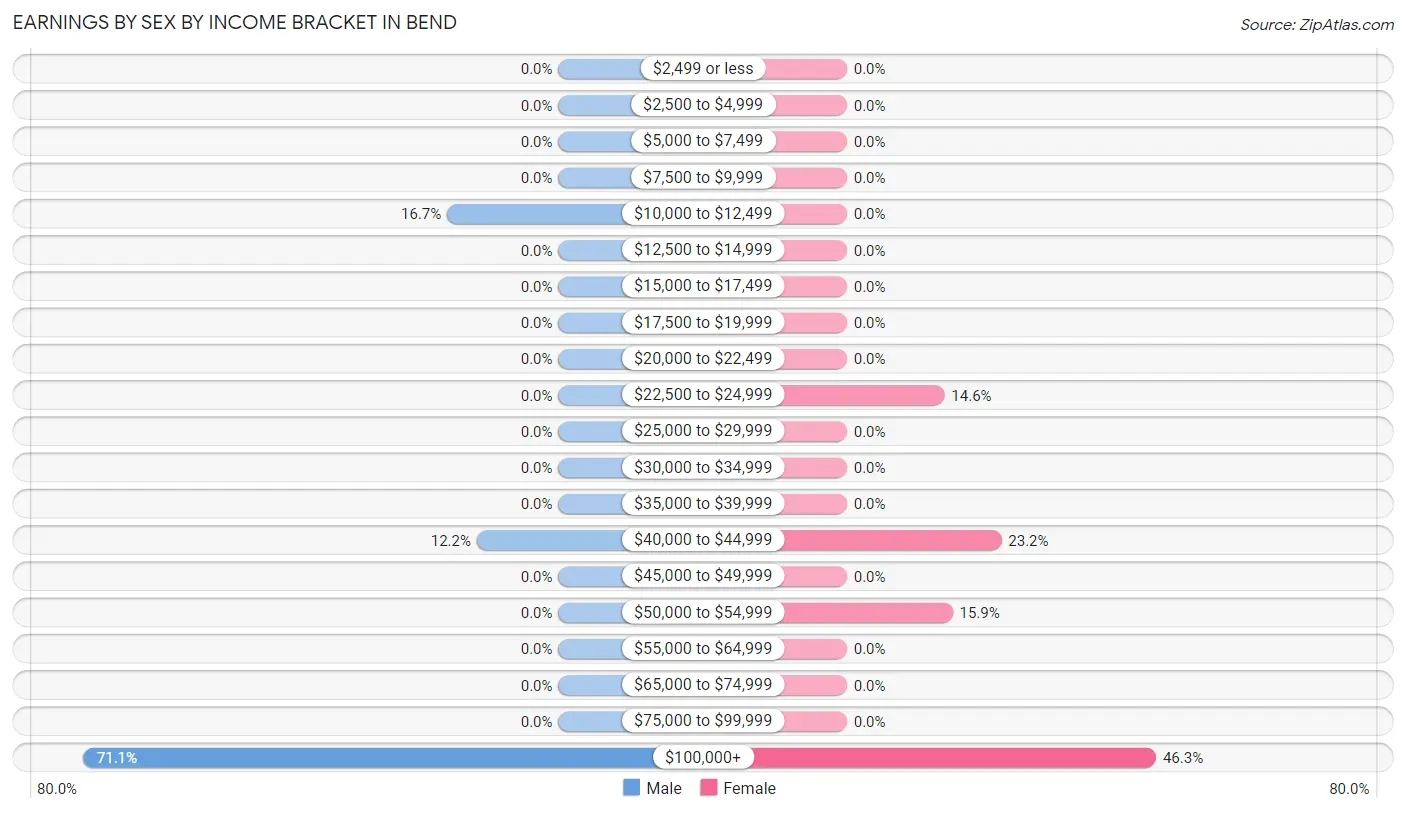
Earnings by Sex by Income Bracket in Bend
The most common earnings brackets in Bend are $100,000+ for men (64 | 71.1%) and $100,000+ for women (38 | 46.3%).
| Income | Male | Female |
| $2,499 or less | 0 (0.0%) | 0 (0.0%) |
| $2,500 to $4,999 | 0 (0.0%) | 0 (0.0%) |
| $5,000 to $7,499 | 0 (0.0%) | 0 (0.0%) |
| $7,500 to $9,999 | 0 (0.0%) | 0 (0.0%) |
| $10,000 to $12,499 | 15 (16.7%) | 0 (0.0%) |
| $12,500 to $14,999 | 0 (0.0%) | 0 (0.0%) |
| $15,000 to $17,499 | 0 (0.0%) | 0 (0.0%) |
| $17,500 to $19,999 | 0 (0.0%) | 0 (0.0%) |
| $20,000 to $22,499 | 0 (0.0%) | 0 (0.0%) |
| $22,500 to $24,999 | 0 (0.0%) | 12 (14.6%) |
| $25,000 to $29,999 | 0 (0.0%) | 0 (0.0%) |
| $30,000 to $34,999 | 0 (0.0%) | 0 (0.0%) |
| $35,000 to $39,999 | 0 (0.0%) | 0 (0.0%) |
| $40,000 to $44,999 | 11 (12.2%) | 19 (23.2%) |
| $45,000 to $49,999 | 0 (0.0%) | 0 (0.0%) |
| $50,000 to $54,999 | 0 (0.0%) | 13 (15.9%) |
| $55,000 to $64,999 | 0 (0.0%) | 0 (0.0%) |
| $65,000 to $74,999 | 0 (0.0%) | 0 (0.0%) |
| $75,000 to $99,999 | 0 (0.0%) | 0 (0.0%) |
| $100,000+ | 64 (71.1%) | 38 (46.3%) |
| Total | 90 (100.0%) | 82 (100.0%) |
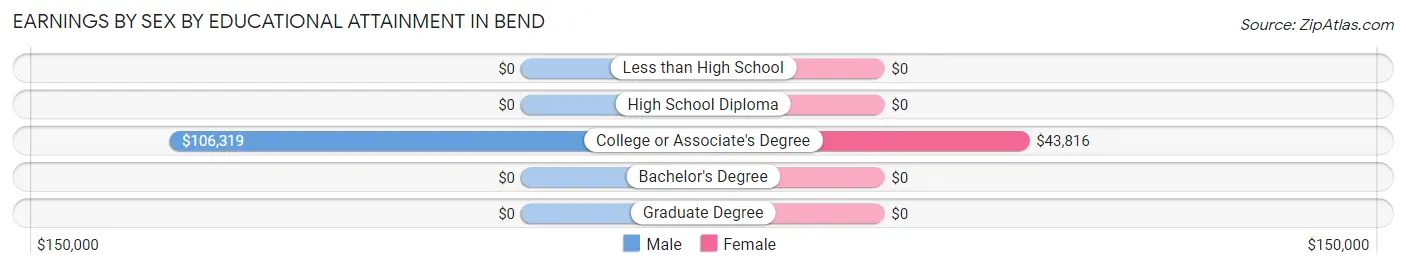
Earnings by Sex by Educational Attainment in Bend
| Educational Attainment | Male Income | Female Income |
| Less than High School | - | - |
| High School Diploma | - | - |
| College or Associate's Degree | $106,319 | $43,816 |
| Bachelor's Degree | - | - |
| Graduate Degree | - | - |
| Total | $106,632 | $0 |
Family Income in Bend
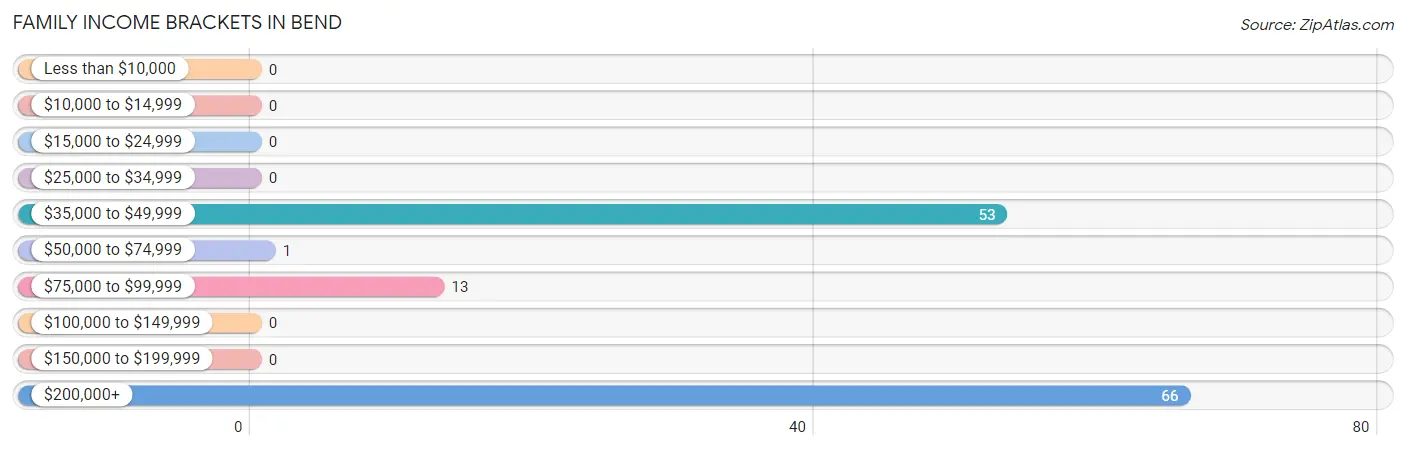
Family Income Brackets in Bend
According to the Bend family income data, there are 66 families falling into the $200,000+ income range, which is the most common income bracket and makes up 49.6% of all families.
| Income Bracket | # Families | % Families |
| Less than $10,000 | 0 | 0.0% |
| $10,000 to $14,999 | 0 | 0.0% |
| $15,000 to $24,999 | 0 | 0.0% |
| $25,000 to $34,999 | 0 | 0.0% |
| $35,000 to $49,999 | 53 | 39.8% |
| $50,000 to $74,999 | 1 | 0.8% |
| $75,000 to $99,999 | 13 | 9.8% |
| $100,000 to $149,999 | 0 | 0.0% |
| $150,000 to $199,999 | 0 | 0.0% |
| $200,000+ | 66 | 49.6% |
Family Income by Famaliy Size in Bend
| Income Bracket | # Families | Median Income |
| 2-Person Families | 77 (57.9%) | $0 |
| 3-Person Families | 39 (29.3%) | $0 |
| 4-Person Families | 0 (0.0%) | $0 |
| 5-Person Families | 0 (0.0%) | $0 |
| 6-Person Families | 17 (12.8%) | $0 |
| 7+ Person Families | 0 (0.0%) | $0 |
| Total | 133 (100.0%) | $0 |
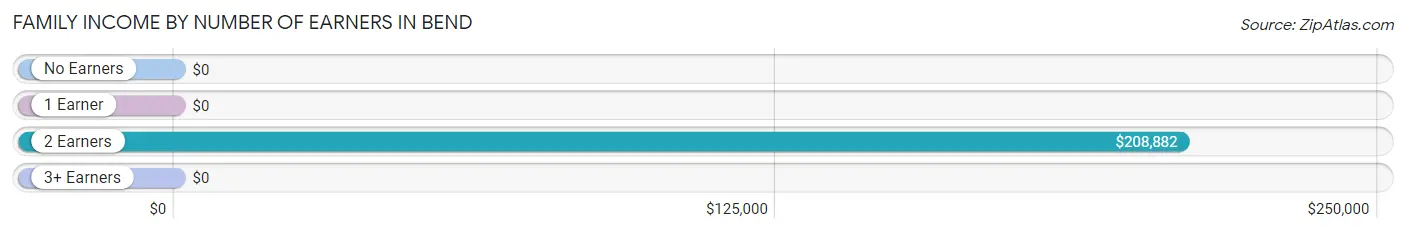
Family Income by Number of Earners in Bend
| Number of Earners | # Families | Median Income |
| No Earners | 41 (30.8%) | $0 |
| 1 Earner | 24 (18.0%) | $0 |
| 2 Earners | 68 (51.1%) | $208,882 |
| 3+ Earners | 0 (0.0%) | $0 |
| Total | 133 (100.0%) | $0 |
Household Income in Bend
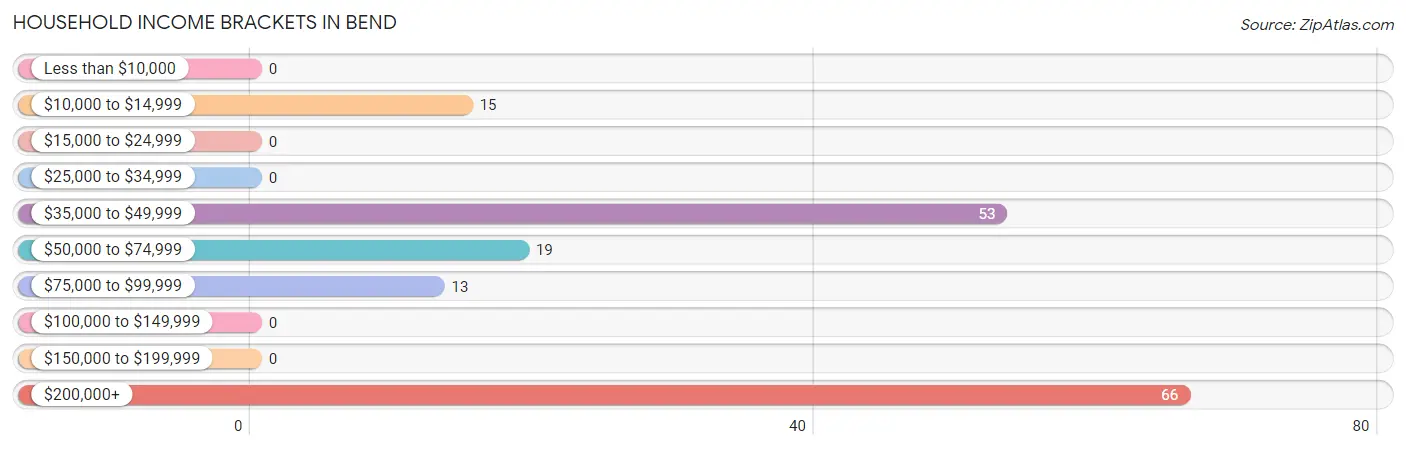
Household Income Brackets in Bend
With 66 households falling in the category, the $200,000+ income range is the most frequent in Bend, accounting for 39.8% of all households.
| Income Bracket | # Households | % Households |
| Less than $10,000 | 0 | 0.0% |
| $10,000 to $14,999 | 15 | 9.0% |
| $15,000 to $24,999 | 0 | 0.0% |
| $25,000 to $34,999 | 0 | 0.0% |
| $35,000 to $49,999 | 53 | 31.9% |
| $50,000 to $74,999 | 19 | 11.4% |
| $75,000 to $99,999 | 13 | 7.8% |
| $100,000 to $149,999 | 0 | 0.0% |
| $150,000 to $199,999 | 0 | 0.0% |
| $200,000+ | 66 | 39.8% |
Household Income by Householder Age in Bend
The median household income in Bend is $0, with the highest median household income of $44,922 found in the 65+ years age bracket for the primary householder. A total of 61 households (36.7%) fall into this category.
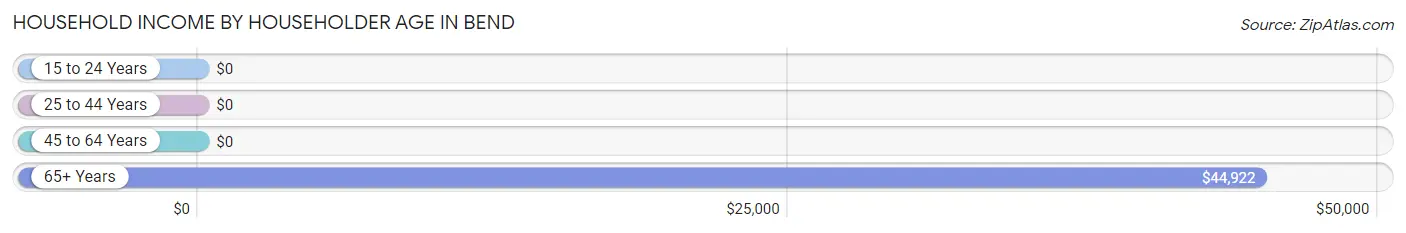
| Income Bracket | # Households | Median Income |
| 15 to 24 Years | 0 (0.0%) | $0 |
| 25 to 44 Years | 0 (0.0%) | $0 |
| 45 to 64 Years | 105 (63.2%) | $0 |
| 65+ Years | 61 (36.7%) | $44,922 |
| Total | 166 (100.0%) | $0 |
Poverty in Bend
Income Below Poverty by Sex and Age in Bend
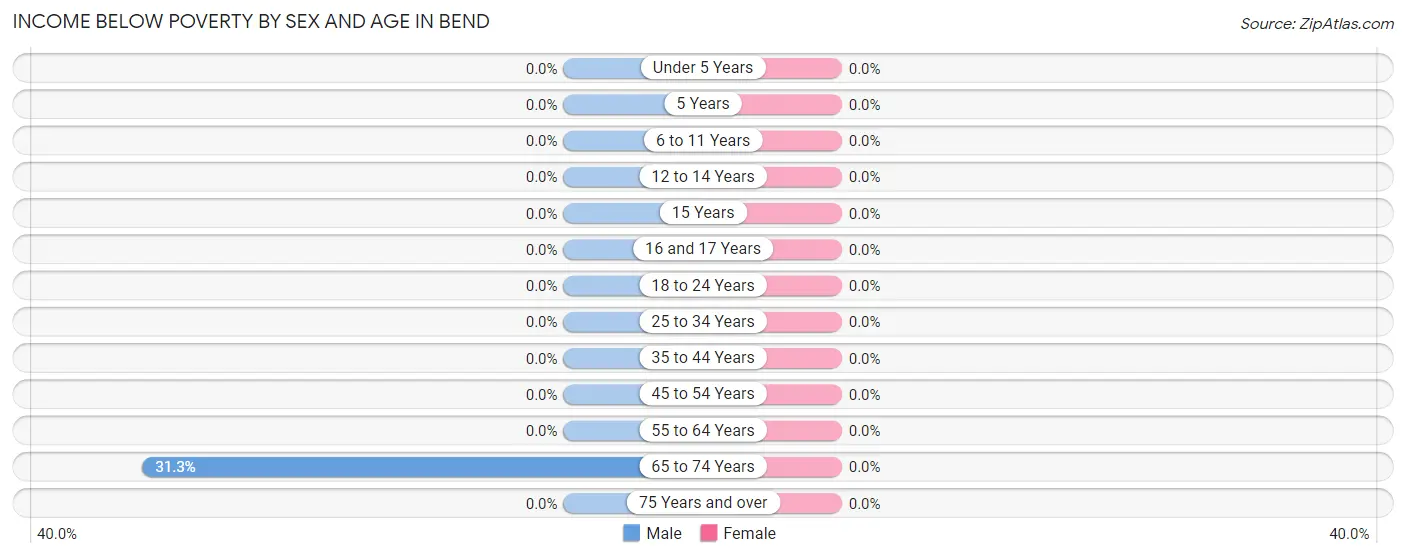
| Age Bracket | Male | Female |
| Under 5 Years | 0 (0.0%) | 0 (0.0%) |
| 5 Years | 0 (0.0%) | 0 (0.0%) |
| 6 to 11 Years | 0 (0.0%) | 0 (0.0%) |
| 12 to 14 Years | 0 (0.0%) | 0 (0.0%) |
| 15 Years | 0 (0.0%) | 0 (0.0%) |
| 16 and 17 Years | 0 (0.0%) | 0 (0.0%) |
| 18 to 24 Years | 0 (0.0%) | 0 (0.0%) |
| 25 to 34 Years | 0 (0.0%) | 0 (0.0%) |
| 35 to 44 Years | 0 (0.0%) | 0 (0.0%) |
| 45 to 54 Years | 0 (0.0%) | 0 (0.0%) |
| 55 to 64 Years | 0 (0.0%) | 0 (0.0%) |
| 65 to 74 Years | 15 (31.2%) | 0 (0.0%) |
| 75 Years and over | 0 (0.0%) | 0 (0.0%) |
| Total | 15 (9.9%) | 0 (0.0%) |
Income Above Poverty by Sex and Age in Bend
According to the poverty statistics in Bend, males aged 16 and 17 years and females aged 16 and 17 years are the age groups that are most secure financially, with 100.0% of males and 100.0% of females in these age groups living above the poverty line.
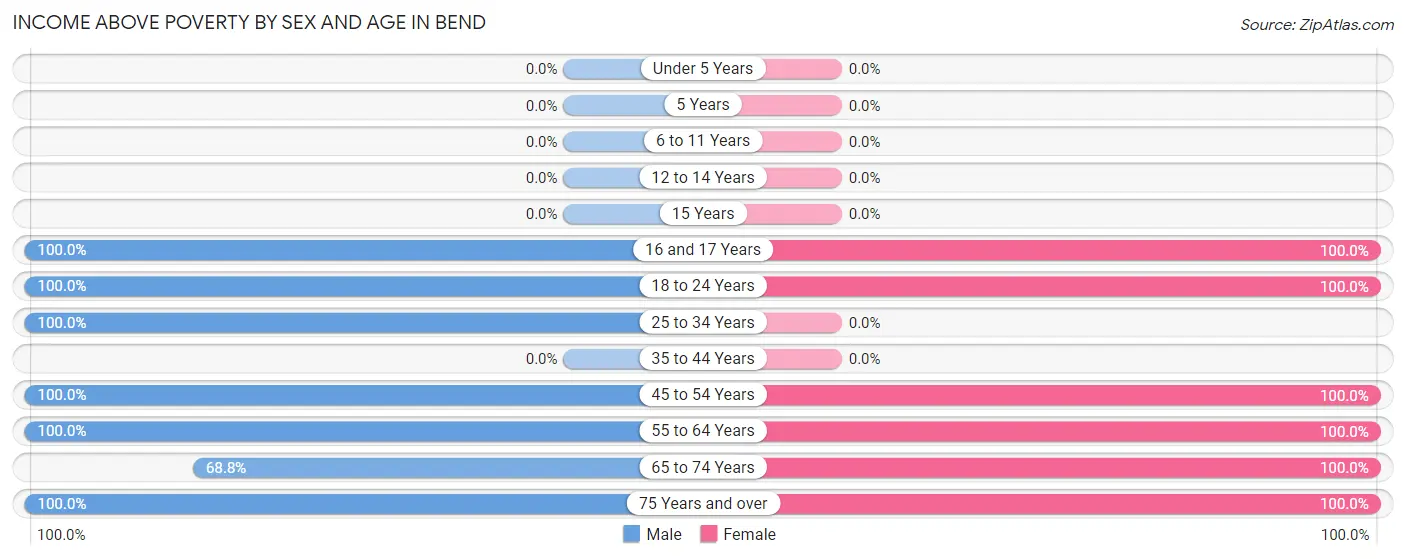
| Age Bracket | Male | Female |
| Under 5 Years | 0 (0.0%) | 0 (0.0%) |
| 5 Years | 0 (0.0%) | 0 (0.0%) |
| 6 to 11 Years | 0 (0.0%) | 0 (0.0%) |
| 12 to 14 Years | 0 (0.0%) | 0 (0.0%) |
| 15 Years | 0 (0.0%) | 0 (0.0%) |
| 16 and 17 Years | 9 (100.0%) | 10 (100.0%) |
| 18 to 24 Years | 14 (100.0%) | 49 (100.0%) |
| 25 to 34 Years | 12 (100.0%) | 0 (0.0%) |
| 35 to 44 Years | 0 (0.0%) | 0 (0.0%) |
| 45 to 54 Years | 2 (100.0%) | 38 (100.0%) |
| 55 to 64 Years | 53 (100.0%) | 83 (100.0%) |
| 65 to 74 Years | 33 (68.8%) | 2 (100.0%) |
| 75 Years and over | 13 (100.0%) | 81 (100.0%) |
| Total | 136 (90.1%) | 263 (100.0%) |
Income Below Poverty Among Married-Couple Families in Bend
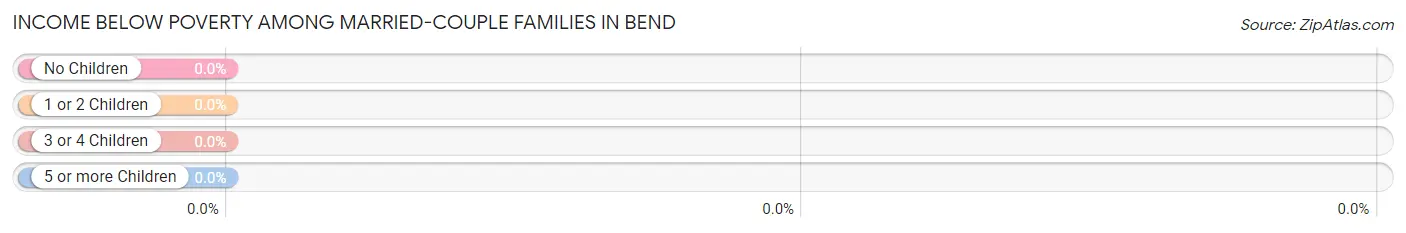
| Children | Above Poverty | Below Poverty |
| No Children | 91 (100.0%) | 0 (0.0%) |
| 1 or 2 Children | 17 (100.0%) | 0 (0.0%) |
| 3 or 4 Children | 0 (0.0%) | 0 (0.0%) |
| 5 or more Children | 0 (0.0%) | 0 (0.0%) |
| Total | 108 (100.0%) | 0 (0.0%) |
Income Below Poverty Among Single-Parent Households in Bend
| Children | Single Father | Single Mother |
| No Children | 0 (0.0%) | 0 (0.0%) |
| 1 or 2 Children | 0 (0.0%) | 0 (0.0%) |
| 3 or 4 Children | 0 (0.0%) | 0 (0.0%) |
| 5 or more Children | 0 (0.0%) | 0 (0.0%) |
| Total | 0 (0.0%) | 0 (0.0%) |
Income Below Poverty Among Married-Couple vs Single-Parent Households in Bend
| Children | Married-Couple Families | Single-Parent Households |
| No Children | 0 (0.0%) | 0 (0.0%) |
| 1 or 2 Children | 0 (0.0%) | 0 (0.0%) |
| 3 or 4 Children | 0 (0.0%) | 0 (0.0%) |
| 5 or more Children | 0 (0.0%) | 0 (0.0%) |
| Total | 0 (0.0%) | 0 (0.0%) |
Race in Bend
The most populous races in Bend are White / Caucasian (310 | 74.9%), Two or more Races (62 | 15.0%), and Asian (38 | 9.2%).
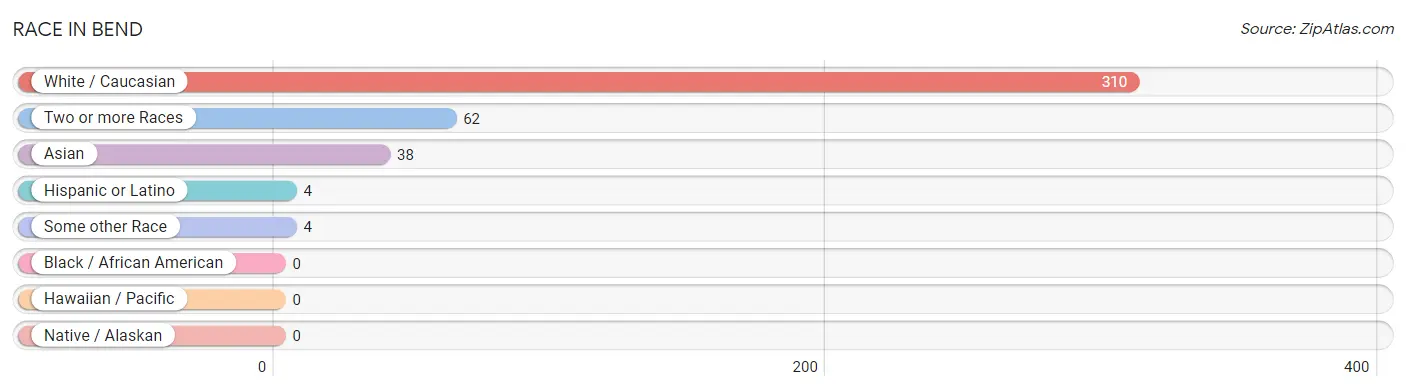
| Race | # Population | % Population |
| Asian | 38 | 9.2% |
| Black / African American | 0 | 0.0% |
| Hawaiian / Pacific | 0 | 0.0% |
| Hispanic or Latino | 4 | 1.0% |
| Native / Alaskan | 0 | 0.0% |
| White / Caucasian | 310 | 74.9% |
| Two or more Races | 62 | 15.0% |
| Some other Race | 4 | 1.0% |
| Total | 414 | 100.0% |
Ancestry in Bend
The most populous ancestries reported in Bend are German (90 | 21.7%), English (89 | 21.5%), Irish (78 | 18.8%), Indian (Asian) (62 | 15.0%), and Korean (62 | 15.0%), together accounting for 92.0% of all Bend residents.
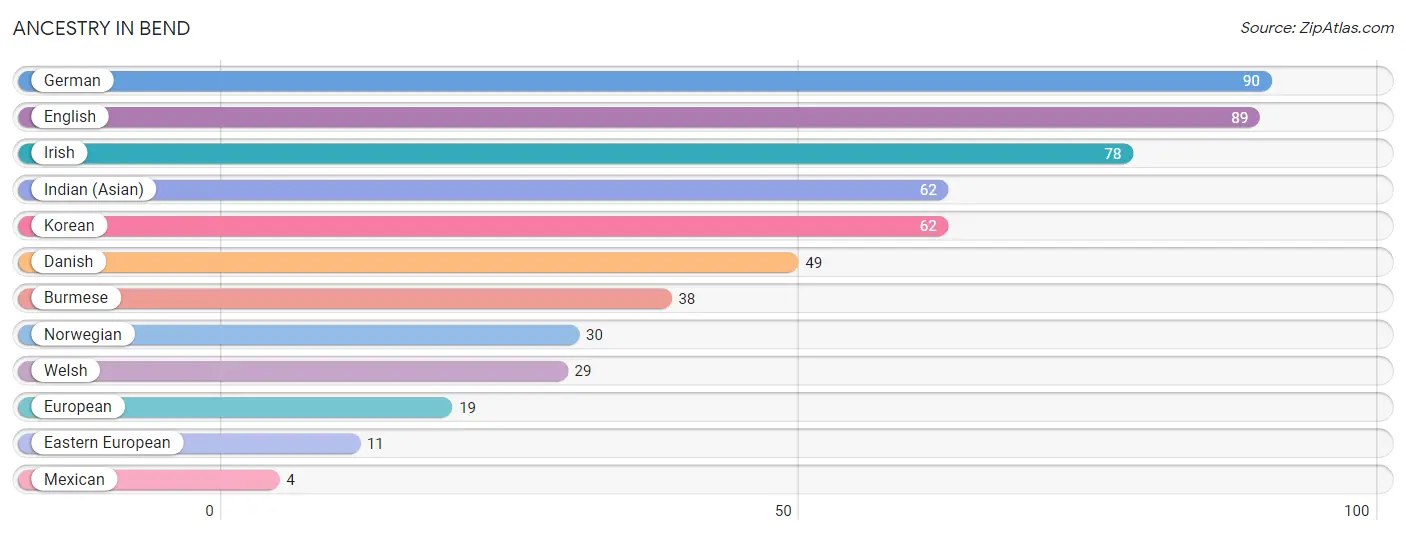
| Ancestry | # Population | % Population |
| Burmese | 38 | 9.2% |
| Danish | 49 | 11.8% |
| Eastern European | 11 | 2.7% |
| English | 89 | 21.5% |
| European | 19 | 4.6% |
| German | 90 | 21.7% |
| Indian (Asian) | 62 | 15.0% |
| Irish | 78 | 18.8% |
| Korean | 62 | 15.0% |
| Mexican | 4 | 1.0% |
| Norwegian | 30 | 7.2% |
| Welsh | 29 | 7.0% | View All 12 Rows |
Immigrants in Bend
The most numerous immigrant groups reported in Bend came from Asia (38 | 9.2%), Eastern Asia (38 | 9.2%), and Korea (38 | 9.2%), together accounting for 27.5% of all Bend residents.
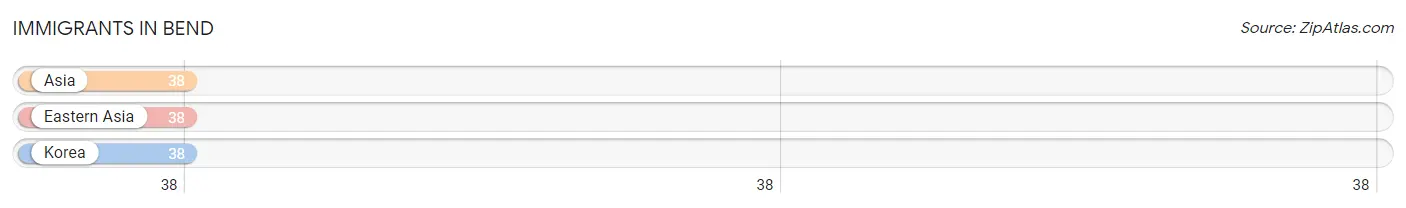
| Immigration Origin | # Population | % Population |
| Asia | 38 | 9.2% |
| Eastern Asia | 38 | 9.2% |
| Korea | 38 | 9.2% | View All 3 Rows |
Sex and Age in Bend
Sex and Age in Bend
The most populous age groups in Bend are 65 to 69 Years (47 | 31.1%) for men and 75 to 79 Years (63 | 23.9%) for women.
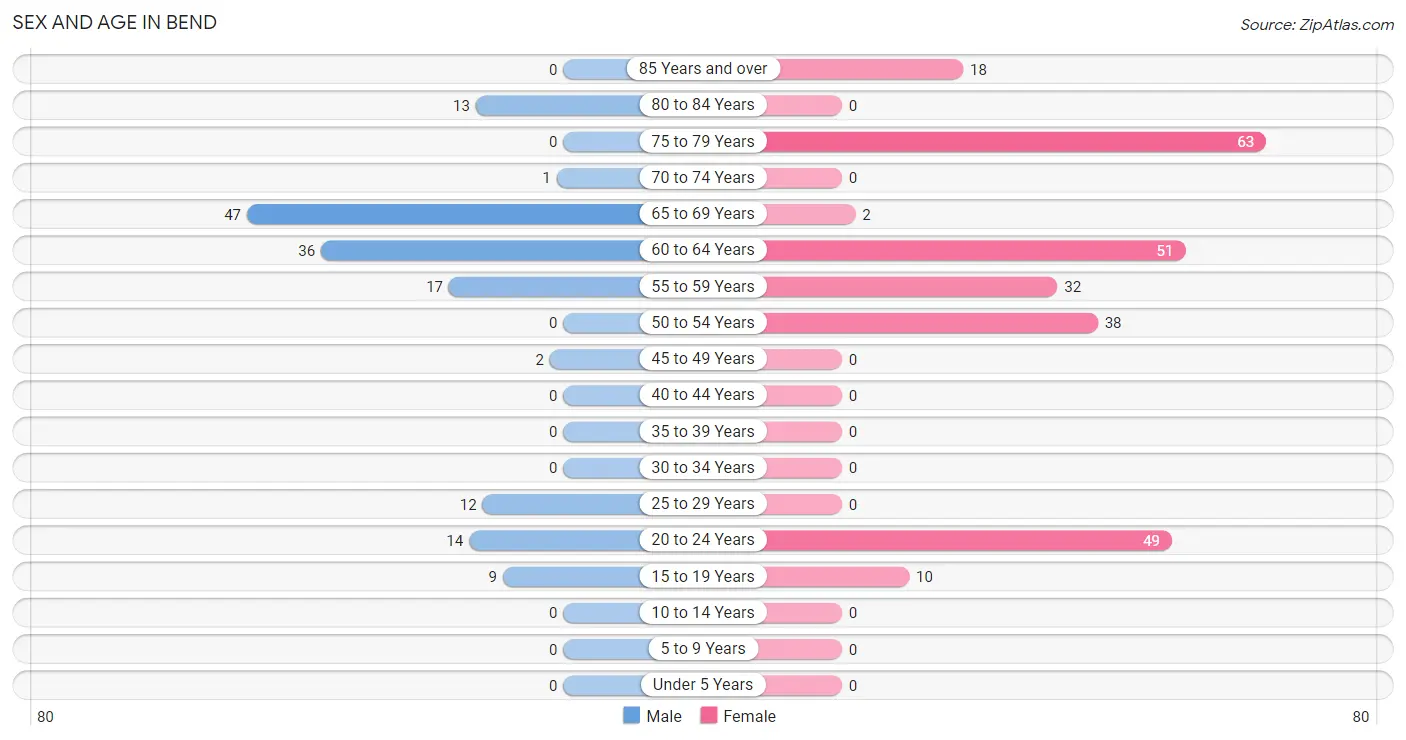
| Age Bracket | Male | Female |
| Under 5 Years | 0 (0.0%) | 0 (0.0%) |
| 5 to 9 Years | 0 (0.0%) | 0 (0.0%) |
| 10 to 14 Years | 0 (0.0%) | 0 (0.0%) |
| 15 to 19 Years | 9 (6.0%) | 10 (3.8%) |
| 20 to 24 Years | 14 (9.3%) | 49 (18.6%) |
| 25 to 29 Years | 12 (8.0%) | 0 (0.0%) |
| 30 to 34 Years | 0 (0.0%) | 0 (0.0%) |
| 35 to 39 Years | 0 (0.0%) | 0 (0.0%) |
| 40 to 44 Years | 0 (0.0%) | 0 (0.0%) |
| 45 to 49 Years | 2 (1.3%) | 0 (0.0%) |
| 50 to 54 Years | 0 (0.0%) | 38 (14.4%) |
| 55 to 59 Years | 17 (11.3%) | 32 (12.2%) |
| 60 to 64 Years | 36 (23.8%) | 51 (19.4%) |
| 65 to 69 Years | 47 (31.1%) | 2 (0.8%) |
| 70 to 74 Years | 1 (0.7%) | 0 (0.0%) |
| 75 to 79 Years | 0 (0.0%) | 63 (23.9%) |
| 80 to 84 Years | 13 (8.6%) | 0 (0.0%) |
| 85 Years and over | 0 (0.0%) | 18 (6.8%) |
| Total | 151 (100.0%) | 263 (100.0%) |
Families and Households in Bend
Median Family Size in Bend
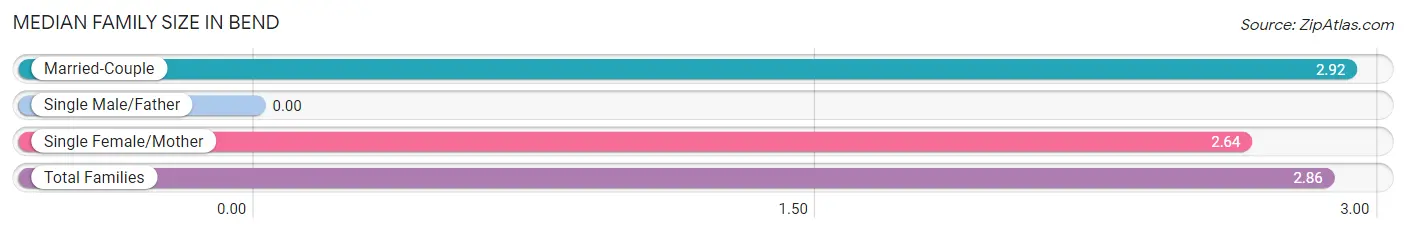
| Family Type | # Families | Family Size |
| Married-Couple | 108 (81.2%) | 2.92 |
| Single Male/Father | 0 (0.0%) | - |
| Single Female/Mother | 25 (18.8%) | 2.64 |
| Total Families | 133 (100.0%) | 2.86 |
Median Household Size in Bend
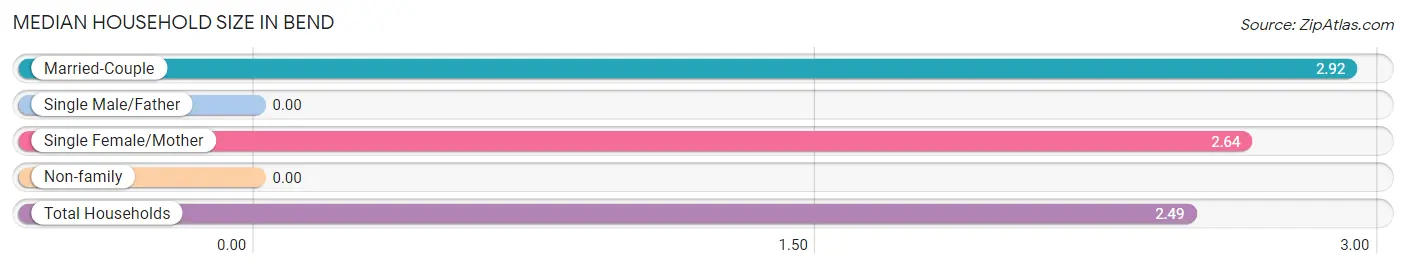
| Household Type | # Households | Household Size |
| Married-Couple | 108 (65.1%) | 2.92 |
| Single Male/Father | 0 (0.0%) | - |
| Single Female/Mother | 25 (15.1%) | 2.64 |
| Non-family | 33 (19.9%) | - |
| Total Households | 166 (100.0%) | 2.49 |
Household Size by Marriage Status in Bend
Out of a total of 166 households in Bend, 133 (80.1%) are family households, while 33 (19.9%) are nonfamily households. The most numerous type of family households are 2-person households, comprising 77, and the most common type of nonfamily households are 1-person households, comprising 33.
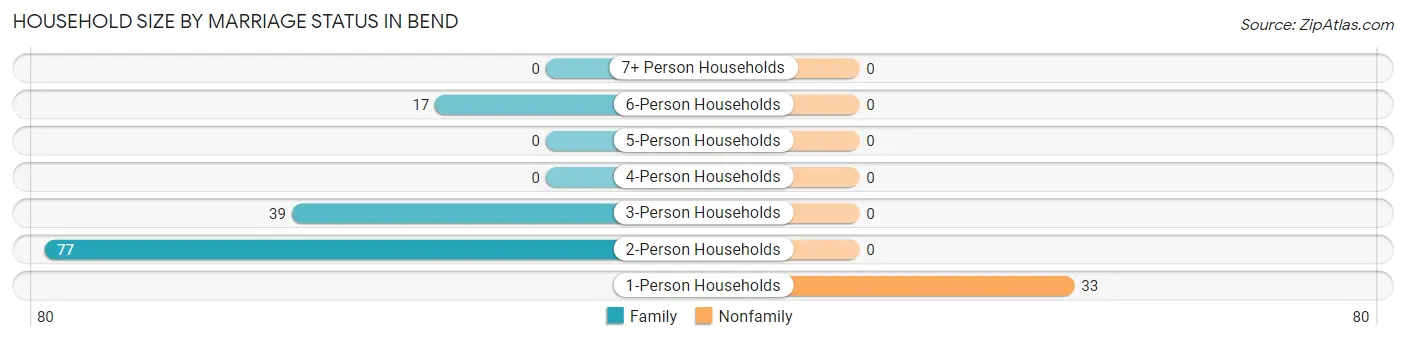
| Household Size | Family Households | Nonfamily Households |
| 1-Person Households | - | 33 (19.9%) |
| 2-Person Households | 77 (46.4%) | 0 (0.0%) |
| 3-Person Households | 39 (23.5%) | 0 (0.0%) |
| 4-Person Households | 0 (0.0%) | 0 (0.0%) |
| 5-Person Households | 0 (0.0%) | 0 (0.0%) |
| 6-Person Households | 17 (10.2%) | 0 (0.0%) |
| 7+ Person Households | 0 (0.0%) | 0 (0.0%) |
| Total | 133 (80.1%) | 33 (19.9%) |
Female Fertility in Bend
Fertility by Age in Bend
| Age Bracket | Women with Births | Births / 1,000 Women |
| 15 to 19 years | 0 (0.0%) | 0.0 |
| 20 to 34 years | 0 (0.0%) | 0.0 |
| 35 to 50 years | 0 (0.0%) | 0.0 |
| Total | 0 (0.0%) | 0.0 |
Fertility by Age by Marriage Status in Bend
| Age Bracket | Married | Unmarried |
| 15 to 19 years | 0 (0.0%) | 0 (0.0%) |
| 20 to 34 years | 0 (0.0%) | 0 (0.0%) |
| 35 to 50 years | 0 (0.0%) | 0 (0.0%) |
| Total | 0 (0.0%) | 0 (0.0%) |
Fertility by Education in Bend
| Educational Attainment | Women with Births | Births / 1,000 Women |
| Less than High School | 0 (0.0%) | 0.0 |
| High School Diploma | 0 (0.0%) | 0.0 |
| College or Associate's Degree | 0 (0.0%) | 0.0 |
| Bachelor's Degree | 0 (0.0%) | 0.0 |
| Graduate Degree | 0 (0.0%) | 0.0 |
| Total | 0 (0.0%) | 0.0 |
Fertility by Education by Marriage Status in Bend
| Educational Attainment | Married | Unmarried |
| Less than High School | 0 (0.0%) | 0 (0.0%) |
| High School Diploma | 0 (0.0%) | 0 (0.0%) |
| College or Associate's Degree | 0 (0.0%) | 0 (0.0%) |
| Bachelor's Degree | 0 (0.0%) | 0 (0.0%) |
| Graduate Degree | 0 (0.0%) | 0 (0.0%) |
| Total | 0 (0.0%) | 0 (0.0%) |
Employment Characteristics in Bend
Employment by Class of Employer in Bend
Among the 157 employed individuals in Bend, private company employees (108 | 68.8%), state government employees (38 | 24.2%), and local government employees (11 | 7.0%) make up the most common classes of employment.
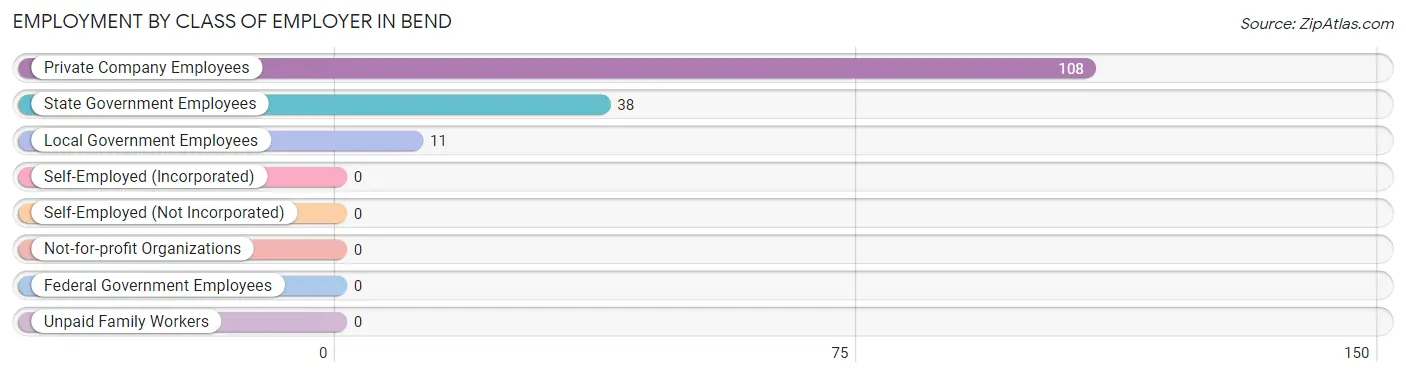
| Employer Class | # Employees | % Employees |
| Private Company Employees | 108 | 68.8% |
| Self-Employed (Incorporated) | 0 | 0.0% |
| Self-Employed (Not Incorporated) | 0 | 0.0% |
| Not-for-profit Organizations | 0 | 0.0% |
| Local Government Employees | 11 | 7.0% |
| State Government Employees | 38 | 24.2% |
| Federal Government Employees | 0 | 0.0% |
| Unpaid Family Workers | 0 | 0.0% |
| Total | 157 | 100.0% |
Employment Status by Age in Bend
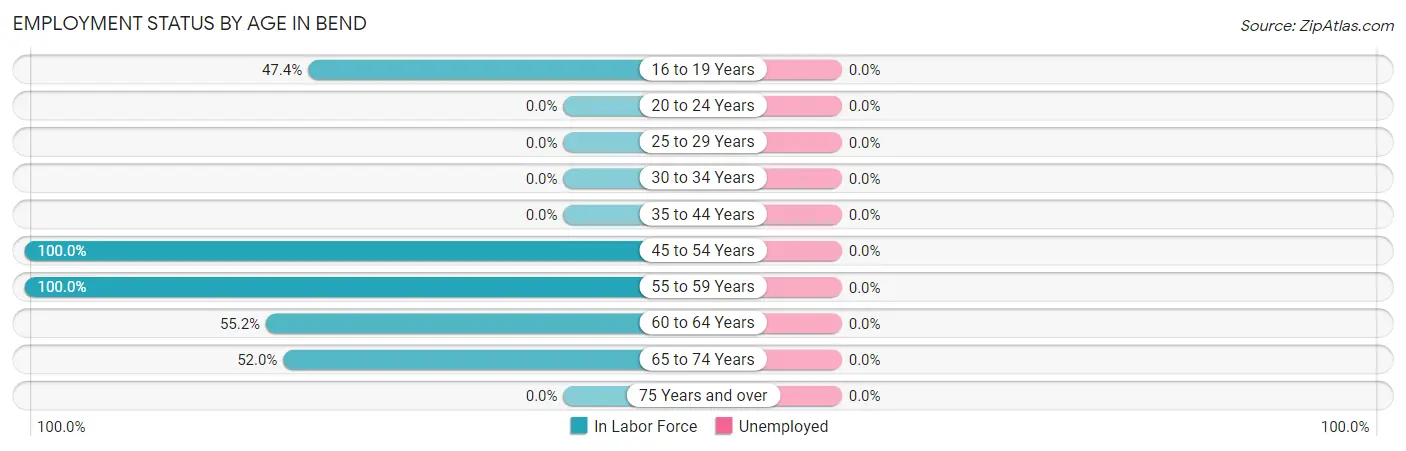
| Age Bracket | In Labor Force | Unemployed |
| 16 to 19 Years | 9 (47.4%) | 0 (0.0%) |
| 20 to 24 Years | 0 (0.0%) | 0 (0.0%) |
| 25 to 29 Years | 0 (0.0%) | 0 (0.0%) |
| 30 to 34 Years | 0 (0.0%) | 0 (0.0%) |
| 35 to 44 Years | 0 (0.0%) | 0 (0.0%) |
| 45 to 54 Years | 40 (100.0%) | 0 (0.0%) |
| 55 to 59 Years | 49 (100.0%) | 0 (0.0%) |
| 60 to 64 Years | 48 (55.2%) | 0 (0.0%) |
| 65 to 74 Years | 26 (52.0%) | 0 (0.0%) |
| 75 Years and over | 0 (0.0%) | 0 (0.0%) |
| Total | 172 (41.5%) | 0 (0.0%) |
Employment Status by Educational Attainment in Bend
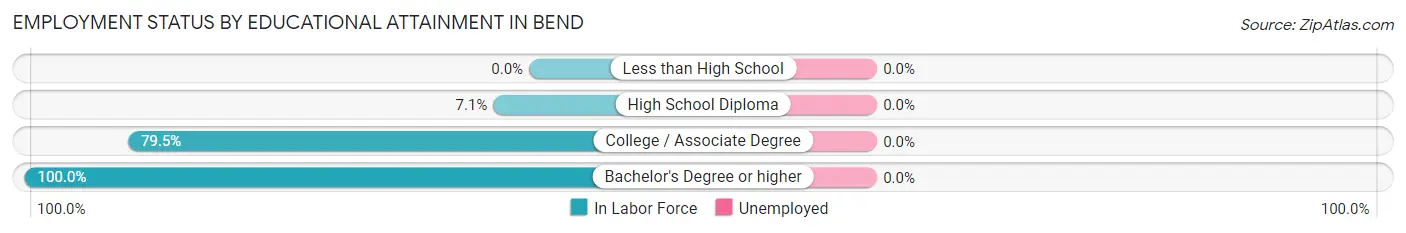
| Educational Attainment | In Labor Force | Unemployed |
| Less than High School | 0 (0.0%) | 0 (0.0%) |
| High School Diploma | 2 (7.1%) | 0 (0.0%) |
| College / Associate Degree | 97 (79.5%) | 0 (0.0%) |
| Bachelor's Degree or higher | 38 (100.0%) | 0 (0.0%) |
| Total | 137 (72.9%) | 0 (0.0%) |
Employment Occupations by Sex in Bend
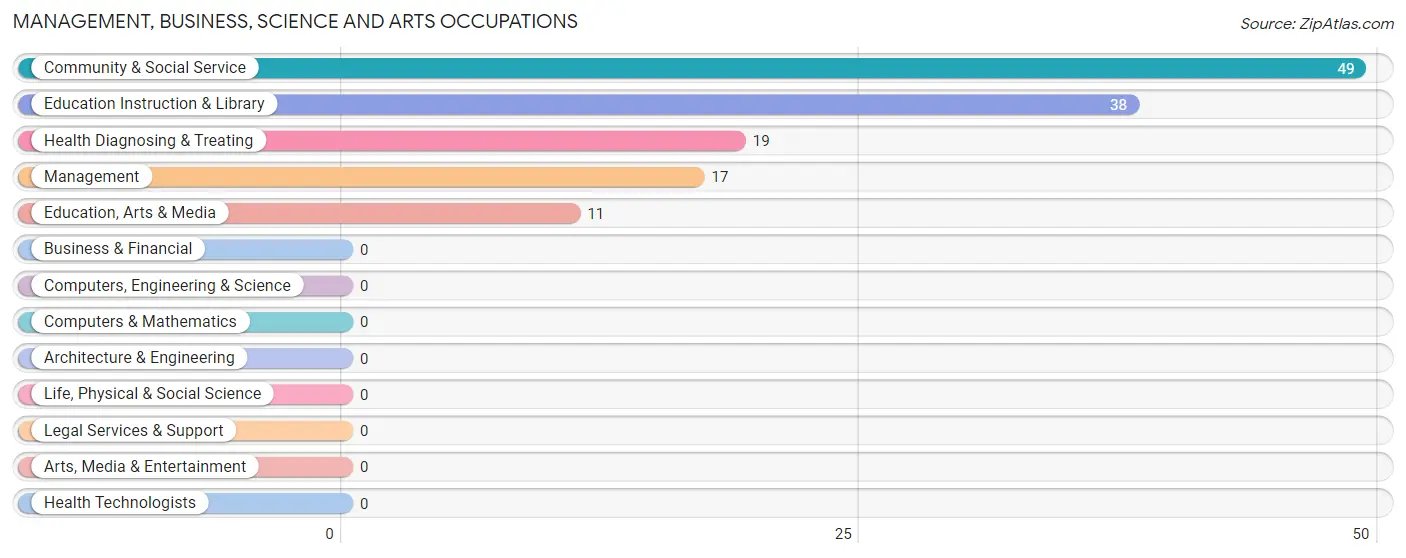
Management, Business, Science and Arts Occupations
The most common Management, Business, Science and Arts occupations in Bend are Community & Social Service (49 | 28.5%), Education Instruction & Library (38 | 22.1%), Health Diagnosing & Treating (19 | 11.1%), Management (17 | 9.9%), and Education, Arts & Media (11 | 6.4%).
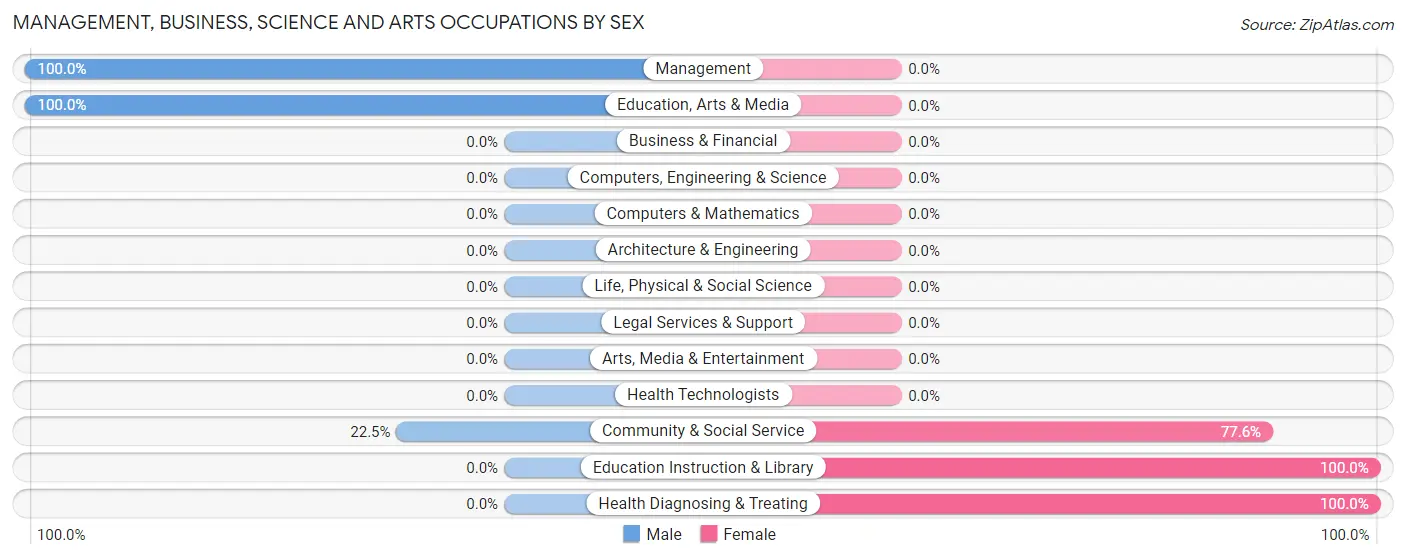
Management, Business, Science and Arts Occupations by Sex
Within the Management, Business, Science and Arts occupations in Bend, the most male-oriented occupations are Management (100.0%), Education, Arts & Media (100.0%), and Community & Social Service (22.5%), while the most female-oriented occupations are Education Instruction & Library (100.0%), Health Diagnosing & Treating (100.0%), and Community & Social Service (77.5%).
| Occupation | Male | Female |
| Management | 17 (100.0%) | 0 (0.0%) |
| Business & Financial | 0 (0.0%) | 0 (0.0%) |
| Computers, Engineering & Science | 0 (0.0%) | 0 (0.0%) |
| Computers & Mathematics | 0 (0.0%) | 0 (0.0%) |
| Architecture & Engineering | 0 (0.0%) | 0 (0.0%) |
| Life, Physical & Social Science | 0 (0.0%) | 0 (0.0%) |
| Community & Social Service | 11 (22.5%) | 38 (77.5%) |
| Education, Arts & Media | 11 (100.0%) | 0 (0.0%) |
| Legal Services & Support | 0 (0.0%) | 0 (0.0%) |
| Education Instruction & Library | 0 (0.0%) | 38 (100.0%) |
| Arts, Media & Entertainment | 0 (0.0%) | 0 (0.0%) |
| Health Diagnosing & Treating | 0 (0.0%) | 19 (100.0%) |
| Health Technologists | 0 (0.0%) | 0 (0.0%) |
| Total (Category) | 28 (32.9%) | 57 (67.1%) |
| Total (Overall) | 90 (52.3%) | 82 (47.7%) |
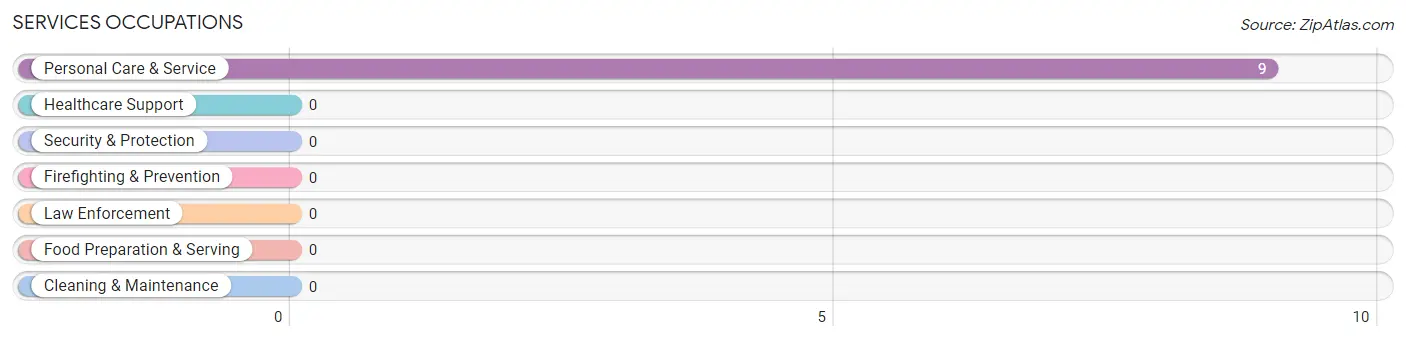
Services Occupations
The most common Services occupations in Bend are , and Personal Care & Service (9 | 5.2%).
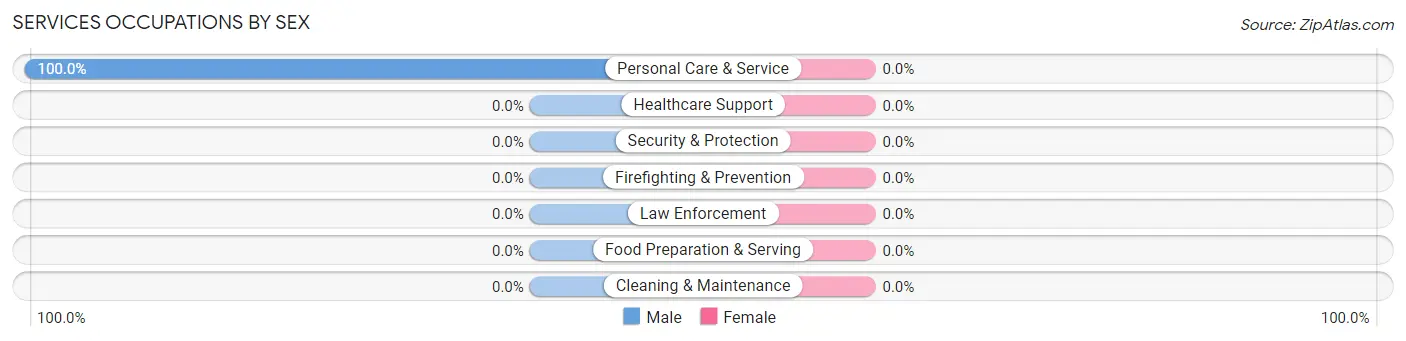
Services Occupations by Sex
| Occupation | Male | Female |
| Healthcare Support | 0 (0.0%) | 0 (0.0%) |
| Security & Protection | 0 (0.0%) | 0 (0.0%) |
| Firefighting & Prevention | 0 (0.0%) | 0 (0.0%) |
| Law Enforcement | 0 (0.0%) | 0 (0.0%) |
| Food Preparation & Serving | 0 (0.0%) | 0 (0.0%) |
| Cleaning & Maintenance | 0 (0.0%) | 0 (0.0%) |
| Personal Care & Service | 9 (100.0%) | 0 (0.0%) |
| Total (Category) | 9 (100.0%) | 0 (0.0%) |
| Total (Overall) | 90 (52.3%) | 82 (47.7%) |
Sales and Office Occupations
The most common Sales and Office occupations in Bend are , and Office & Administration (12 | 7.0%).
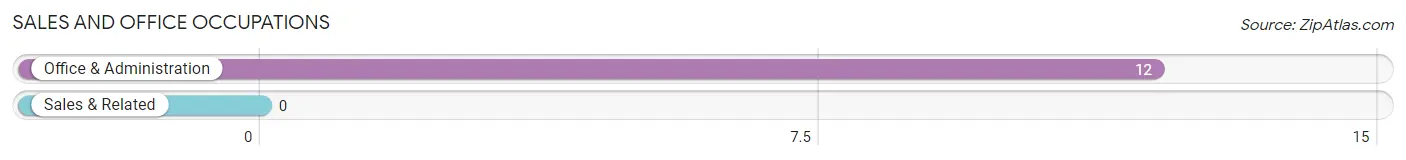
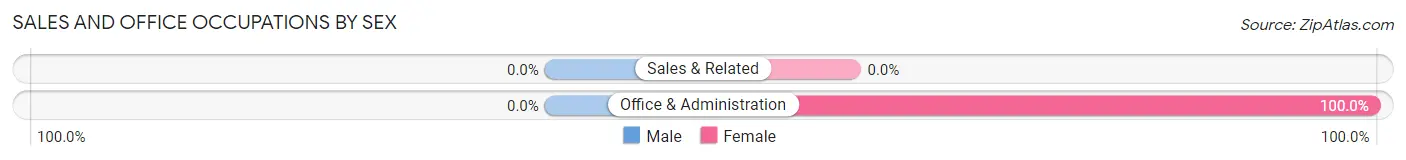
Sales and Office Occupations by Sex
| Occupation | Male | Female |
| Sales & Related | 0 (0.0%) | 0 (0.0%) |
| Office & Administration | 0 (0.0%) | 12 (100.0%) |
| Total (Category) | 0 (0.0%) | 12 (100.0%) |
| Total (Overall) | 90 (52.3%) | 82 (47.7%) |
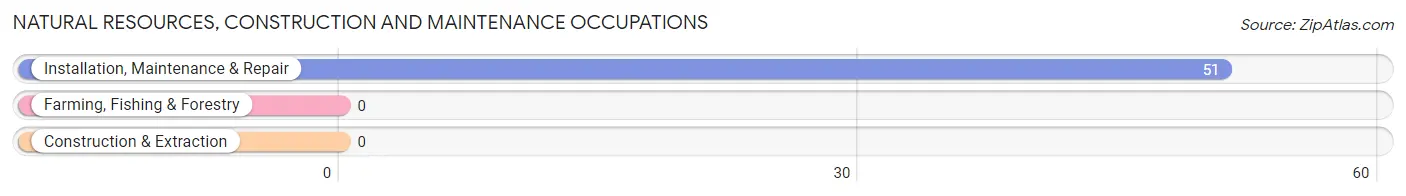
Natural Resources, Construction and Maintenance Occupations
The most common Natural Resources, Construction and Maintenance occupations in Bend are , and Installation, Maintenance & Repair (51 | 29.6%).
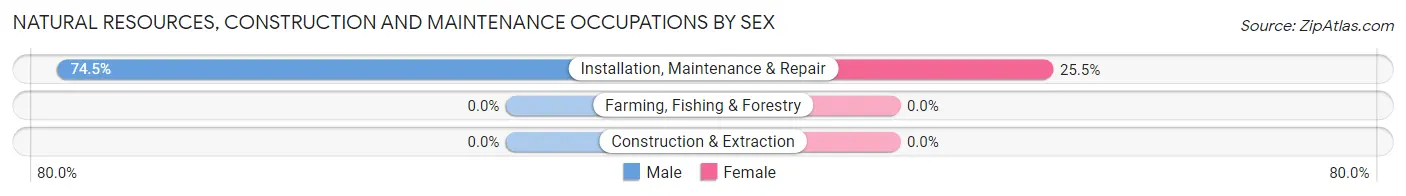
Natural Resources, Construction and Maintenance Occupations by Sex
| Occupation | Male | Female |
| Farming, Fishing & Forestry | 0 (0.0%) | 0 (0.0%) |
| Construction & Extraction | 0 (0.0%) | 0 (0.0%) |
| Installation, Maintenance & Repair | 38 (74.5%) | 13 (25.5%) |
| Total (Category) | 38 (74.5%) | 13 (25.5%) |
| Total (Overall) | 90 (52.3%) | 82 (47.7%) |
Production, Transportation and Moving Occupations
The most common Production, Transportation and Moving occupations in Bend are , and Material Moving (15 | 8.7%).
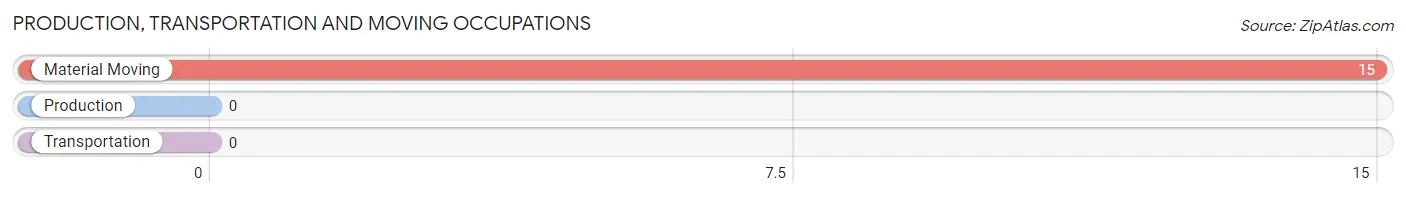
Production, Transportation and Moving Occupations by Sex
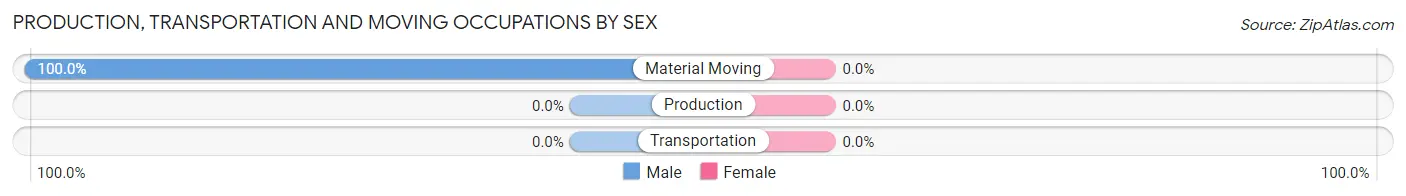
| Occupation | Male | Female |
| Production | 0 (0.0%) | 0 (0.0%) |
| Transportation | 0 (0.0%) | 0 (0.0%) |
| Material Moving | 15 (100.0%) | 0 (0.0%) |
| Total (Category) | 15 (100.0%) | 0 (0.0%) |
| Total (Overall) | 90 (52.3%) | 82 (47.7%) |
Employment Industries by Sex in Bend
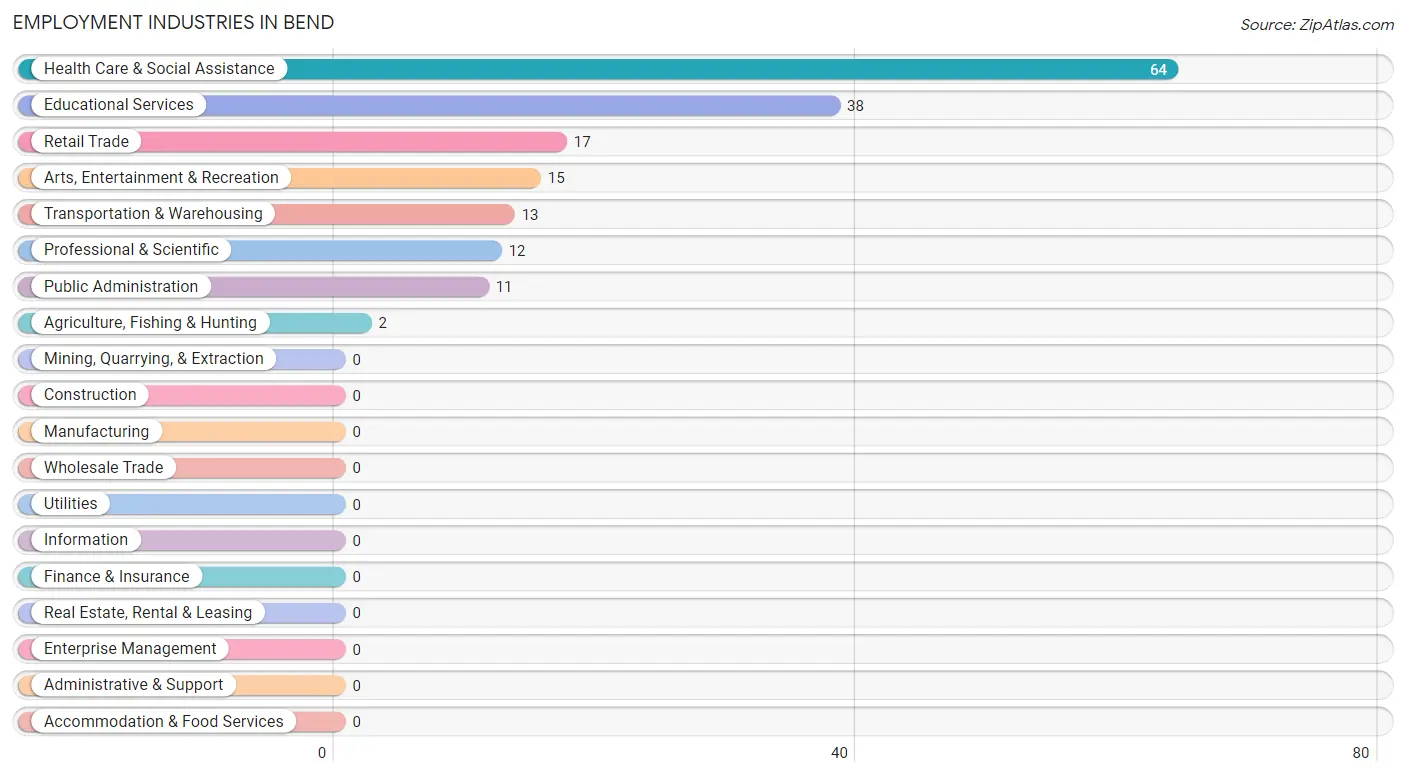
Employment Industries in Bend
The major employment industries in Bend include Health Care & Social Assistance (64 | 37.2%), Educational Services (38 | 22.1%), Retail Trade (17 | 9.9%), Arts, Entertainment & Recreation (15 | 8.7%), and Transportation & Warehousing (13 | 7.6%).
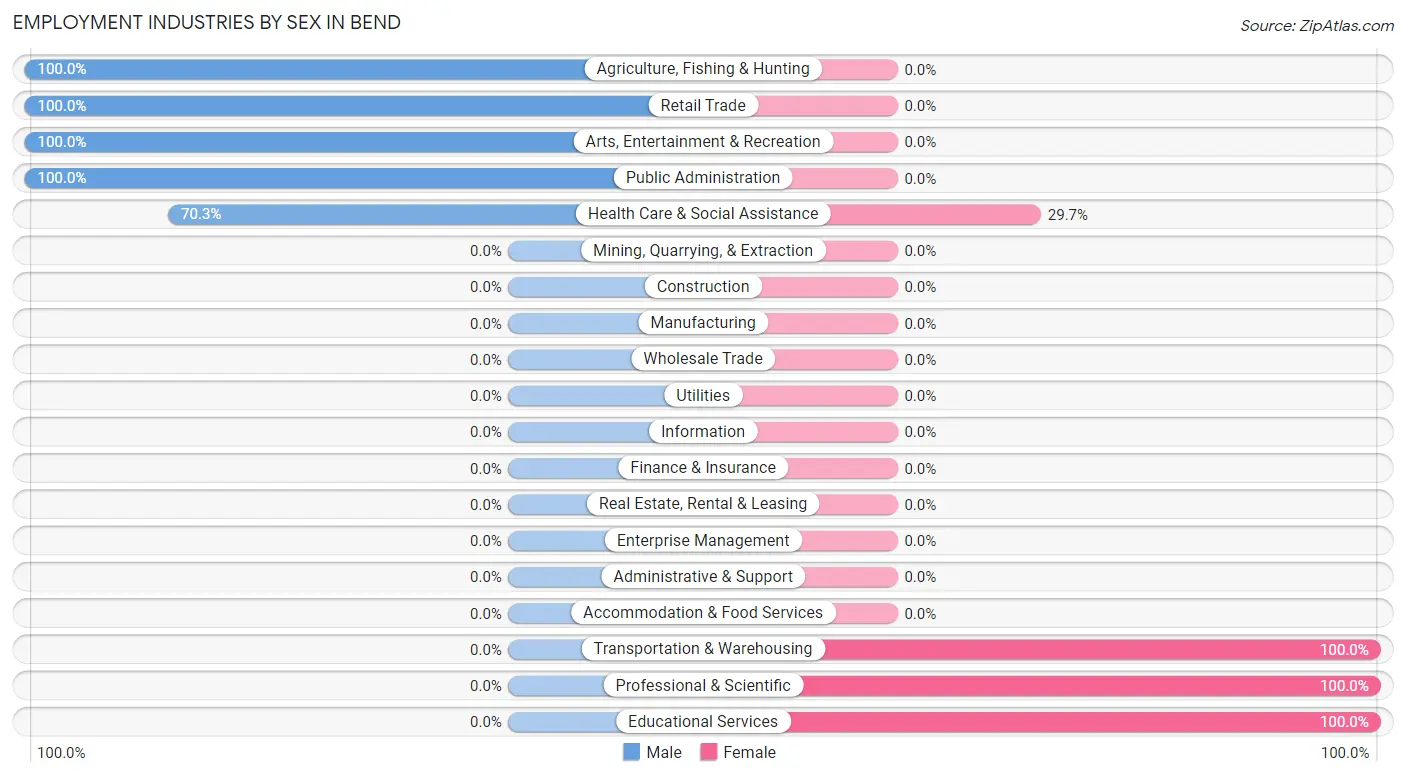
Employment Industries by Sex in Bend
The Bend industries that see more men than women are Agriculture, Fishing & Hunting (100.0%), Retail Trade (100.0%), and Arts, Entertainment & Recreation (100.0%), whereas the industries that tend to have a higher number of women are Transportation & Warehousing (100.0%), Professional & Scientific (100.0%), and Educational Services (100.0%).
| Industry | Male | Female |
| Agriculture, Fishing & Hunting | 2 (100.0%) | 0 (0.0%) |
| Mining, Quarrying, & Extraction | 0 (0.0%) | 0 (0.0%) |
| Construction | 0 (0.0%) | 0 (0.0%) |
| Manufacturing | 0 (0.0%) | 0 (0.0%) |
| Wholesale Trade | 0 (0.0%) | 0 (0.0%) |
| Retail Trade | 17 (100.0%) | 0 (0.0%) |
| Transportation & Warehousing | 0 (0.0%) | 13 (100.0%) |
| Utilities | 0 (0.0%) | 0 (0.0%) |
| Information | 0 (0.0%) | 0 (0.0%) |
| Finance & Insurance | 0 (0.0%) | 0 (0.0%) |
| Real Estate, Rental & Leasing | 0 (0.0%) | 0 (0.0%) |
| Professional & Scientific | 0 (0.0%) | 12 (100.0%) |
| Enterprise Management | 0 (0.0%) | 0 (0.0%) |
| Administrative & Support | 0 (0.0%) | 0 (0.0%) |
| Educational Services | 0 (0.0%) | 38 (100.0%) |
| Health Care & Social Assistance | 45 (70.3%) | 19 (29.7%) |
| Arts, Entertainment & Recreation | 15 (100.0%) | 0 (0.0%) |
| Accommodation & Food Services | 0 (0.0%) | 0 (0.0%) |
| Public Administration | 11 (100.0%) | 0 (0.0%) |
| Total | 90 (52.3%) | 82 (47.7%) |
Education in Bend
School Enrollment in Bend
The most common levels of schooling among the 73 students in Bend are college / undergraduate (49 | 67.1%), and high school (24 | 32.9%).
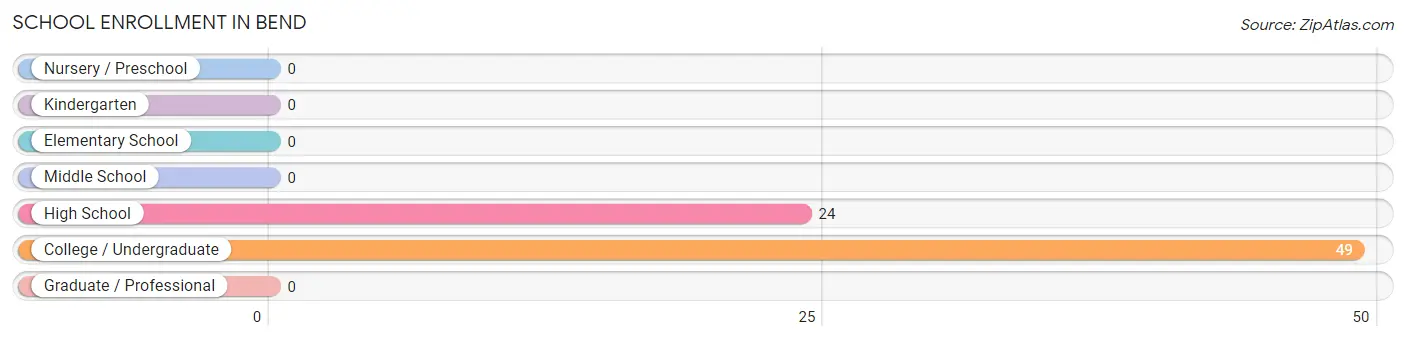
| School Level | # Students | % Students |
| Nursery / Preschool | 0 | 0.0% |
| Kindergarten | 0 | 0.0% |
| Elementary School | 0 | 0.0% |
| Middle School | 0 | 0.0% |
| High School | 24 | 32.9% |
| College / Undergraduate | 49 | 67.1% |
| Graduate / Professional | 0 | 0.0% |
| Total | 73 | 100.0% |
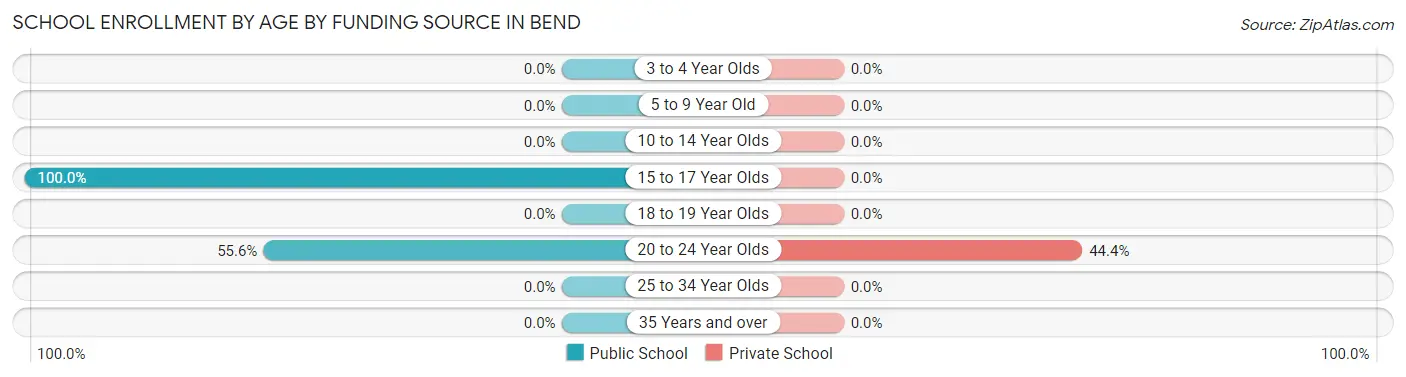
School Enrollment by Age by Funding Source in Bend
Out of a total of 73 students who are enrolled in schools in Bend, 28 (38.4%) attend a private institution, while the remaining 45 (61.6%) are enrolled in public schools. The age group of 20 to 24 year olds has the highest likelihood of being enrolled in private schools, with 28 (44.4% in the age bracket) enrolled. Conversely, the age group of 15 to 17 year olds has the lowest likelihood of being enrolled in a private school, with 10 (100.0% in the age bracket) attending a public institution.
| Age Bracket | Public School | Private School |
| 3 to 4 Year Olds | 0 (0.0%) | 0 (0.0%) |
| 5 to 9 Year Old | 0 (0.0%) | 0 (0.0%) |
| 10 to 14 Year Olds | 0 (0.0%) | 0 (0.0%) |
| 15 to 17 Year Olds | 10 (100.0%) | 0 (0.0%) |
| 18 to 19 Year Olds | 0 (0.0%) | 0 (0.0%) |
| 20 to 24 Year Olds | 35 (55.6%) | 28 (44.4%) |
| 25 to 34 Year Olds | 0 (0.0%) | 0 (0.0%) |
| 35 Years and over | 0 (0.0%) | 0 (0.0%) |
| Total | 45 (61.6%) | 28 (38.4%) |
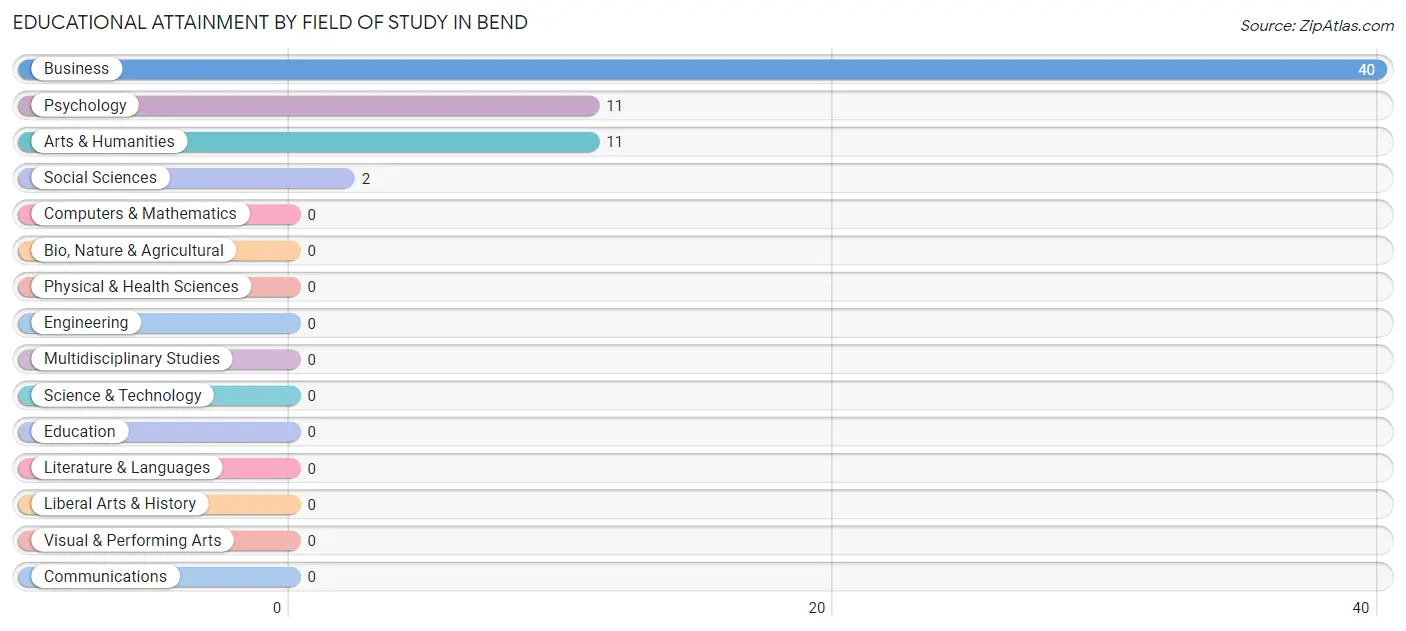
Educational Attainment by Field of Study in Bend
Business (40 | 62.5%), psychology (11 | 17.2%), arts & humanities (11 | 17.2%), and social sciences (2 | 3.1%) are the most common fields of study among 64 individuals in Bend who have obtained a bachelor's degree or higher.
| Field of Study | # Graduates | % Graduates |
| Computers & Mathematics | 0 | 0.0% |
| Bio, Nature & Agricultural | 0 | 0.0% |
| Physical & Health Sciences | 0 | 0.0% |
| Psychology | 11 | 17.2% |
| Social Sciences | 2 | 3.1% |
| Engineering | 0 | 0.0% |
| Multidisciplinary Studies | 0 | 0.0% |
| Science & Technology | 0 | 0.0% |
| Business | 40 | 62.5% |
| Education | 0 | 0.0% |
| Literature & Languages | 0 | 0.0% |
| Liberal Arts & History | 0 | 0.0% |
| Visual & Performing Arts | 0 | 0.0% |
| Communications | 0 | 0.0% |
| Arts & Humanities | 11 | 17.2% |
| Total | 64 | 100.0% |
Transportation & Commute in Bend
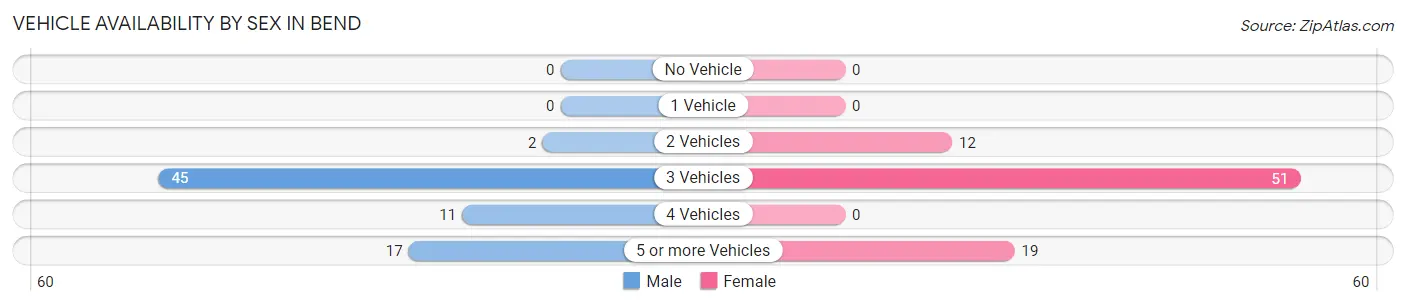
Vehicle Availability by Sex in Bend
The most prevalent vehicle ownership categories in Bend are males with 3 vehicles (45, accounting for 60.0%) and females with 3 vehicles (51, making up 54.9%).
| Vehicles Available | Male | Female |
| No Vehicle | 0 (0.0%) | 0 (0.0%) |
| 1 Vehicle | 0 (0.0%) | 0 (0.0%) |
| 2 Vehicles | 2 (2.7%) | 12 (14.6%) |
| 3 Vehicles | 45 (60.0%) | 51 (62.2%) |
| 4 Vehicles | 11 (14.7%) | 0 (0.0%) |
| 5 or more Vehicles | 17 (22.7%) | 19 (23.2%) |
| Total | 75 (100.0%) | 82 (100.0%) |
Commute Time in Bend
The most frequently occuring commute durations in Bend are 60 to 89 minutes (38 commuters, 26.2%), 30 to 34 minutes (36 commuters, 24.8%), and 35 to 39 minutes (36 commuters, 24.8%).
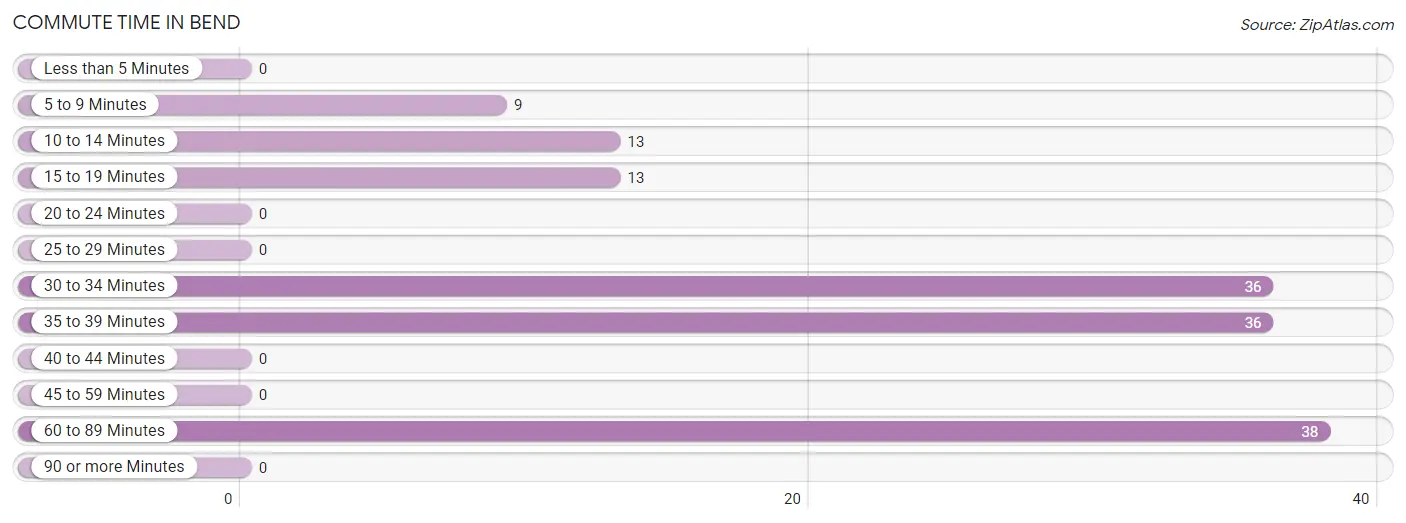
| Commute Time | # Commuters | % Commuters |
| Less than 5 Minutes | 0 | 0.0% |
| 5 to 9 Minutes | 9 | 6.2% |
| 10 to 14 Minutes | 13 | 9.0% |
| 15 to 19 Minutes | 13 | 9.0% |
| 20 to 24 Minutes | 0 | 0.0% |
| 25 to 29 Minutes | 0 | 0.0% |
| 30 to 34 Minutes | 36 | 24.8% |
| 35 to 39 Minutes | 36 | 24.8% |
| 40 to 44 Minutes | 0 | 0.0% |
| 45 to 59 Minutes | 0 | 0.0% |
| 60 to 89 Minutes | 38 | 26.2% |
| 90 or more Minutes | 0 | 0.0% |
Commute Time by Sex in Bend
The most common commute times in Bend are 35 to 39 minutes (36 commuters, 48.0%) for males and 60 to 89 minutes (38 commuters, 54.3%) for females.
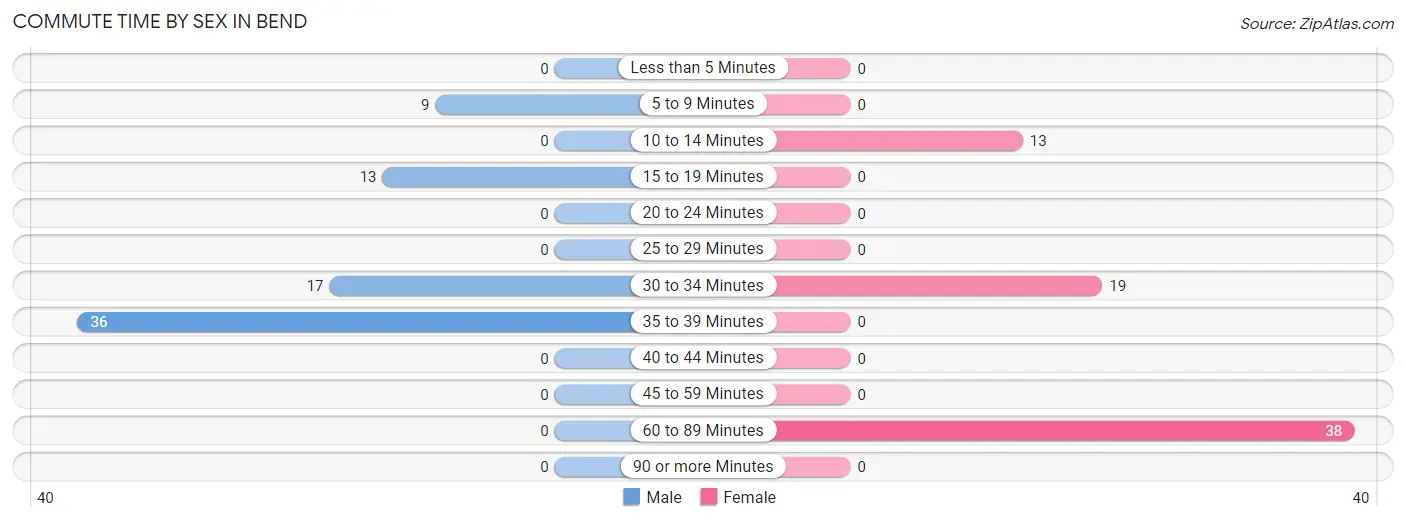
| Commute Time | Male | Female |
| Less than 5 Minutes | 0 (0.0%) | 0 (0.0%) |
| 5 to 9 Minutes | 9 (12.0%) | 0 (0.0%) |
| 10 to 14 Minutes | 0 (0.0%) | 13 (18.6%) |
| 15 to 19 Minutes | 13 (17.3%) | 0 (0.0%) |
| 20 to 24 Minutes | 0 (0.0%) | 0 (0.0%) |
| 25 to 29 Minutes | 0 (0.0%) | 0 (0.0%) |
| 30 to 34 Minutes | 17 (22.7%) | 19 (27.1%) |
| 35 to 39 Minutes | 36 (48.0%) | 0 (0.0%) |
| 40 to 44 Minutes | 0 (0.0%) | 0 (0.0%) |
| 45 to 59 Minutes | 0 (0.0%) | 0 (0.0%) |
| 60 to 89 Minutes | 0 (0.0%) | 38 (54.3%) |
| 90 or more Minutes | 0 (0.0%) | 0 (0.0%) |
Time of Departure to Work by Sex in Bend
The most frequent times of departure to work in Bend are 5:00 AM to 5:29 AM (36, 48.0%) for males and 6:30 AM to 6:59 AM (57, 81.4%) for females.
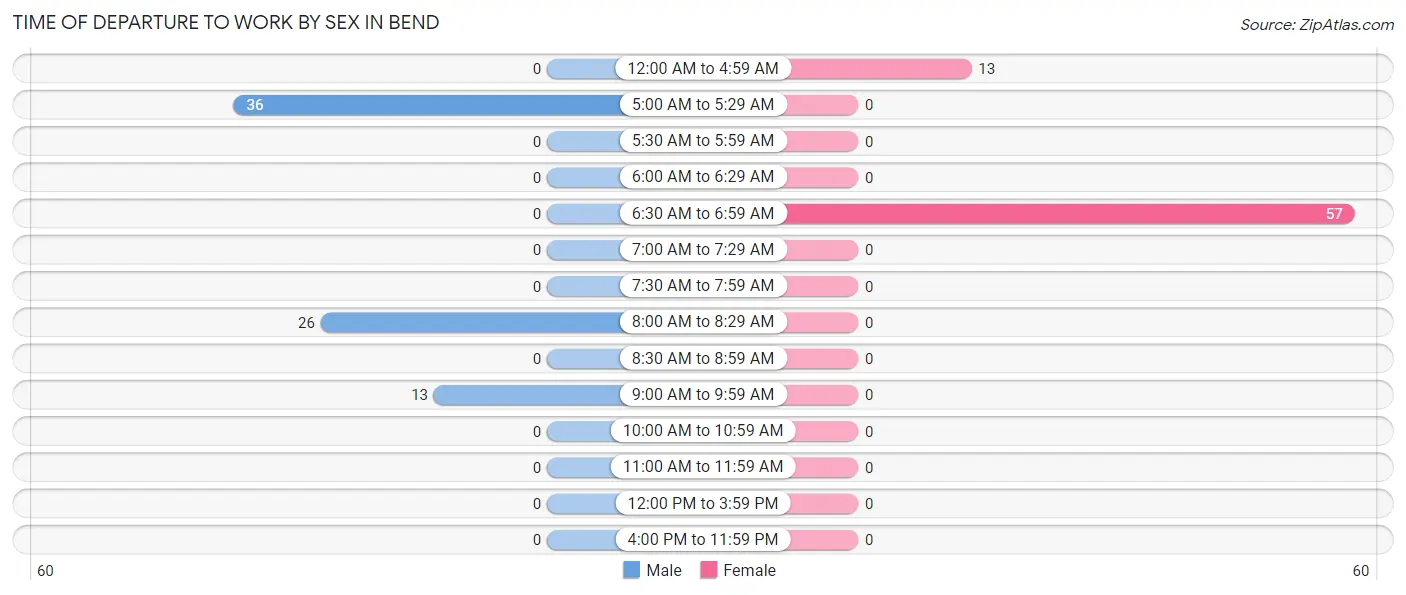
| Time of Departure | Male | Female |
| 12:00 AM to 4:59 AM | 0 (0.0%) | 13 (18.6%) |
| 5:00 AM to 5:29 AM | 36 (48.0%) | 0 (0.0%) |
| 5:30 AM to 5:59 AM | 0 (0.0%) | 0 (0.0%) |
| 6:00 AM to 6:29 AM | 0 (0.0%) | 0 (0.0%) |
| 6:30 AM to 6:59 AM | 0 (0.0%) | 57 (81.4%) |
| 7:00 AM to 7:29 AM | 0 (0.0%) | 0 (0.0%) |
| 7:30 AM to 7:59 AM | 0 (0.0%) | 0 (0.0%) |
| 8:00 AM to 8:29 AM | 26 (34.7%) | 0 (0.0%) |
| 8:30 AM to 8:59 AM | 0 (0.0%) | 0 (0.0%) |
| 9:00 AM to 9:59 AM | 13 (17.3%) | 0 (0.0%) |
| 10:00 AM to 10:59 AM | 0 (0.0%) | 0 (0.0%) |
| 11:00 AM to 11:59 AM | 0 (0.0%) | 0 (0.0%) |
| 12:00 PM to 3:59 PM | 0 (0.0%) | 0 (0.0%) |
| 4:00 PM to 11:59 PM | 0 (0.0%) | 0 (0.0%) |
| Total | 75 (100.0%) | 70 (100.0%) |
Housing Occupancy in Bend
Occupancy by Ownership in Bend
Of the total 166 dwellings in Bend, owner-occupied units account for 166 (100.0%), while renter-occupied units make up 0 (0.0%).
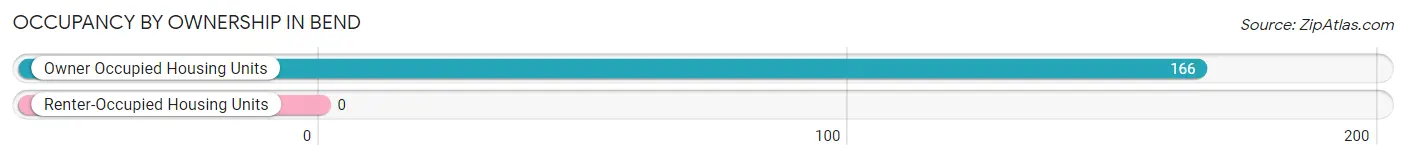
| Occupancy | # Housing Units | % Housing Units |
| Owner Occupied Housing Units | 166 | 100.0% |
| Renter-Occupied Housing Units | 0 | 0.0% |
| Total Occupied Housing Units | 166 | 100.0% |
Occupancy by Household Size in Bend
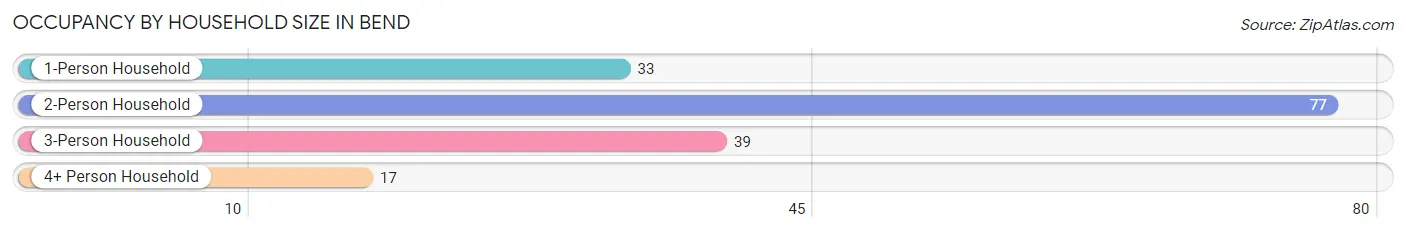
| Household Size | # Housing Units | % Housing Units |
| 1-Person Household | 33 | 19.9% |
| 2-Person Household | 77 | 46.4% |
| 3-Person Household | 39 | 23.5% |
| 4+ Person Household | 17 | 10.2% |
| Total Housing Units | 166 | 100.0% |
Occupancy by Ownership by Household Size in Bend
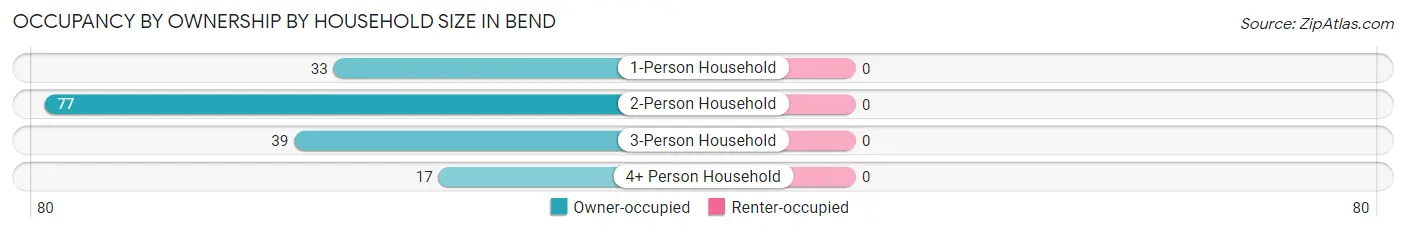
| Household Size | Owner-occupied | Renter-occupied |
| 1-Person Household | 33 (100.0%) | 0 (0.0%) |
| 2-Person Household | 77 (100.0%) | 0 (0.0%) |
| 3-Person Household | 39 (100.0%) | 0 (0.0%) |
| 4+ Person Household | 17 (100.0%) | 0 (0.0%) |
| Total Housing Units | 166 (100.0%) | 0 (0.0%) |
Occupancy by Educational Attainment in Bend
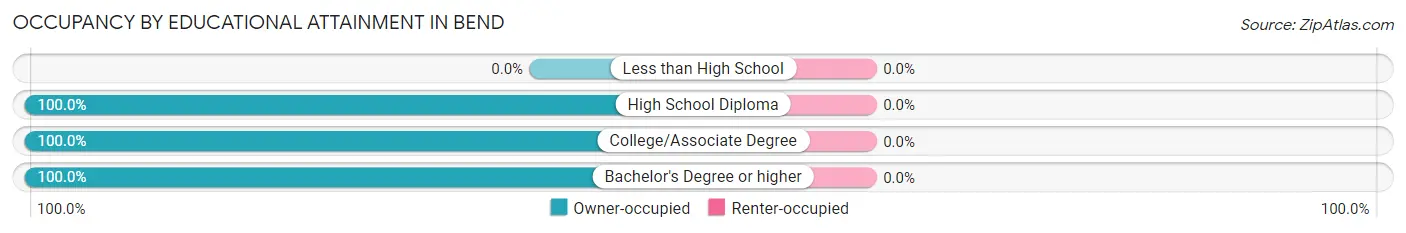
| Household Size | Owner-occupied | Renter-occupied |
| Less than High School | 0 (0.0%) | 0 (0.0%) |
| High School Diploma | 16 (100.0%) | 0 (0.0%) |
| College/Associate Degree | 101 (100.0%) | 0 (0.0%) |
| Bachelor's Degree or higher | 49 (100.0%) | 0 (0.0%) |
Occupancy by Age of Householder in Bend
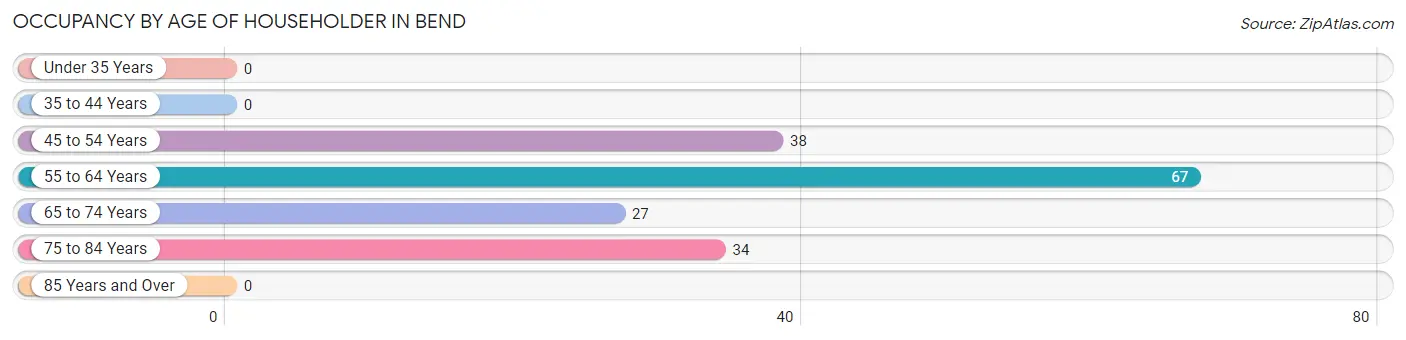
| Age Bracket | # Households | % Households |
| Under 35 Years | 0 | 0.0% |
| 35 to 44 Years | 0 | 0.0% |
| 45 to 54 Years | 38 | 22.9% |
| 55 to 64 Years | 67 | 40.4% |
| 65 to 74 Years | 27 | 16.3% |
| 75 to 84 Years | 34 | 20.5% |
| 85 Years and Over | 0 | 0.0% |
| Total | 166 | 100.0% |
Housing Finances in Bend
Median Income by Occupancy in Bend
| Occupancy Type | # Households | Median Income |
| Owner-Occupied | 166 (100.0%) | $0 |
| Renter-Occupied | 0 (0.0%) | $0 |
| Average | 166 (100.0%) | $0 |
Occupancy by Householder Income Bracket in Bend
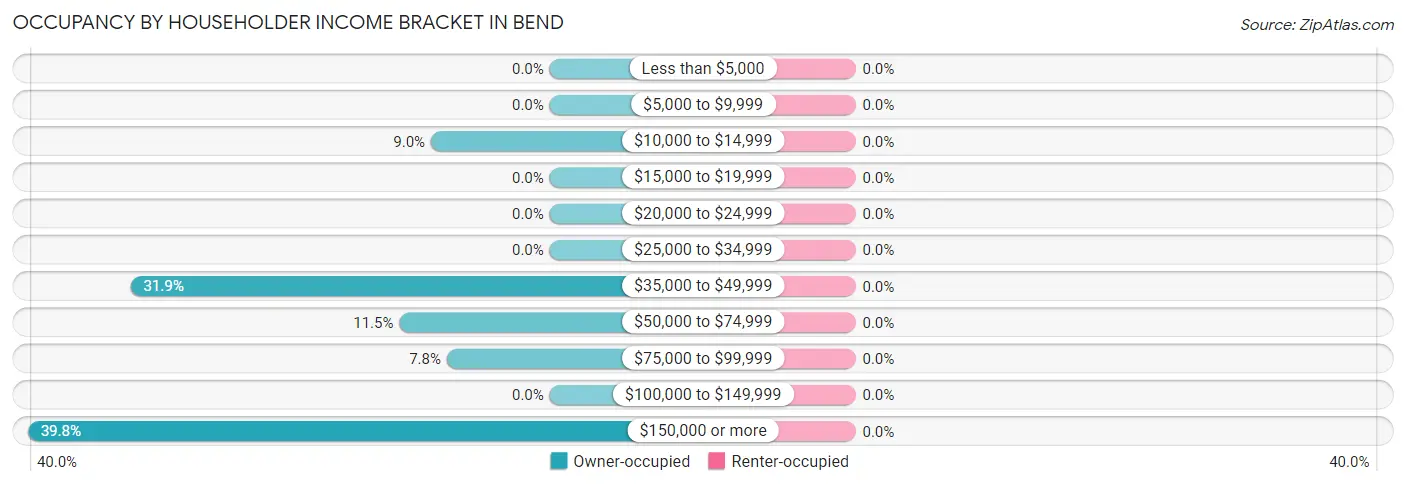
| Income Bracket | Owner-occupied | Renter-occupied |
| Less than $5,000 | 0 (0.0%) | 0 (0.0%) |
| $5,000 to $9,999 | 0 (0.0%) | 0 (0.0%) |
| $10,000 to $14,999 | 15 (9.0%) | 0 (0.0%) |
| $15,000 to $19,999 | 0 (0.0%) | 0 (0.0%) |
| $20,000 to $24,999 | 0 (0.0%) | 0 (0.0%) |
| $25,000 to $34,999 | 0 (0.0%) | 0 (0.0%) |
| $35,000 to $49,999 | 53 (31.9%) | 0 (0.0%) |
| $50,000 to $74,999 | 19 (11.5%) | 0 (0.0%) |
| $75,000 to $99,999 | 13 (7.8%) | 0 (0.0%) |
| $100,000 to $149,999 | 0 (0.0%) | 0 (0.0%) |
| $150,000 or more | 66 (39.8%) | 0 (0.0%) |
| Total | 166 (100.0%) | 0 (0.0%) |
Monthly Housing Cost Tiers in Bend
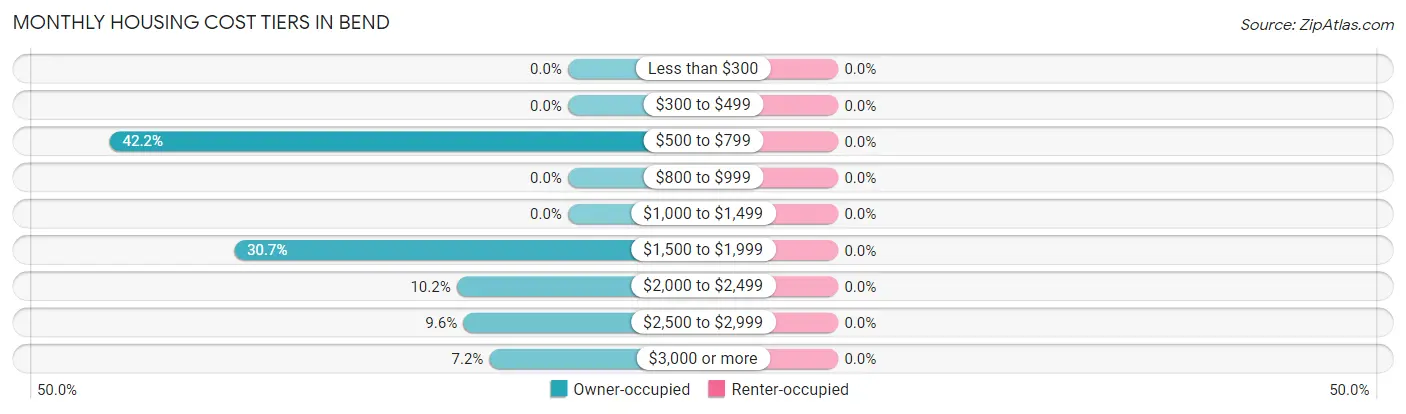
| Monthly Cost | Owner-occupied | Renter-occupied |
| Less than $300 | 0 (0.0%) | 0 (0.0%) |
| $300 to $499 | 0 (0.0%) | 0 (0.0%) |
| $500 to $799 | 70 (42.2%) | 0 (0.0%) |
| $800 to $999 | 0 (0.0%) | 0 (0.0%) |
| $1,000 to $1,499 | 0 (0.0%) | 0 (0.0%) |
| $1,500 to $1,999 | 51 (30.7%) | 0 (0.0%) |
| $2,000 to $2,499 | 17 (10.2%) | 0 (0.0%) |
| $2,500 to $2,999 | 16 (9.6%) | 0 (0.0%) |
| $3,000 or more | 12 (7.2%) | 0 (0.0%) |
| Total | 166 (100.0%) | 0 (0.0%) |
Physical Housing Characteristics in Bend
Housing Structures in Bend
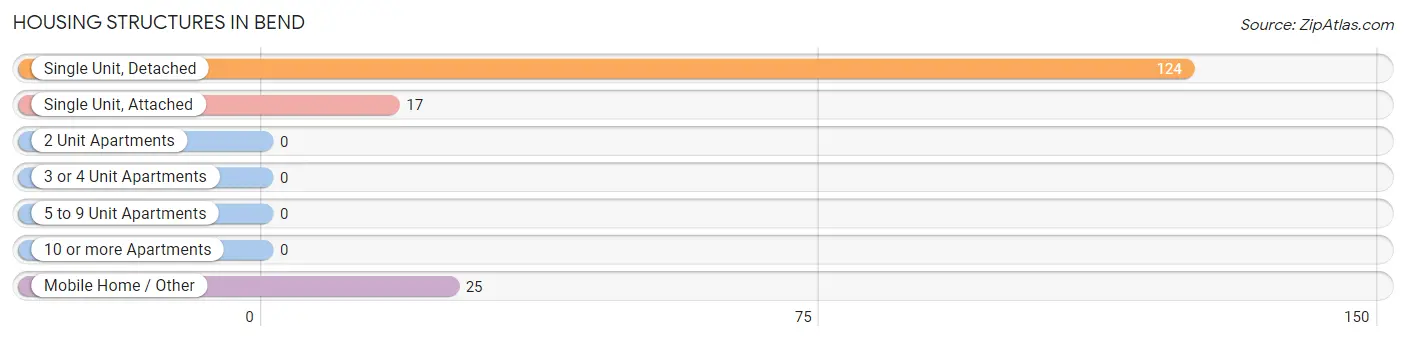
| Structure Type | # Housing Units | % Housing Units |
| Single Unit, Detached | 124 | 74.7% |
| Single Unit, Attached | 17 | 10.2% |
| 2 Unit Apartments | 0 | 0.0% |
| 3 or 4 Unit Apartments | 0 | 0.0% |
| 5 to 9 Unit Apartments | 0 | 0.0% |
| 10 or more Apartments | 0 | 0.0% |
| Mobile Home / Other | 25 | 15.1% |
| Total | 166 | 100.0% |
Housing Structures by Occupancy in Bend
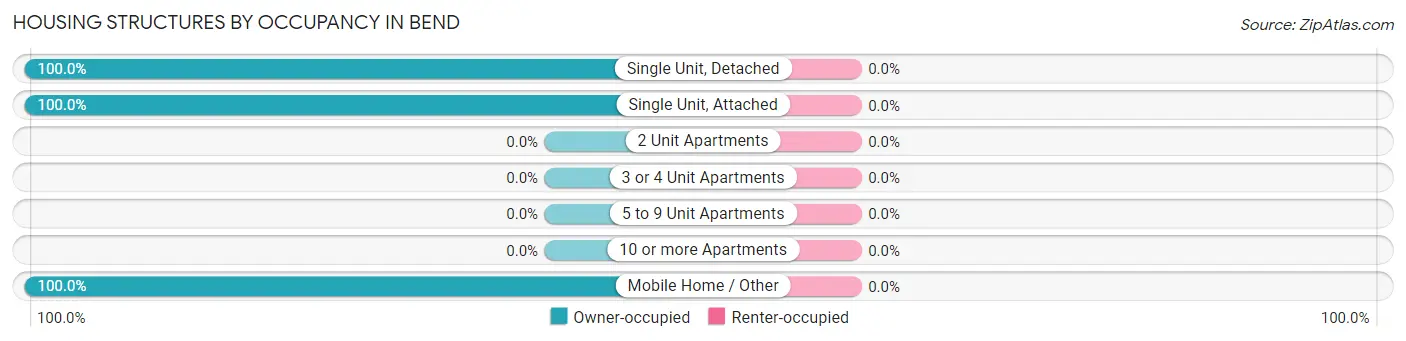
| Structure Type | Owner-occupied | Renter-occupied |
| Single Unit, Detached | 124 (100.0%) | 0 (0.0%) |
| Single Unit, Attached | 17 (100.0%) | 0 (0.0%) |
| 2 Unit Apartments | 0 (0.0%) | 0 (0.0%) |
| 3 or 4 Unit Apartments | 0 (0.0%) | 0 (0.0%) |
| 5 to 9 Unit Apartments | 0 (0.0%) | 0 (0.0%) |
| 10 or more Apartments | 0 (0.0%) | 0 (0.0%) |
| Mobile Home / Other | 25 (100.0%) | 0 (0.0%) |
| Total | 166 (100.0%) | 0 (0.0%) |
Housing Structures by Number of Rooms in Bend
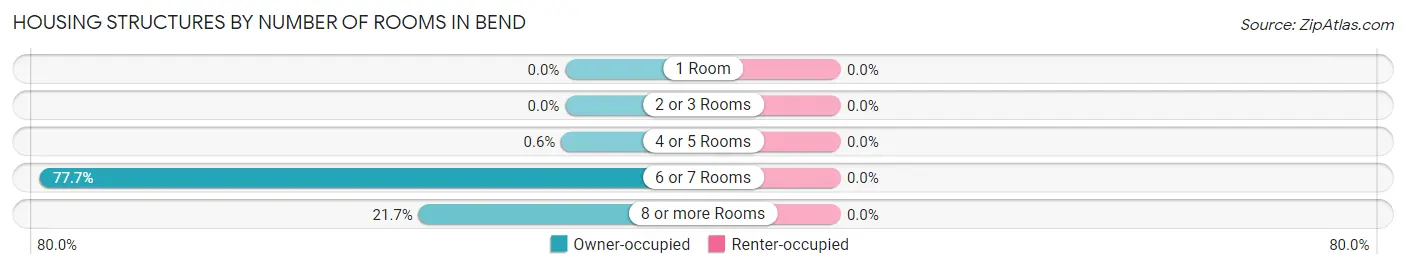
| Number of Rooms | Owner-occupied | Renter-occupied |
| 1 Room | 0 (0.0%) | 0 (0.0%) |
| 2 or 3 Rooms | 0 (0.0%) | 0 (0.0%) |
| 4 or 5 Rooms | 1 (0.6%) | 0 (0.0%) |
| 6 or 7 Rooms | 129 (77.7%) | 0 (0.0%) |
| 8 or more Rooms | 36 (21.7%) | 0 (0.0%) |
| Total | 166 (100.0%) | 0 (0.0%) |
Housing Structure by Heating Type in Bend
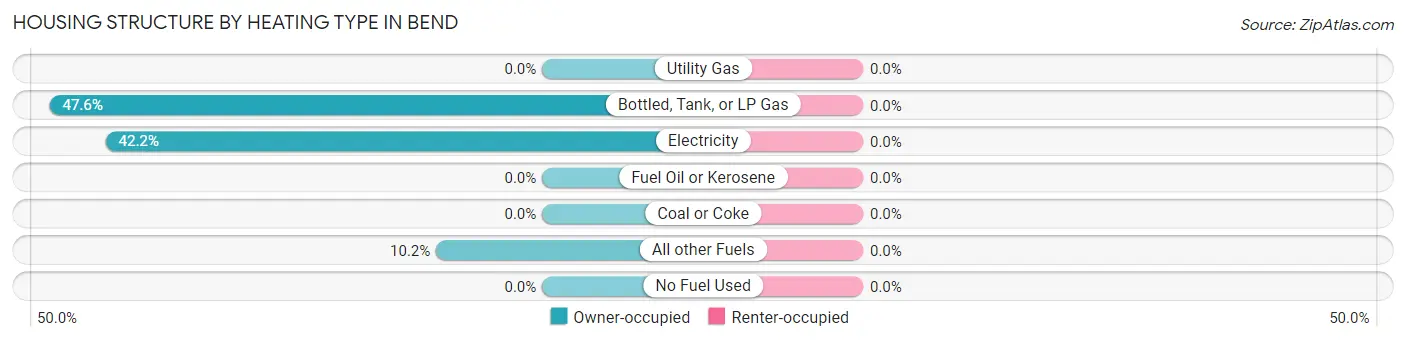
| Heating Type | Owner-occupied | Renter-occupied |
| Utility Gas | 0 (0.0%) | 0 (0.0%) |
| Bottled, Tank, or LP Gas | 79 (47.6%) | 0 (0.0%) |
| Electricity | 70 (42.2%) | 0 (0.0%) |
| Fuel Oil or Kerosene | 0 (0.0%) | 0 (0.0%) |
| Coal or Coke | 0 (0.0%) | 0 (0.0%) |
| All other Fuels | 17 (10.2%) | 0 (0.0%) |
| No Fuel Used | 0 (0.0%) | 0 (0.0%) |
| Total | 166 (100.0%) | 0 (0.0%) |
Household Vehicle Usage in Bend
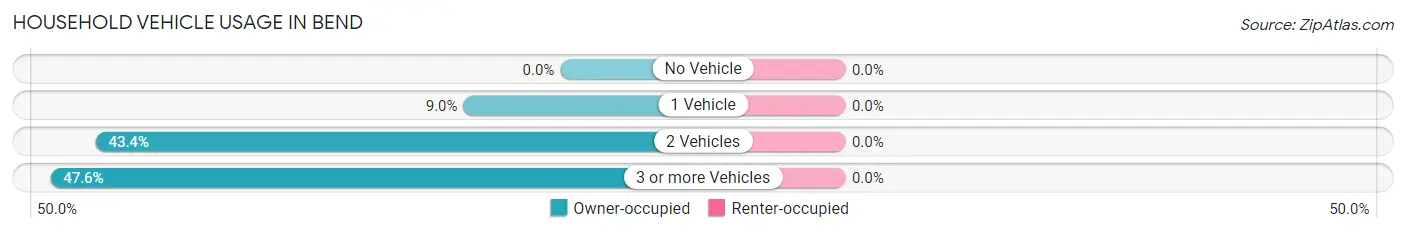
| Vehicles per Household | Owner-occupied | Renter-occupied |
| No Vehicle | 0 (0.0%) | 0 (0.0%) |
| 1 Vehicle | 15 (9.0%) | 0 (0.0%) |
| 2 Vehicles | 72 (43.4%) | 0 (0.0%) |
| 3 or more Vehicles | 79 (47.6%) | 0 (0.0%) |
| Total | 166 (100.0%) | 0 (0.0%) |
Real Estate & Mortgages in Bend
Real Estate and Mortgage Overview in Bend
| Characteristic | Without Mortgage | With Mortgage |
| Housing Units | 70 | 96 |
| Median Property Value | $268,500 | $449,300 |
| Median Household Income | $43,300 | $66 |
| Monthly Housing Costs | $681 | $12 |
| Real Estate Taxes | $2,333 | $0 |
Property Value by Mortgage Status in Bend
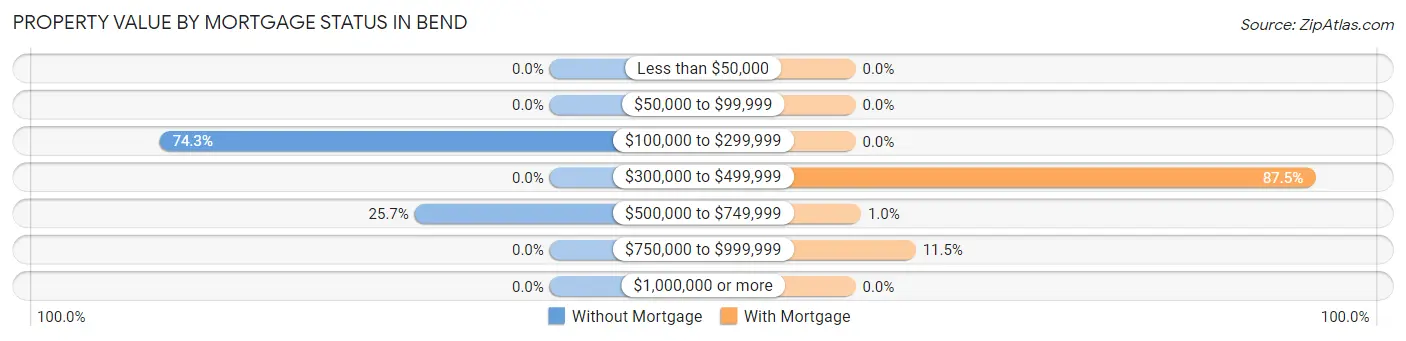
| Property Value | Without Mortgage | With Mortgage |
| Less than $50,000 | 0 (0.0%) | 0 (0.0%) |
| $50,000 to $99,999 | 0 (0.0%) | 0 (0.0%) |
| $100,000 to $299,999 | 52 (74.3%) | 0 (0.0%) |
| $300,000 to $499,999 | 0 (0.0%) | 84 (87.5%) |
| $500,000 to $749,999 | 18 (25.7%) | 1 (1.0%) |
| $750,000 to $999,999 | 0 (0.0%) | 11 (11.5%) |
| $1,000,000 or more | 0 (0.0%) | 0 (0.0%) |
| Total | 70 (100.0%) | 96 (100.0%) |
Household Income by Mortgage Status in Bend
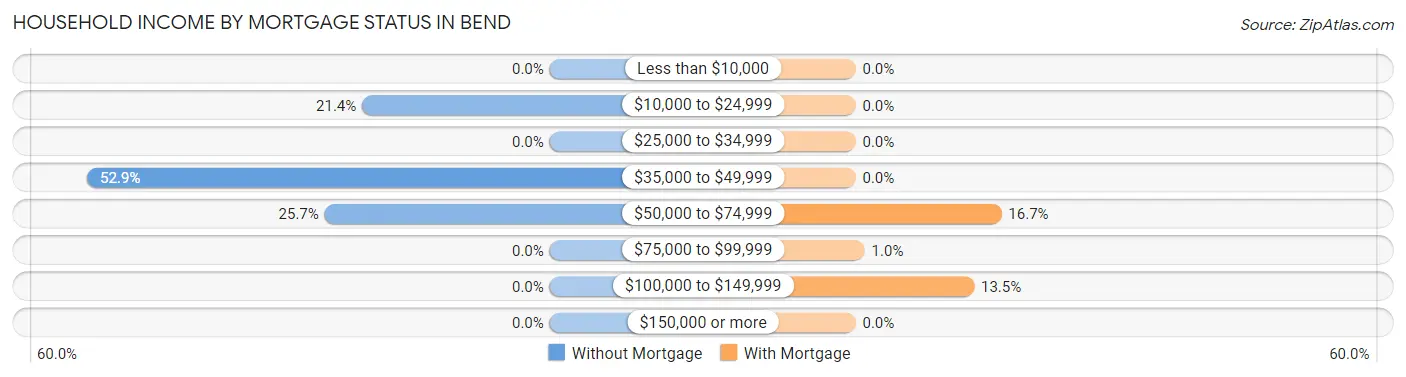
| Household Income | Without Mortgage | With Mortgage |
| Less than $10,000 | 0 (0.0%) | 0 (0.0%) |
| $10,000 to $24,999 | 15 (21.4%) | 0 (0.0%) |
| $25,000 to $34,999 | 0 (0.0%) | 0 (0.0%) |
| $35,000 to $49,999 | 37 (52.9%) | 0 (0.0%) |
| $50,000 to $74,999 | 18 (25.7%) | 16 (16.7%) |
| $75,000 to $99,999 | 0 (0.0%) | 1 (1.0%) |
| $100,000 to $149,999 | 0 (0.0%) | 13 (13.5%) |
| $150,000 or more | 0 (0.0%) | 0 (0.0%) |
| Total | 70 (100.0%) | 96 (100.0%) |
Property Value to Household Income Ratio in Bend
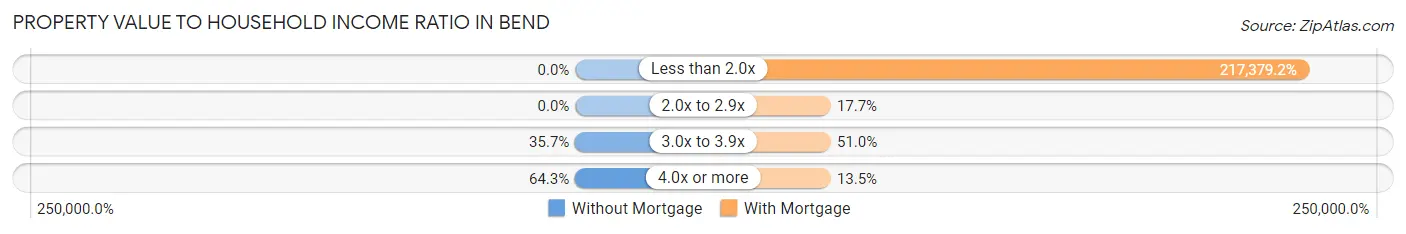
| Value-to-Income Ratio | Without Mortgage | With Mortgage |
| Less than 2.0x | 0 (0.0%) | 208,684 (217,379.2%) |
| 2.0x to 2.9x | 0 (0.0%) | 17 (17.7%) |
| 3.0x to 3.9x | 25 (35.7%) | 49 (51.0%) |
| 4.0x or more | 45 (64.3%) | 13 (13.5%) |
| Total | 70 (100.0%) | 96 (100.0%) |
Real Estate Taxes by Mortgage Status in Bend
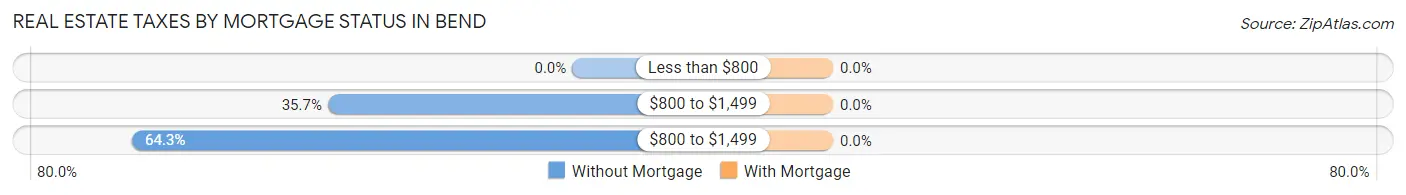
| Property Taxes | Without Mortgage | With Mortgage |
| Less than $800 | 0 (0.0%) | 0 (0.0%) |
| $800 to $1,499 | 25 (35.7%) | 0 (0.0%) |
| $800 to $1,499 | 45 (64.3%) | 0 (0.0%) |
| Total | 70 (100.0%) | 96 (100.0%) |
Health & Disability in Bend
Health Insurance Coverage by Age in Bend
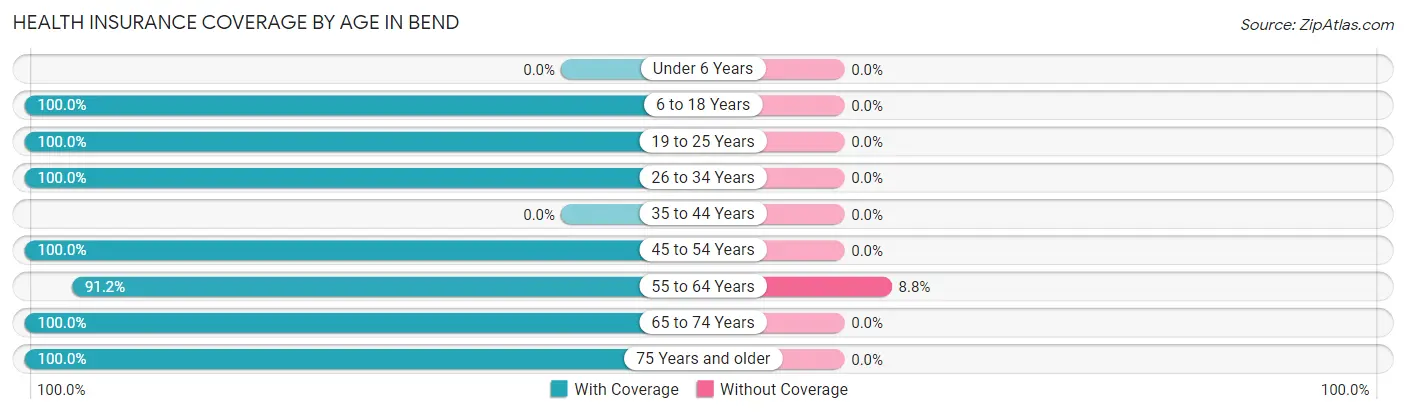
| Age Bracket | With Coverage | Without Coverage |
| Under 6 Years | 0 (0.0%) | 0 (0.0%) |
| 6 to 18 Years | 19 (100.0%) | 0 (0.0%) |
| 19 to 25 Years | 63 (100.0%) | 0 (0.0%) |
| 26 to 34 Years | 12 (100.0%) | 0 (0.0%) |
| 35 to 44 Years | 0 (0.0%) | 0 (0.0%) |
| 45 to 54 Years | 40 (100.0%) | 0 (0.0%) |
| 55 to 64 Years | 124 (91.2%) | 12 (8.8%) |
| 65 to 74 Years | 50 (100.0%) | 0 (0.0%) |
| 75 Years and older | 94 (100.0%) | 0 (0.0%) |
| Total | 402 (97.1%) | 12 (2.9%) |
Health Insurance Coverage by Citizenship Status in Bend
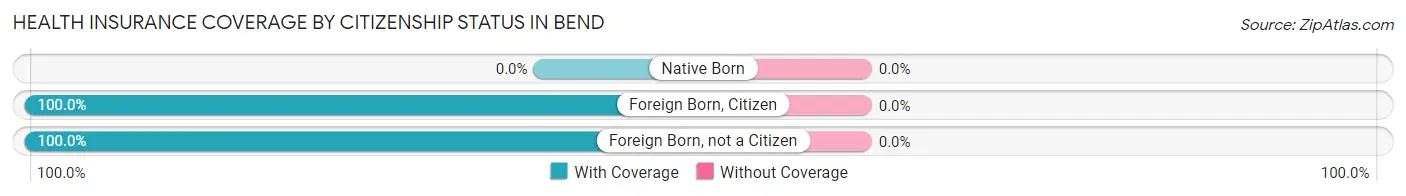
| Citizenship Status | With Coverage | Without Coverage |
| Native Born | 0 (0.0%) | 0 (0.0%) |
| Foreign Born, Citizen | 19 (100.0%) | 0 (0.0%) |
| Foreign Born, not a Citizen | 63 (100.0%) | 0 (0.0%) |
Health Insurance Coverage by Household Income in Bend
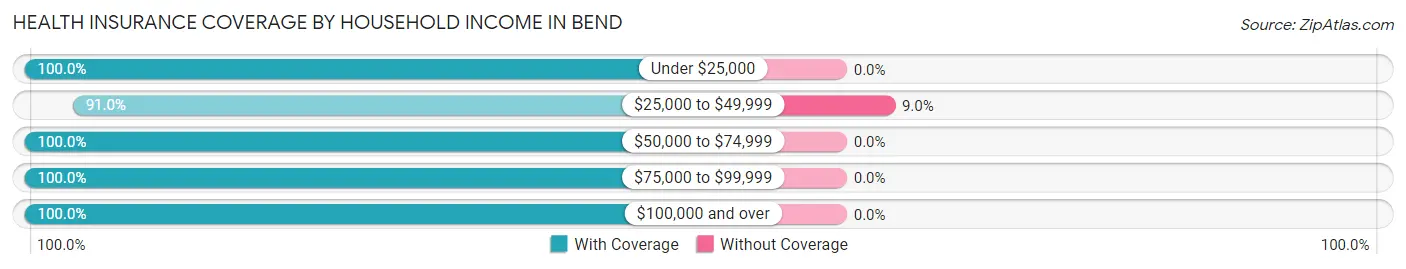
| Household Income | With Coverage | Without Coverage |
| Under $25,000 | 15 (100.0%) | 0 (0.0%) |
| $25,000 to $49,999 | 121 (91.0%) | 12 (9.0%) |
| $50,000 to $74,999 | 23 (100.0%) | 0 (0.0%) |
| $75,000 to $99,999 | 36 (100.0%) | 0 (0.0%) |
| $100,000 and over | 207 (100.0%) | 0 (0.0%) |
Public vs Private Health Insurance Coverage by Age in Bend
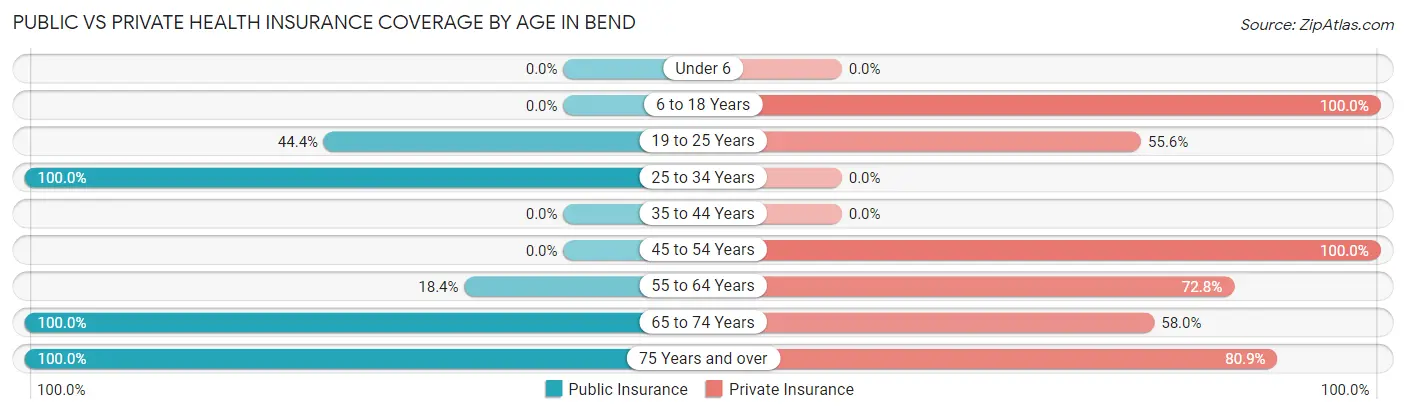
| Age Bracket | Public Insurance | Private Insurance |
| Under 6 | 0 (0.0%) | 0 (0.0%) |
| 6 to 18 Years | 0 (0.0%) | 19 (100.0%) |
| 19 to 25 Years | 28 (44.4%) | 35 (55.6%) |
| 25 to 34 Years | 12 (100.0%) | 0 (0.0%) |
| 35 to 44 Years | 0 (0.0%) | 0 (0.0%) |
| 45 to 54 Years | 0 (0.0%) | 40 (100.0%) |
| 55 to 64 Years | 25 (18.4%) | 99 (72.8%) |
| 65 to 74 Years | 50 (100.0%) | 29 (58.0%) |
| 75 Years and over | 94 (100.0%) | 76 (80.8%) |
| Total | 209 (50.5%) | 298 (72.0%) |
Disability Status by Sex by Age in Bend
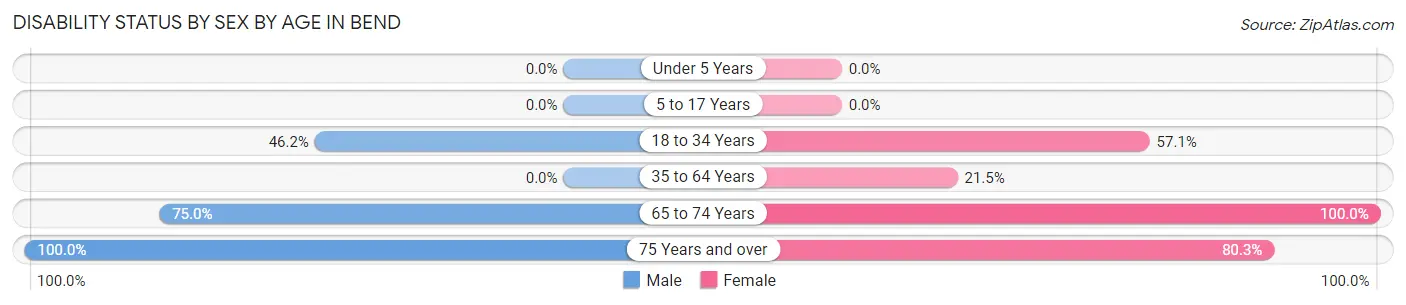
| Age Bracket | Male | Female |
| Under 5 Years | 0 (0.0%) | 0 (0.0%) |
| 5 to 17 Years | 0 (0.0%) | 0 (0.0%) |
| 18 to 34 Years | 12 (46.2%) | 28 (57.1%) |
| 35 to 64 Years | 0 (0.0%) | 26 (21.5%) |
| 65 to 74 Years | 36 (75.0%) | 2 (100.0%) |
| 75 Years and over | 13 (100.0%) | 65 (80.2%) |
Disability Class by Sex by Age in Bend
Disability Class: Hearing Difficulty
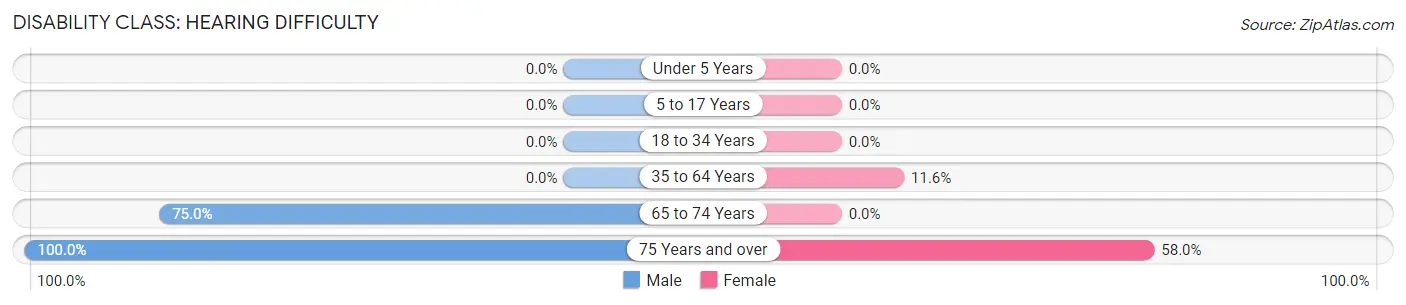
| Age Bracket | Male | Female |
| Under 5 Years | 0 (0.0%) | 0 (0.0%) |
| 5 to 17 Years | 0 (0.0%) | 0 (0.0%) |
| 18 to 34 Years | 0 (0.0%) | 0 (0.0%) |
| 35 to 64 Years | 0 (0.0%) | 14 (11.6%) |
| 65 to 74 Years | 36 (75.0%) | 0 (0.0%) |
| 75 Years and over | 13 (100.0%) | 47 (58.0%) |
Disability Class: Vision Difficulty
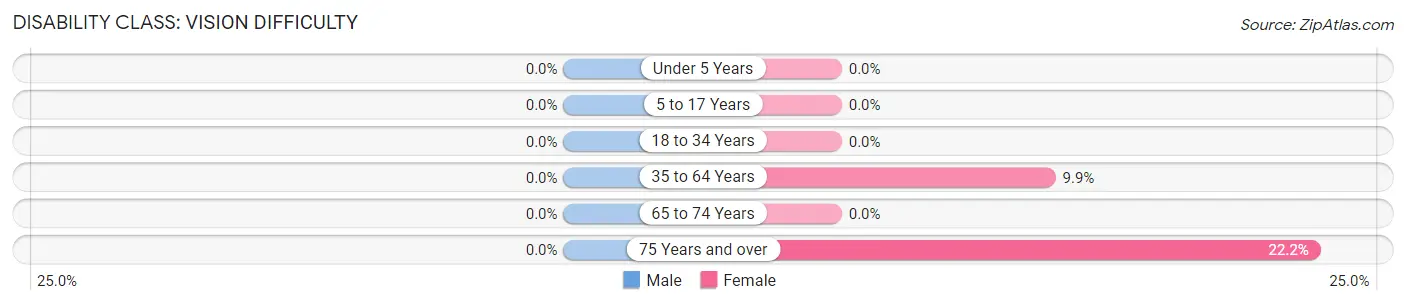
| Age Bracket | Male | Female |
| Under 5 Years | 0 (0.0%) | 0 (0.0%) |
| 5 to 17 Years | 0 (0.0%) | 0 (0.0%) |
| 18 to 34 Years | 0 (0.0%) | 0 (0.0%) |
| 35 to 64 Years | 0 (0.0%) | 12 (9.9%) |
| 65 to 74 Years | 0 (0.0%) | 0 (0.0%) |
| 75 Years and over | 0 (0.0%) | 18 (22.2%) |
Disability Class: Cognitive Difficulty
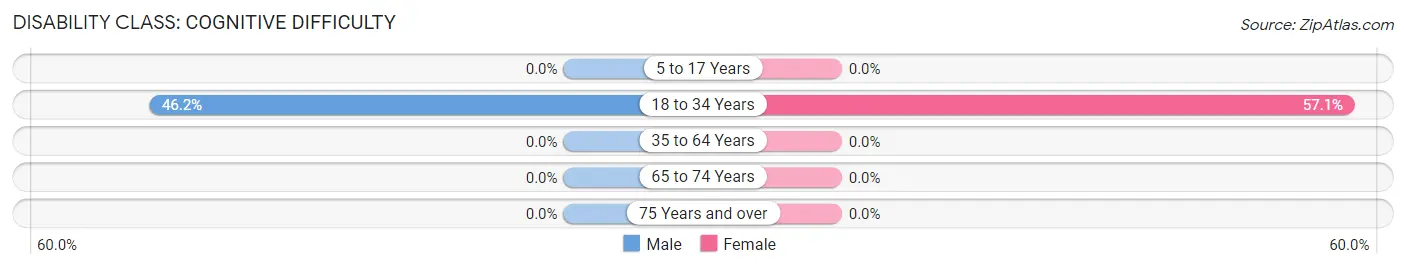
| Age Bracket | Male | Female |
| 5 to 17 Years | 0 (0.0%) | 0 (0.0%) |
| 18 to 34 Years | 12 (46.2%) | 28 (57.1%) |
| 35 to 64 Years | 0 (0.0%) | 0 (0.0%) |
| 65 to 74 Years | 0 (0.0%) | 0 (0.0%) |
| 75 Years and over | 0 (0.0%) | 0 (0.0%) |
Disability Class: Ambulatory Difficulty
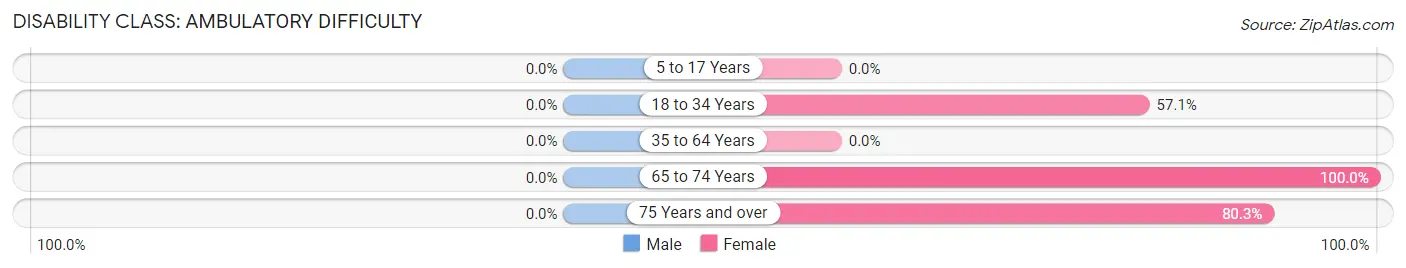
| Age Bracket | Male | Female |
| 5 to 17 Years | 0 (0.0%) | 0 (0.0%) |
| 18 to 34 Years | 0 (0.0%) | 28 (57.1%) |
| 35 to 64 Years | 0 (0.0%) | 0 (0.0%) |
| 65 to 74 Years | 0 (0.0%) | 2 (100.0%) |
| 75 Years and over | 0 (0.0%) | 65 (80.2%) |
Disability Class: Self-Care Difficulty
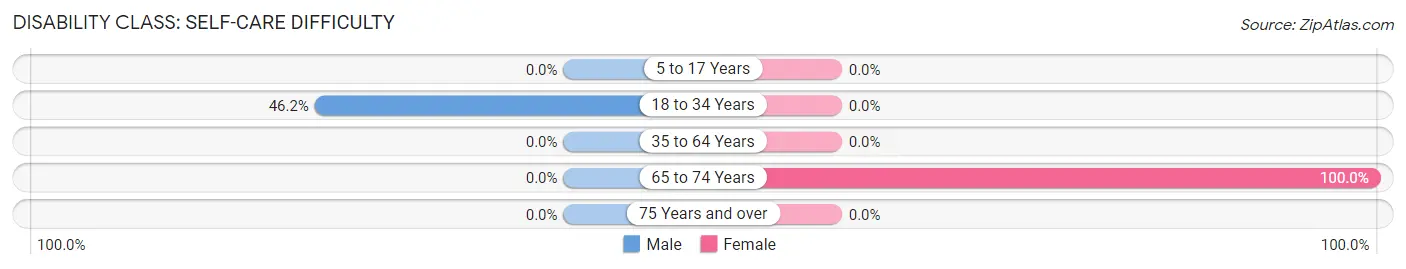
| Age Bracket | Male | Female |
| 5 to 17 Years | 0 (0.0%) | 0 (0.0%) |
| 18 to 34 Years | 12 (46.2%) | 0 (0.0%) |
| 35 to 64 Years | 0 (0.0%) | 0 (0.0%) |
| 65 to 74 Years | 0 (0.0%) | 2 (100.0%) |
| 75 Years and over | 0 (0.0%) | 0 (0.0%) |
Technology Access in Bend
Computing Device Access in Bend
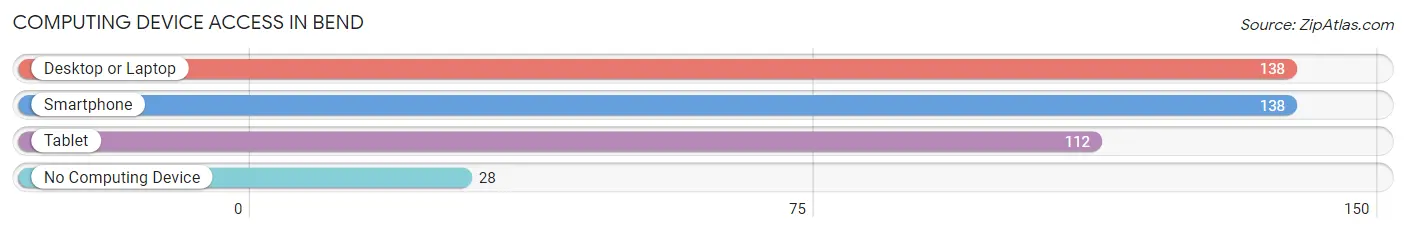
| Device Type | # Households | % Households |
| Desktop or Laptop | 138 | 83.1% |
| Smartphone | 138 | 83.1% |
| Tablet | 112 | 67.5% |
| No Computing Device | 28 | 16.9% |
| Total | 166 | 100.0% |
Internet Access in Bend
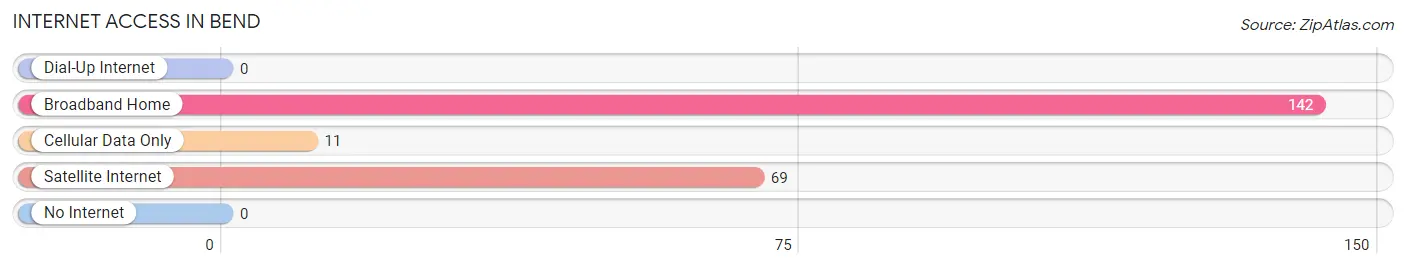
| Internet Type | # Households | % Households |
| Dial-Up Internet | 0 | 0.0% |
| Broadband Home | 142 | 85.5% |
| Cellular Data Only | 11 | 6.6% |
| Satellite Internet | 69 | 41.6% |
| No Internet | 0 | 0.0% |
| Total | 166 | 100.0% |
Bend Summary
Bend, Oregon is a city located in Deschutes County in the state of Oregon. It is the county seat and the largest city in the county. The city is located on the eastern edge of the Cascade Range, along the Deschutes River. Bend is a popular tourist destination due to its proximity to several ski resorts, lakes, and rivers. The city has a population of 81,236 as of the 2020 census, making it the fifth-largest city in the state.
Geography
Bend is located in the high desert of Central Oregon, at an elevation of 3,623 feet (1,105 m). The city is situated on the eastern edge of the Cascade Range, along the Deschutes River. The city is surrounded by mountains, including the Three Sisters to the north, Mount Bachelor to the west, and the Cascade Range to the east. The city is located in the rain shadow of the Cascades, resulting in a semi-arid climate with low precipitation and hot summers.
Economy
Bend is a major economic center in Central Oregon. The city is home to several large employers, including Deschutes County, St. Charles Medical Center, and the Bend-La Pine School District. The city is also home to a number of technology companies, including BendBroadband, Bend Research, and BendTec. Tourism is also a major industry in Bend, with the city being a popular destination for outdoor recreation.
Demographics
As of the 2020 census, Bend had a population of 81,236. The racial makeup of the city was 87.2% White, 2.2% Black or African American, 0.7% Native American, 3.2% Asian, 0.2% Pacific Islander, 3.3% from other races, and 2.4% from two or more races. Hispanic or Latino of any race were 8.2% of the population.
The median income for a household in Bend was $60,845, and the median income for a family was $71,845. The per capita income for the city was $32,845. About 11.2% of families and 15.2% of the population were below the poverty line, including 22.2% of those under age 18 and 8.2% of those age 65 or over.
Conclusion
Bend, Oregon is a city located in Deschutes County in the state of Oregon. It is the county seat and the largest city in the county. The city is located on the eastern edge of the Cascade Range, along the Deschutes River. Bend is a popular tourist destination due to its proximity to several ski resorts, lakes, and rivers. The city has a population of 81,236 as of the 2020 census, making it the fifth-largest city in the state. Bend is a major economic center in Central Oregon, with a number of large employers and a thriving tourism industry. The city has a diverse population, with a median income of $60,845 and a per capita income of $32,845.
Common Questions
What is Per Capita Income in Bend?
Per Capita income in Bend is $50,562.
What is Inequality or Gini Index in Bend?
Inequality or Gini Index in Bend is 0.44.
What is the Total Population of Bend?
Total Population of Bend is 414.
What is the Total Male Population of Bend?
Total Male Population of Bend is 151.
What is the Total Female Population of Bend?
Total Female Population of Bend is 263.
What is the Ratio of Males per 100 Females in Bend?
There are 57.41 Males per 100 Females in Bend.
What is the Ratio of Females per 100 Males in Bend?
There are 174.17 Females per 100 Males in Bend.
What is the Median Population Age in Bend?
Median Population Age in Bend is 61.7 Years.
What is the Average Family Size in Bend
Average Family Size in Bend is 2.9 People.
What is the Average Household Size in Bend
Average Household Size in Bend is 2.5 People.
How Large is the Labor Force in Bend?
There are 172 People in the Labor Forcein in Bend.
What is the Percentage of People in the Labor Force in Bend?
41.5% of People are in the Labor Force in Bend.