Cities with the Most Immigrants from Lithuania in California
RELATED REPORTS & OPTIONS
Lithuania
California
Compare Cities
Map of Cities with the Most Immigrants from Lithuania in California
0
600
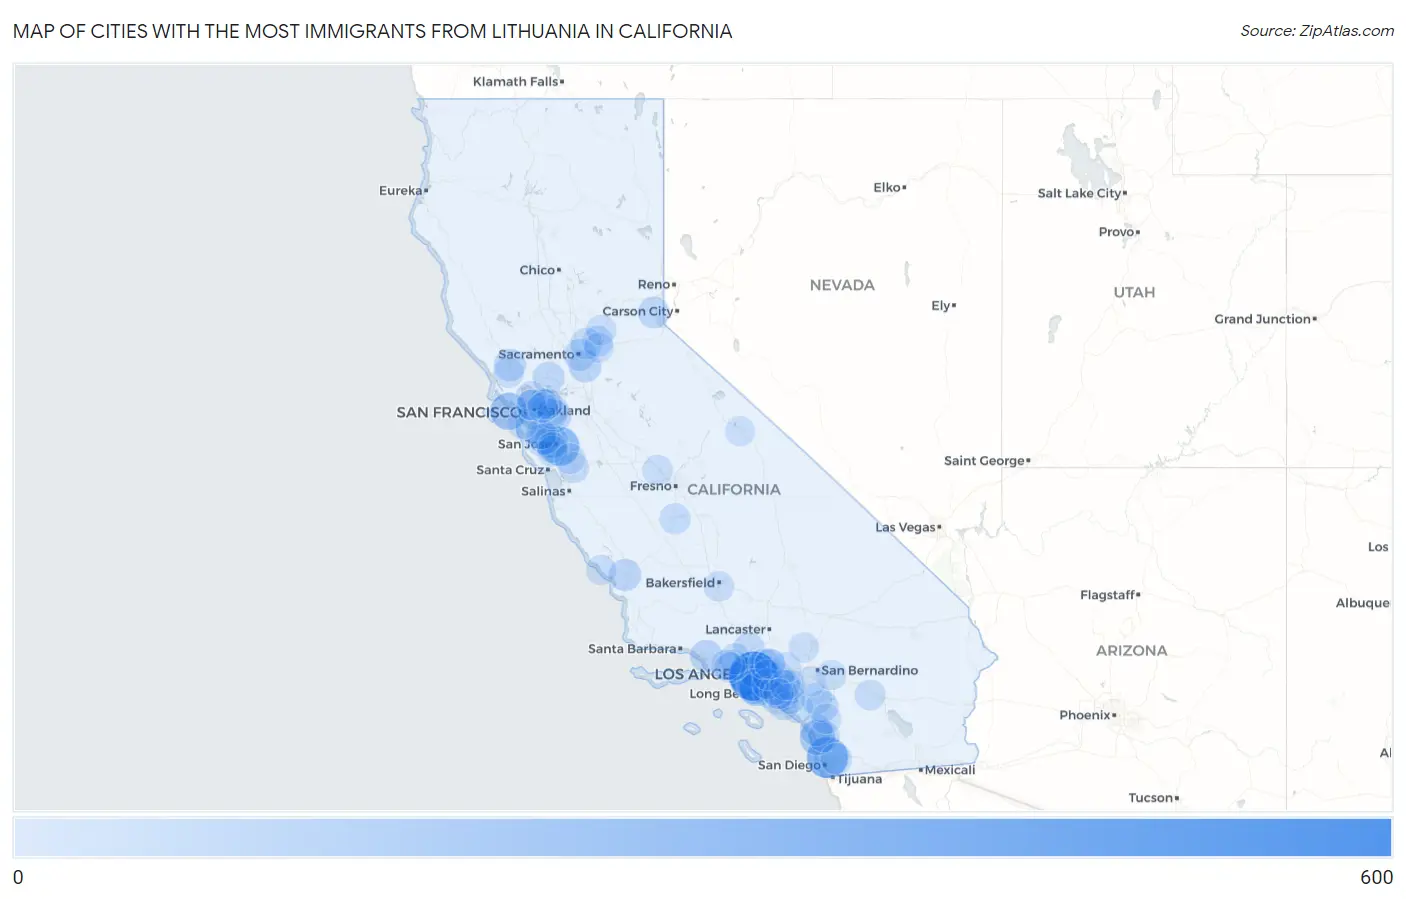
Cities with the Most Immigrants from Lithuania in California
| City | Lithuania | vs State | vs National | |
| 1. | Los Angeles | 512 | 3,665(13.97%)#1 | 33,942(1.51%)#5 |
| 2. | San Diego | 285 | 3,665(7.78%)#2 | 33,942(0.84%)#12 |
| 3. | Santa Monica | 231 | 3,665(6.30%)#3 | 33,942(0.68%)#18 |
| 4. | San Jose | 227 | 3,665(6.19%)#4 | 33,942(0.67%)#20 |
| 5. | San Francisco | 178 | 3,665(4.86%)#5 | 33,942(0.52%)#28 |
| 6. | Redondo Beach | 176 | 3,665(4.80%)#6 | 33,942(0.52%)#29 |
| 7. | Carlsbad | 133 | 3,665(3.63%)#7 | 33,942(0.39%)#37 |
| 8. | Santa Clara | 89 | 3,665(2.43%)#8 | 33,942(0.26%)#66 |
| 9. | Beverly Hills | 70 | 3,665(1.91%)#9 | 33,942(0.21%)#86 |
| 10. | San Buenaventura Ventura | 65 | 3,665(1.77%)#10 | 33,942(0.19%)#95 |
| 11. | Elk Grove | 61 | 3,665(1.66%)#11 | 33,942(0.18%)#102 |
| 12. | Dublin | 56 | 3,665(1.53%)#12 | 33,942(0.16%)#116 |
| 13. | Oceanside | 55 | 3,665(1.50%)#13 | 33,942(0.16%)#117 |
| 14. | Atascadero | 53 | 3,665(1.45%)#14 | 33,942(0.16%)#122 |
| 15. | Santa Rosa | 49 | 3,665(1.34%)#15 | 33,942(0.14%)#134 |
| 16. | Sacramento | 48 | 3,665(1.31%)#16 | 33,942(0.14%)#136 |
| 17. | Manhattan Beach | 45 | 3,665(1.23%)#17 | 33,942(0.13%)#140 |
| 18. | Santa Clarita | 42 | 3,665(1.15%)#18 | 33,942(0.12%)#149 |
| 19. | Suisun City | 42 | 3,665(1.15%)#19 | 33,942(0.12%)#152 |
| 20. | San Marcos | 41 | 3,665(1.12%)#20 | 33,942(0.12%)#156 |
| 21. | Sunnyside Tahoe City | 40 | 3,665(1.09%)#21 | 33,942(0.12%)#164 |
| 22. | Murrieta | 39 | 3,665(1.06%)#22 | 33,942(0.11%)#166 |
| 23. | Antelope | 37 | 3,665(1.01%)#23 | 33,942(0.11%)#171 |
| 24. | Fullerton | 35 | 3,665(0.95%)#24 | 33,942(0.10%)#185 |
| 25. | San Mateo | 35 | 3,665(0.95%)#25 | 33,942(0.10%)#186 |
| 26. | El Cajon | 34 | 3,665(0.93%)#26 | 33,942(0.10%)#190 |
| 27. | Palo Alto | 33 | 3,665(0.90%)#27 | 33,942(0.10%)#196 |
| 28. | Lake Elsinore | 32 | 3,665(0.87%)#28 | 33,942(0.09%)#200 |
| 29. | Pasadena | 31 | 3,665(0.85%)#29 | 33,942(0.09%)#204 |
| 30. | Mountain View | 31 | 3,665(0.85%)#30 | 33,942(0.09%)#205 |
| 31. | Alameda | 30 | 3,665(0.82%)#31 | 33,942(0.09%)#212 |
| 32. | Ladera Ranch | 29 | 3,665(0.79%)#32 | 33,942(0.09%)#226 |
| 33. | Simi Valley | 28 | 3,665(0.76%)#33 | 33,942(0.08%)#229 |
| 34. | Lemoore | 27 | 3,665(0.74%)#34 | 33,942(0.08%)#242 |
| 35. | Los Gatos | 25 | 3,665(0.68%)#35 | 33,942(0.07%)#255 |
| 36. | Granite Bay | 25 | 3,665(0.68%)#36 | 33,942(0.07%)#258 |
| 37. | Long Beach | 24 | 3,665(0.65%)#37 | 33,942(0.07%)#264 |
| 38. | La Canada Flintridge | 24 | 3,665(0.65%)#38 | 33,942(0.07%)#270 |
| 39. | Torrance | 22 | 3,665(0.60%)#39 | 33,942(0.06%)#279 |
| 40. | Berkeley | 22 | 3,665(0.60%)#40 | 33,942(0.06%)#280 |
| 41. | Santa Ana | 19 | 3,665(0.52%)#41 | 33,942(0.06%)#308 |
| 42. | Orange | 19 | 3,665(0.52%)#42 | 33,942(0.06%)#312 |
| 43. | Danville | 19 | 3,665(0.52%)#43 | 33,942(0.06%)#316 |
| 44. | Menlo Park | 18 | 3,665(0.49%)#44 | 33,942(0.05%)#331 |
| 45. | Oak Park | 17 | 3,665(0.46%)#45 | 33,942(0.05%)#346 |
| 46. | Westlake Village | 17 | 3,665(0.46%)#46 | 33,942(0.05%)#352 |
| 47. | Campbell | 15 | 3,665(0.41%)#47 | 33,942(0.04%)#378 |
| 48. | Castle Hill | 15 | 3,665(0.41%)#48 | 33,942(0.04%)#385 |
| 49. | Huntington Beach | 14 | 3,665(0.38%)#49 | 33,942(0.04%)#387 |
| 50. | Gilroy | 14 | 3,665(0.38%)#50 | 33,942(0.04%)#392 |
| 51. | Palm Desert | 14 | 3,665(0.38%)#51 | 33,942(0.04%)#393 |
| 52. | Morgan Hill | 14 | 3,665(0.38%)#52 | 33,942(0.04%)#394 |
| 53. | Pinon Hills | 14 | 3,665(0.38%)#53 | 33,942(0.04%)#404 |
| 54. | San Ramon | 13 | 3,665(0.35%)#54 | 33,942(0.04%)#414 |
| 55. | Newport Beach | 13 | 3,665(0.35%)#55 | 33,942(0.04%)#415 |
| 56. | Bakersfield | 12 | 3,665(0.33%)#56 | 33,942(0.04%)#437 |
| 57. | Irvine | 12 | 3,665(0.33%)#57 | 33,942(0.04%)#438 |
| 58. | Walnut Creek | 12 | 3,665(0.33%)#58 | 33,942(0.04%)#442 |
| 59. | Madera | 12 | 3,665(0.33%)#59 | 33,942(0.04%)#443 |
| 60. | Hacienda Heights | 12 | 3,665(0.33%)#60 | 33,942(0.04%)#444 |
| 61. | Paramount | 12 | 3,665(0.33%)#61 | 33,942(0.04%)#445 |
| 62. | Cypress | 12 | 3,665(0.33%)#62 | 33,942(0.04%)#446 |
| 63. | Pacifica | 12 | 3,665(0.33%)#63 | 33,942(0.04%)#448 |
| 64. | Lafayette | 12 | 3,665(0.33%)#64 | 33,942(0.04%)#451 |
| 65. | East Los Angeles | 10 | 3,665(0.27%)#65 | 33,942(0.03%)#490 |
| 66. | Auburn | 10 | 3,665(0.27%)#66 | 33,942(0.03%)#501 |
| 67. | Glendale | 9 | 3,665(0.25%)#67 | 33,942(0.03%)#514 |
| 68. | Thousand Oaks | 9 | 3,665(0.25%)#68 | 33,942(0.03%)#515 |
| 69. | Yorba Linda | 9 | 3,665(0.25%)#69 | 33,942(0.03%)#519 |
| 70. | Placentia | 8 | 3,665(0.22%)#70 | 33,942(0.02%)#559 |
| 71. | Cambria | 8 | 3,665(0.22%)#71 | 33,942(0.02%)#578 |
| 72. | Tara Hills | 8 | 3,665(0.22%)#72 | 33,942(0.02%)#581 |
| 73. | Yucaipa | 6 | 3,665(0.16%)#73 | 33,942(0.02%)#623 |
| 74. | Glendora | 6 | 3,665(0.16%)#74 | 33,942(0.02%)#627 |
| 75. | Rainbow | 6 | 3,665(0.16%)#75 | 33,942(0.02%)#640 |
| 76. | Garden Grove | 5 | 3,665(0.14%)#76 | 33,942(0.01%)#644 |
| 77. | Altadena | 5 | 3,665(0.14%)#77 | 33,942(0.01%)#646 |
| 78. | Albany | 5 | 3,665(0.14%)#78 | 33,942(0.01%)#653 |
| 79. | Cotati | 5 | 3,665(0.14%)#79 | 33,942(0.01%)#654 |
| 80. | Moraga | 4 | 3,665(0.11%)#80 | 33,942(0.01%)#669 |
| 81. | Phelan | 3 | 3,665(0.08%)#81 | 33,942(0.01%)#678 |
| 82. | Folsom | 2 | 3,665(0.05%)#82 | 33,942(0.01%)#689 |
| 83. | Riverside | 1 | 3,665(0.03%)#83 | 33,942(0.00%)#702 |
| 84. | Swall Meadows | 1 | 3,665(0.03%)#84 | 33,942(0.00%)#710 |
Common Questions
What are the Top 10 Cities with the Most Immigrants from Lithuania in California?
Top 10 Cities with the Most Immigrants from Lithuania in California are:
#1
512
#2
285
#3
231
#4
227
#5
178
#6
176
#7
133
#8
89
#9
70
#10
65
What city has the Most Immigrants from Lithuania in California?
Los Angeles has the Most Immigrants from Lithuania in California with 512.
What is the Total Immigrants from Lithuania in the State of California?
Total Immigrants from Lithuania in California is 3,665.
What is the Total Immigrants from Lithuania in the United States?
Total Immigrants from Lithuania in the United States is 33,942.