Cities with the Highest Percentage of Population Employed in Architecture & Engineering in California
RELATED REPORTS & OPTIONS
Architecture & Engineering
California
Compare Cities
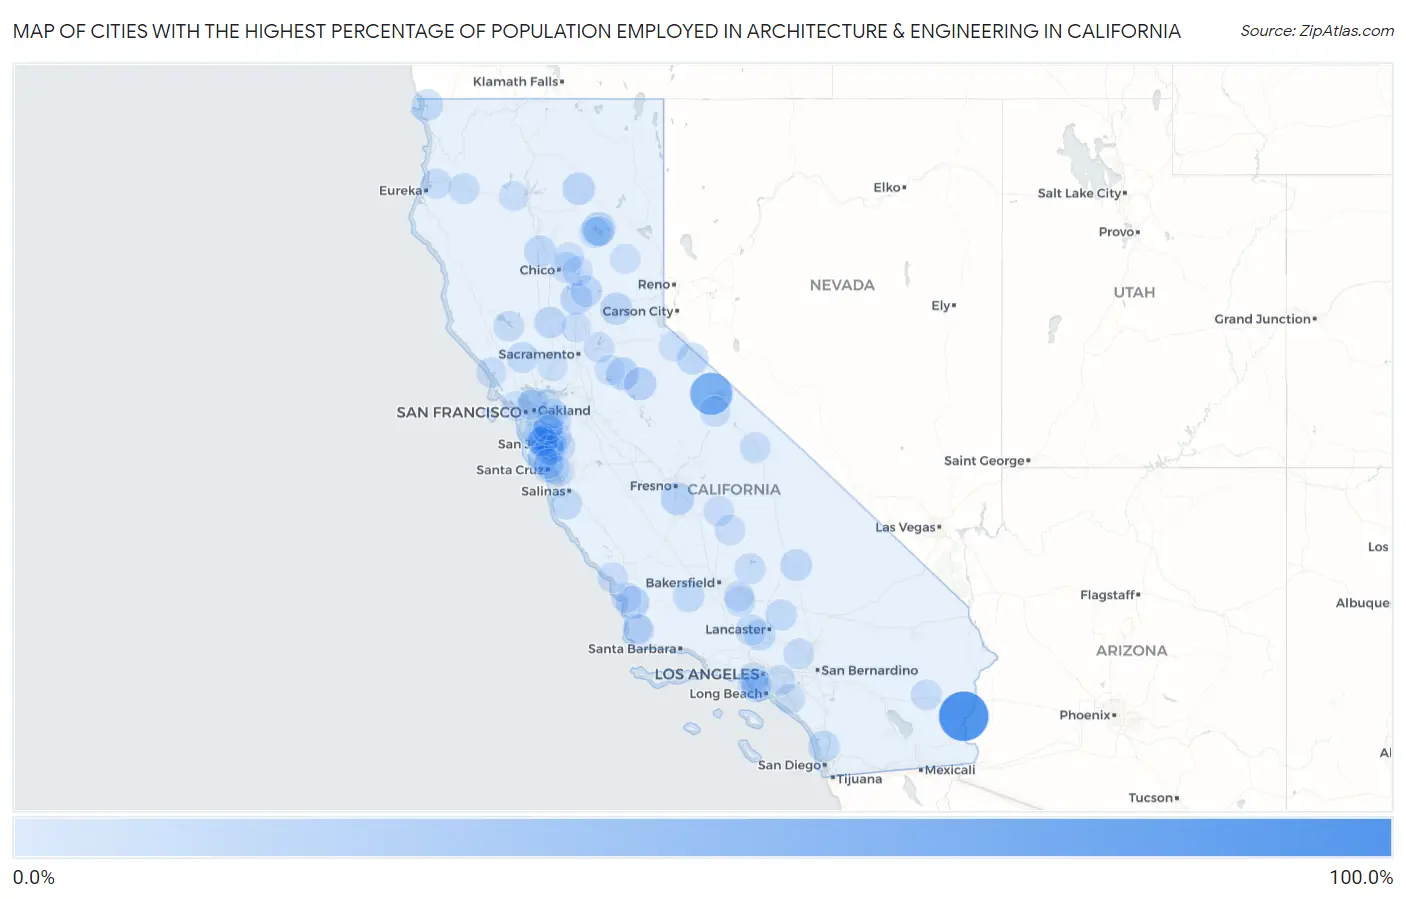
Map of Cities with the Highest Percentage of Population Employed in Architecture & Engineering in California
0.0%
100.0%
Cities with the Highest Percentage of Population Employed in Architecture & Engineering in California
| City | % Employed | vs State | vs National | |
| 1. | Palo Verde | 100.0% | 2.6%(+97.4)#1 | 2.1%(+97.9)#4 |
| 2. | Goodmanville | 100.0% | 2.6%(+97.4)#2 | 2.1%(+97.9)#6 |
| 3. | Mono City | 63.1% | 2.6%(+60.5)#3 | 2.1%(+60.9)#17 |
| 4. | Mountain Meadows | 28.8% | 2.6%(+26.2)#4 | 2.1%(+26.7)#63 |
| 5. | Lake Almanor Peninsula | 21.2% | 2.6%(+18.6)#5 | 2.1%(+19.0)#121 |
| 6. | Monmouth | 19.4% | 2.6%(+16.8)#6 | 2.1%(+17.2)#140 |
| 7. | Los Berros | 19.0% | 2.6%(+16.5)#7 | 2.1%(+16.9)#146 |
| 8. | Mokelumne Hill | 17.8% | 2.6%(+15.2)#8 | 2.1%(+15.6)#159 |
| 9. | Forest Meadows | 17.6% | 2.6%(+15.1)#9 | 2.1%(+15.5)#164 |
| 10. | El Centro Naval Air Facility | 17.5% | 2.6%(+15.0)#10 | 2.1%(+15.4)#165 |
| 11. | Hat Creek | 16.7% | 2.6%(+14.1)#11 | 2.1%(+14.5)#187 |
| 12. | Petaluma Center | 16.3% | 2.6%(+13.8)#12 | 2.1%(+14.2)#193 |
| 13. | Dutch Flat | 15.4% | 2.6%(+12.8)#13 | 2.1%(+13.2)#218 |
| 14. | Honcut | 14.6% | 2.6%(+12.0)#14 | 2.1%(+12.4)#242 |
| 15. | Ridgecrest | 13.8% | 2.6%(+11.3)#15 | 2.1%(+11.7)#274 |
| 16. | Rackerby | 13.8% | 2.6%(+11.2)#16 | 2.1%(+11.6)#276 |
| 17. | Cupertino | 13.8% | 2.6%(+11.2)#17 | 2.1%(+11.6)#277 |
| 18. | Richfield | 13.5% | 2.6%(+10.9)#18 | 2.1%(+11.3)#288 |
| 19. | Walker | 12.8% | 2.6%(+10.3)#19 | 2.1%(+10.7)#314 |
| 20. | Del Dios | 12.8% | 2.6%(+10.2)#20 | 2.1%(+10.6)#316 |
| 21. | College City | 12.7% | 2.6%(+10.1)#21 | 2.1%(+10.5)#322 |
| 22. | Fairbanks Ranch | 12.1% | 2.6%(+9.59)#22 | 2.1%(+10.00)#346 |
| 23. | Fellows | 12.0% | 2.6%(+9.45)#23 | 2.1%(+9.85)#353 |
| 24. | Green Valley Cdp Los Angeles County | 11.7% | 2.6%(+9.11)#24 | 2.1%(+9.51)#377 |
| 25. | Carmel Valley Village | 11.5% | 2.6%(+8.95)#25 | 2.1%(+9.35)#389 |
| 26. | Smith River | 11.2% | 2.6%(+8.69)#26 | 2.1%(+9.10)#403 |
| 27. | Leona Valley | 11.1% | 2.6%(+8.50)#27 | 2.1%(+8.91)#419 |
| 28. | Edwards Afb | 10.9% | 2.6%(+8.30)#28 | 2.1%(+8.71)#433 |
| 29. | Loyola | 10.8% | 2.6%(+8.27)#29 | 2.1%(+8.67)#435 |
| 30. | Lake Almanor West | 10.5% | 2.6%(+7.97)#30 | 2.1%(+8.38)#449 |
| 31. | Woody | 10.5% | 2.6%(+7.97)#31 | 2.1%(+8.38)#451 |
| 32. | Cedar Flat | 10.5% | 2.6%(+7.92)#32 | 2.1%(+8.33)#454 |
| 33. | Ridgecrest Heights | 10.3% | 2.6%(+7.76)#33 | 2.1%(+8.17)#471 |
| 34. | Lake Hughes | 10.1% | 2.6%(+7.59)#34 | 2.1%(+7.99)#484 |
| 35. | Deer Park | 9.6% | 2.6%(+7.03)#35 | 2.1%(+7.43)#528 |
| 36. | San Miguel Cdp Contra Costa County | 9.5% | 2.6%(+6.93)#36 | 2.1%(+7.33)#540 |
| 37. | Saratoga | 9.2% | 2.6%(+6.69)#37 | 2.1%(+7.09)#553 |
| 38. | Bodfish | 9.2% | 2.6%(+6.61)#38 | 2.1%(+7.02)#557 |
| 39. | Sunnyvale | 9.2% | 2.6%(+6.60)#39 | 2.1%(+7.00)#559 |
| 40. | Burnt Ranch | 9.1% | 2.6%(+6.54)#40 | 2.1%(+6.94)#565 |
| 41. | Somis | 9.0% | 2.6%(+6.47)#41 | 2.1%(+6.88)#572 |
| 42. | Wilkerson | 9.0% | 2.6%(+6.46)#42 | 2.1%(+6.87)#575 |
| 43. | Clearlake Riviera | 8.9% | 2.6%(+6.31)#43 | 2.1%(+6.72)#600 |
| 44. | Stallion Springs | 8.8% | 2.6%(+6.23)#44 | 2.1%(+6.63)#610 |
| 45. | Butte Creek Canyon | 8.7% | 2.6%(+6.17)#45 | 2.1%(+6.58)#614 |
| 46. | Wrightwood | 8.7% | 2.6%(+6.12)#46 | 2.1%(+6.52)#619 |
| 47. | Desert Center | 8.6% | 2.6%(+6.02)#47 | 2.1%(+6.42)#630 |
| 48. | Santa Clara | 8.4% | 2.6%(+5.85)#48 | 2.1%(+6.25)#651 |
| 49. | Castle Hill | 8.4% | 2.6%(+5.80)#49 | 2.1%(+6.20)#659 |
| 50. | June Lake | 8.0% | 2.6%(+5.49)#50 | 2.1%(+5.89)#719 |
| 51. | Milpitas | 8.0% | 2.6%(+5.46)#51 | 2.1%(+5.87)#723 |
| 52. | Fremont | 8.0% | 2.6%(+5.41)#52 | 2.1%(+5.82)#727 |
| 53. | Blue Lake | 7.9% | 2.6%(+5.30)#53 | 2.1%(+5.70)#745 |
| 54. | Springville | 7.8% | 2.6%(+5.23)#54 | 2.1%(+5.64)#755 |
| 55. | Mountain View | 7.8% | 2.6%(+5.20)#55 | 2.1%(+5.60)#761 |
| 56. | Lemon Cove | 7.7% | 2.6%(+5.14)#56 | 2.1%(+5.54)#769 |
| 57. | Campbell | 7.6% | 2.6%(+5.07)#57 | 2.1%(+5.47)#787 |
| 58. | Bodega Bay | 7.6% | 2.6%(+5.00)#58 | 2.1%(+5.40)#801 |
| 59. | Los Altos | 7.4% | 2.6%(+4.81)#59 | 2.1%(+5.22)#833 |
| 60. | El Segundo | 7.4% | 2.6%(+4.80)#60 | 2.1%(+5.20)#837 |
| 61. | Pasatiempo | 7.3% | 2.6%(+4.77)#61 | 2.1%(+5.17)#840 |
| 62. | Palo Alto | 7.3% | 2.6%(+4.73)#62 | 2.1%(+5.13)#852 |
| 63. | Seacliff | 7.2% | 2.6%(+4.61)#63 | 2.1%(+5.02)#888 |
| 64. | Folsom | 7.1% | 2.6%(+4.59)#64 | 2.1%(+4.99)#901 |
| 65. | Atherton | 7.1% | 2.6%(+4.51)#65 | 2.1%(+4.91)#916 |
| 66. | La Habra Heights | 7.1% | 2.6%(+4.51)#66 | 2.1%(+4.91)#917 |
| 67. | Pismo Beach | 7.0% | 2.6%(+4.45)#67 | 2.1%(+4.86)#927 |
| 68. | Brookdale | 7.0% | 2.6%(+4.40)#68 | 2.1%(+4.80)#940 |
| 69. | San Jose | 7.0% | 2.6%(+4.40)#69 | 2.1%(+4.80)#941 |
| 70. | Pleasanton | 6.9% | 2.6%(+4.39)#70 | 2.1%(+4.79)#945 |
| 71. | Los Altos Hills | 6.9% | 2.6%(+4.35)#71 | 2.1%(+4.75)#958 |
| 72. | Yankee Hill | 6.9% | 2.6%(+4.34)#72 | 2.1%(+4.75)#959 |
| 73. | Lake Almanor Country Club | 6.8% | 2.6%(+4.28)#73 | 2.1%(+4.69)#975 |
| 74. | Cayucos | 6.8% | 2.6%(+4.21)#74 | 2.1%(+4.62)#989 |
| 75. | Del Aire | 6.7% | 2.6%(+4.18)#75 | 2.1%(+4.59)#993 |
| 76. | Aptos Hills Larkin Valley | 6.6% | 2.6%(+4.07)#76 | 2.1%(+4.47)#1,012 |
| 77. | Belmont | 6.5% | 2.6%(+3.90)#77 | 2.1%(+4.31)#1,060 |
| 78. | Bear Valley Springs | 6.4% | 2.6%(+3.86)#78 | 2.1%(+4.27)#1,080 |
| 79. | Harmony Grove | 6.4% | 2.6%(+3.83)#79 | 2.1%(+4.24)#1,089 |
| 80. | Ione | 6.3% | 2.6%(+3.73)#80 | 2.1%(+4.13)#1,124 |
| 81. | Mission Hills | 6.3% | 2.6%(+3.70)#81 | 2.1%(+4.10)#1,133 |
| 82. | Cromberg | 6.2% | 2.6%(+3.70)#82 | 2.1%(+4.10)#1,137 |
| 83. | Markleeville | 6.2% | 2.6%(+3.70)#83 | 2.1%(+4.10)#1,140 |
| 84. | Irvine | 6.2% | 2.6%(+3.66)#84 | 2.1%(+4.07)#1,154 |
| 85. | Muir Beach | 6.1% | 2.6%(+3.57)#85 | 2.1%(+3.97)#1,186 |
| 86. | Culver City | 6.1% | 2.6%(+3.56)#86 | 2.1%(+3.96)#1,192 |
| 87. | Monte Sereno | 6.1% | 2.6%(+3.54)#87 | 2.1%(+3.94)#1,197 |
| 88. | Forest Ranch | 6.1% | 2.6%(+3.53)#88 | 2.1%(+3.94)#1,199 |
| 89. | Redondo Beach | 6.1% | 2.6%(+3.50)#89 | 2.1%(+3.90)#1,212 |
| 90. | Rio Oso | 6.0% | 2.6%(+3.45)#90 | 2.1%(+3.85)#1,241 |
| 91. | Newark | 6.0% | 2.6%(+3.44)#91 | 2.1%(+3.85)#1,244 |
| 92. | Kensington | 5.9% | 2.6%(+3.30)#92 | 2.1%(+3.71)#1,310 |
| 93. | French Gulch | 5.8% | 2.6%(+3.27)#93 | 2.1%(+3.68)#1,330 |
| 94. | Union City | 5.8% | 2.6%(+3.27)#94 | 2.1%(+3.67)#1,333 |
| 95. | Boulder Creek | 5.8% | 2.6%(+3.22)#95 | 2.1%(+3.63)#1,351 |
| 96. | Hartley | 5.7% | 2.6%(+3.16)#96 | 2.1%(+3.56)#1,388 |
| 97. | San Ramon | 5.7% | 2.6%(+3.14)#97 | 2.1%(+3.55)#1,395 |
| 98. | Scotts Valley | 5.6% | 2.6%(+3.09)#98 | 2.1%(+3.49)#1,420 |
| 99. | Vandenberg Village | 5.6% | 2.6%(+3.07)#99 | 2.1%(+3.48)#1,429 |
| 100. | Albany | 5.6% | 2.6%(+3.05)#100 | 2.1%(+3.45)#1,445 |
Common Questions
What are the Top 10 Cities with the Highest Percentage of Population Employed in Architecture & Engineering in California?
Top 10 Cities with the Highest Percentage of Population Employed in Architecture & Engineering in California are:
#1
100.0%
#2
63.1%
#3
21.2%
#4
19.4%
#5
19.0%
#6
17.8%
#7
17.6%
#8
16.7%
#9
15.4%
#10
14.6%
What city has the Highest Percentage of Population Employed in Architecture & Engineering in California?
Palo Verde has the Highest Percentage of Population Employed in Architecture & Engineering in California with 100.0%.
What is the Percentage of Population Employed in Architecture & Engineering in the State of California?
Percentage of Population Employed in Architecture & Engineering in California is 2.6%.
What is the Percentage of Population Employed in Architecture & Engineering in the United States?
Percentage of Population Employed in Architecture & Engineering in the United States is 2.1%.