Cities with the Highest Percentage of Immigrants from Colombia in California
RELATED REPORTS & OPTIONS
Colombia
California
Compare Cities
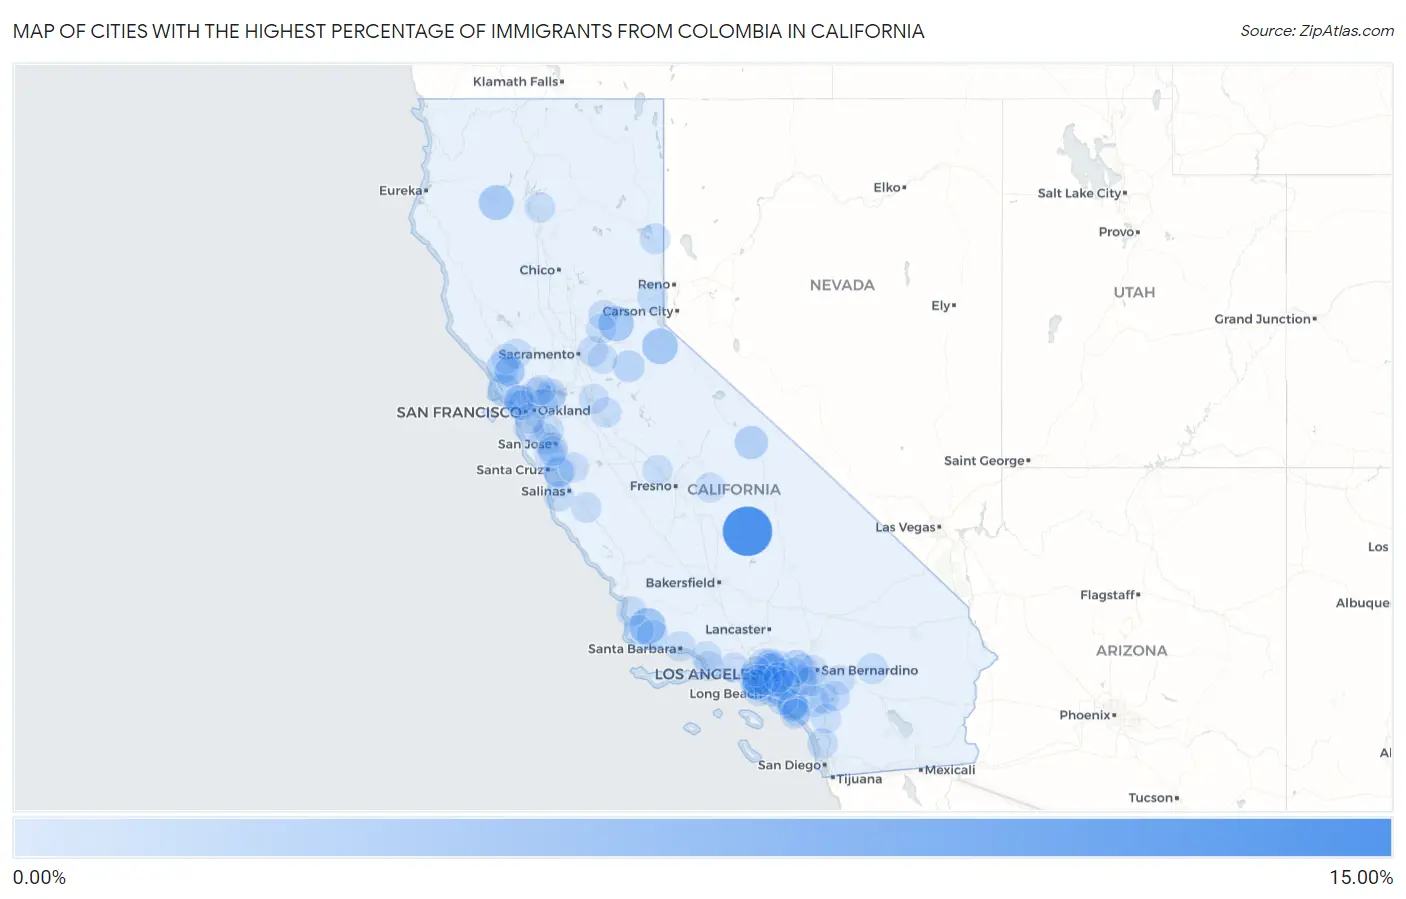
Map of Cities with the Highest Percentage of Immigrants from Colombia in California
0.00%
15.00%
Cities with the Highest Percentage of Immigrants from Colombia in California
| City | Colombia | vs State | vs National | |
| 1. | Ponderosa | 13.79% | 0.14%(+13.7)#-1 | 0.26%(+13.5)#0 |
| 2. | Los Alamos | 4.44% | 0.14%(+4.30)#0 | 0.26%(+4.18)#1 |
| 3. | Kirkwood | 4.02% | 0.14%(+3.88)#1 | 0.26%(+3.76)#2 |
| 4. | Foresthill | 3.65% | 0.14%(+3.51)#2 | 0.26%(+3.39)#3 |
| 5. | Douglas City | 3.35% | 0.14%(+3.21)#3 | 0.26%(+3.09)#4 |
| 6. | West Bishop | 2.39% | 0.14%(+2.25)#4 | 0.26%(+2.13)#5 |
| 7. | Point Reyes Station | 2.09% | 0.14%(+1.95)#5 | 0.26%(+1.83)#6 |
| 8. | San Antonio Heights | 1.85% | 0.14%(+1.71)#6 | 0.26%(+1.59)#7 |
| 9. | Sebastopol | 1.60% | 0.14%(+1.46)#7 | 0.26%(+1.34)#8 |
| 10. | Red Corral | 1.42% | 0.14%(+1.28)#19 | 0.26%(+1.16)#500 |
| 11. | La Palma | 1.00% | 0.14%(+0.858)#153 | 0.26%(+0.739)#1,961 |
| 12. | Lakeland Village | 0.94% | 0.14%(+0.797)#154 | 0.26%(+0.677)#1,962 |
| 13. | Del Aire | 0.90% | 0.14%(+0.761)#155 | 0.26%(+0.642)#1,963 |
| 14. | Buellton | 0.87% | 0.14%(+0.733)#156 | 0.26%(+0.614)#1,964 |
| 15. | La Canada Flintridge | 0.83% | 0.14%(+0.689)#157 | 0.26%(+0.569)#1,965 |
| 16. | Joshua Tree | 0.79% | 0.14%(+0.645)#158 | 0.26%(+0.525)#1,966 |
| 17. | Herlong | 0.78% | 0.14%(+0.641)#159 | 0.26%(+0.521)#1,967 |
| 18. | Laguna Hills | 0.71% | 0.14%(+0.569)#160 | 0.26%(+0.449)#1,968 |
| 19. | El Macero | 0.69% | 0.14%(+0.551)#161 | 0.26%(+0.431)#1,969 |
| 20. | Aptos Hills Larkin Valley | 0.69% | 0.14%(+0.547)#162 | 0.26%(+0.427)#1,970 |
| 21. | Mountain View | 0.68% | 0.14%(+0.537)#223 | 0.26%(+0.417)#2,459 |
| 22. | Bradbury | 0.65% | 0.14%(+0.512)#224 | 0.26%(+0.392)#2,460 |
| 23. | Truckee | 0.64% | 0.14%(+0.503)#225 | 0.26%(+0.383)#2,461 |
| 24. | Laguna Woods | 0.62% | 0.14%(+0.484)#226 | 0.26%(+0.365)#2,462 |
| 25. | View Park Windsor Hills | 0.60% | 0.14%(+0.460)#227 | 0.26%(+0.340)#2,463 |
| 26. | Brea | 0.60% | 0.14%(+0.458)#322 | 0.26%(+0.339)#3,039 |
| 27. | Cotati | 0.60% | 0.14%(+0.456)#323 | 0.26%(+0.336)#3,040 |
| 28. | Rossmoor | 0.59% | 0.14%(+0.447)#324 | 0.26%(+0.328)#3,041 |
| 29. | Altadena | 0.56% | 0.14%(+0.419)#325 | 0.26%(+0.299)#3,042 |
| 30. | Lexington Hills | 0.54% | 0.14%(+0.401)#326 | 0.26%(+0.281)#3,043 |
| 31. | Campbell | 0.54% | 0.14%(+0.398)#327 | 0.26%(+0.278)#3,044 |
| 32. | Guadalupe | 0.53% | 0.14%(+0.392)#328 | 0.26%(+0.272)#3,045 |
| 33. | Mission Canyon | 0.52% | 0.14%(+0.380)#329 | 0.26%(+0.260)#3,046 |
| 34. | Alta Sierra | 0.50% | 0.14%(+0.358)#330 | 0.26%(+0.238)#3,047 |
| 35. | Walnut Park | 0.49% | 0.14%(+0.347)#331 | 0.26%(+0.227)#3,048 |
| 36. | Aliso Viejo | 0.49% | 0.14%(+0.345)#332 | 0.26%(+0.226)#3,049 |
| 37. | Hillsborough | 0.47% | 0.14%(+0.330)#333 | 0.26%(+0.211)#3,050 |
| 38. | Concord | 0.47% | 0.14%(+0.328)#334 | 0.26%(+0.208)#3,051 |
| 39. | Norco | 0.46% | 0.14%(+0.322)#335 | 0.26%(+0.202)#3,052 |
| 40. | Rancho Santa Fe | 0.46% | 0.14%(+0.321)#336 | 0.26%(+0.202)#3,053 |
| 41. | Culver City | 0.46% | 0.14%(+0.318)#337 | 0.26%(+0.198)#3,054 |
| 42. | Tamalpais Homestead Valley | 0.45% | 0.14%(+0.311)#338 | 0.26%(+0.191)#3,055 |
| 43. | Soledad | 0.44% | 0.14%(+0.295)#339 | 0.26%(+0.176)#3,056 |
| 44. | Del Rey Oaks | 0.43% | 0.14%(+0.294)#340 | 0.26%(+0.175)#3,057 |
| 45. | La Selva Beach | 0.43% | 0.14%(+0.291)#341 | 0.26%(+0.171)#3,058 |
| 46. | Costa Mesa | 0.43% | 0.14%(+0.289)#342 | 0.26%(+0.170)#3,059 |
| 47. | San Marino | 0.43% | 0.14%(+0.286)#343 | 0.26%(+0.166)#3,060 |
| 48. | Glendale | 0.42% | 0.14%(+0.279)#344 | 0.26%(+0.159)#3,061 |
| 49. | Escalon | 0.42% | 0.14%(+0.275)#345 | 0.26%(+0.156)#3,062 |
| 50. | Eastvale | 0.41% | 0.14%(+0.269)#346 | 0.26%(+0.150)#3,063 |
| 51. | Hawthorne | 0.41% | 0.14%(+0.269)#347 | 0.26%(+0.149)#3,064 |
| 52. | Gold River | 0.40% | 0.14%(+0.264)#348 | 0.26%(+0.145)#3,065 |
| 53. | West Covina | 0.40% | 0.14%(+0.257)#349 | 0.26%(+0.138)#3,066 |
| 54. | Larkspur | 0.39% | 0.14%(+0.253)#350 | 0.26%(+0.133)#3,067 |
| 55. | Millville | 0.38% | 0.14%(+0.237)#351 | 0.26%(+0.118)#3,068 |
| 56. | Lomita | 0.37% | 0.14%(+0.232)#352 | 0.26%(+0.113)#3,069 |
| 57. | Menifee | 0.36% | 0.14%(+0.219)#353 | 0.26%(+0.100)#3,070 |
| 58. | Rancho Cucamonga | 0.36% | 0.14%(+0.216)#354 | 0.26%(+0.097)#3,071 |
| 59. | Pasadena | 0.34% | 0.14%(+0.201)#355 | 0.26%(+0.082)#3,072 |
| 60. | Riverside | 0.34% | 0.14%(+0.197)#356 | 0.26%(+0.077)#3,073 |
| 61. | Gilroy | 0.33% | 0.14%(+0.194)#357 | 0.26%(+0.074)#3,074 |
| 62. | East Pasadena | 0.33% | 0.14%(+0.188)#358 | 0.26%(+0.069)#3,075 |
| 63. | Bay Point | 0.33% | 0.14%(+0.187)#359 | 0.26%(+0.068)#3,076 |
| 64. | Calistoga | 0.33% | 0.14%(+0.187)#360 | 0.26%(+0.068)#3,077 |
| 65. | Fremont | 0.33% | 0.14%(+0.187)#361 | 0.26%(+0.067)#3,078 |
| 66. | Larkfield Wikiup | 0.33% | 0.14%(+0.185)#362 | 0.26%(+0.065)#3,079 |
| 67. | East Whittier | 0.32% | 0.14%(+0.182)#363 | 0.26%(+0.062)#3,080 |
| 68. | North Auburn | 0.32% | 0.14%(+0.179)#364 | 0.26%(+0.059)#3,081 |
| 69. | Agoura Hills | 0.31% | 0.14%(+0.173)#365 | 0.26%(+0.054)#3,082 |
| 70. | Port Hueneme | 0.31% | 0.14%(+0.171)#366 | 0.26%(+0.051)#3,083 |
| 71. | Rialto | 0.31% | 0.14%(+0.171)#367 | 0.26%(+0.051)#3,084 |
| 72. | South Whittier | 0.31% | 0.14%(+0.168)#368 | 0.26%(+0.048)#3,085 |
| 73. | Crockett | 0.31% | 0.14%(+0.167)#369 | 0.26%(+0.048)#3,086 |
| 74. | San Juan Capistrano | 0.30% | 0.14%(+0.164)#370 | 0.26%(+0.045)#3,087 |
| 75. | Belvedere | 0.30% | 0.14%(+0.160)#371 | 0.26%(+0.041)#3,088 |
| 76. | Lafayette | 0.30% | 0.14%(+0.160)#372 | 0.26%(+0.040)#3,089 |
| 77. | Montclair | 0.30% | 0.14%(+0.158)#373 | 0.26%(+0.039)#3,090 |
| 78. | Cudahy | 0.30% | 0.14%(+0.155)#374 | 0.26%(+0.036)#3,091 |
| 79. | Placentia | 0.29% | 0.14%(+0.149)#375 | 0.26%(+0.030)#3,092 |
| 80. | Mission Hills | 0.29% | 0.14%(+0.149)#376 | 0.26%(+0.029)#3,093 |
| 81. | West Hollywood | 0.29% | 0.14%(+0.148)#377 | 0.26%(+0.028)#3,094 |
| 82. | Squaw Valley | 0.28% | 0.14%(+0.144)#378 | 0.26%(+0.025)#3,095 |
| 83. | Strawberry Cdp Marin County | 0.28% | 0.14%(+0.144)#379 | 0.26%(+0.024)#3,096 |
| 84. | San Buenaventura Ventura | 0.28% | 0.14%(+0.142)#380 | 0.26%(+0.023)#3,097 |
| 85. | Lawndale | 0.28% | 0.14%(+0.142)#381 | 0.26%(+0.022)#3,098 |
| 86. | Rancho Murieta | 0.28% | 0.14%(+0.139)#382 | 0.26%(+0.019)#3,099 |
| 87. | Inglewood | 0.28% | 0.14%(+0.138)#383 | 0.26%(+0.018)#3,100 |
| 88. | Garden Acres | 0.28% | 0.14%(+0.136)#384 | 0.26%(+0.017)#3,101 |
| 89. | Hacienda Heights | 0.28% | 0.14%(+0.135)#385 | 0.26%(+0.016)#3,102 |
| 90. | Rohnert Park | 0.27% | 0.14%(+0.134)#386 | 0.26%(+0.014)#3,108 |
| 91. | Brisbane | 0.27% | 0.14%(+0.133)#387 | 0.26%(+0.013)#3,109 |
| 92. | Rainbow | 0.27% | 0.14%(+0.133)#388 | 0.26%(+0.013)#3,110 |
| 93. | Kentfield | 0.27% | 0.14%(+0.130)#389 | 0.26%(+0.010)#3,111 |
| 94. | Los Gatos | 0.27% | 0.14%(+0.129)#390 | 0.26%(+0.009)#3,112 |
| 95. | Banning | 0.27% | 0.14%(+0.127)#391 | 0.26%(+0.007)#3,113 |
| 96. | Camp Pendleton Mainside | 0.26% | 0.14%(+0.120)#392 | 0.26%(+0.000)#3,114 |
| 97. | Dana Point | 0.26% | 0.14%(+0.120)#393 | 0.26%(+0.000)#3,115 |
| 98. | Hemet | 0.26% | 0.14%(+0.118)#394 | 0.26%(-0.001)#3,116 |
| 99. | Madera | 0.26% | 0.14%(+0.116)#395 | 0.26%(-0.004)#3,117 |
| 100. | Benicia | 0.26% | 0.14%(+0.115)#396 | 0.26%(-0.005)#3,118 |
Common Questions
What are the Top 10 Cities with the Highest Percentage of Immigrants from Colombia in California?
Top 10 Cities with the Highest Percentage of Immigrants from Colombia in California are:
#1
13.79%
#2
4.44%
#3
4.02%
#4
3.65%
#5
3.35%
#6
2.39%
#7
2.09%
#8
1.85%
#9
1.60%
#10
1.42%
What city has the Highest Percentage of Immigrants from Colombia in California?
Ponderosa has the Highest Percentage of Immigrants from Colombia in California with 13.79%.
What is the Percentage of Immigrants from Colombia in the State of California?
Percentage of Immigrants from Colombia in California is 0.14%.
What is the Percentage of Immigrants from Colombia in the United States?
Percentage of Immigrants from Colombia in the United States is 0.26%.