Cities with the Highest Percentage of Population with a Degree in Liberal Arts and History in California
RELATED REPORTS & OPTIONS
Liberal Arts and History
California
Compare Cities
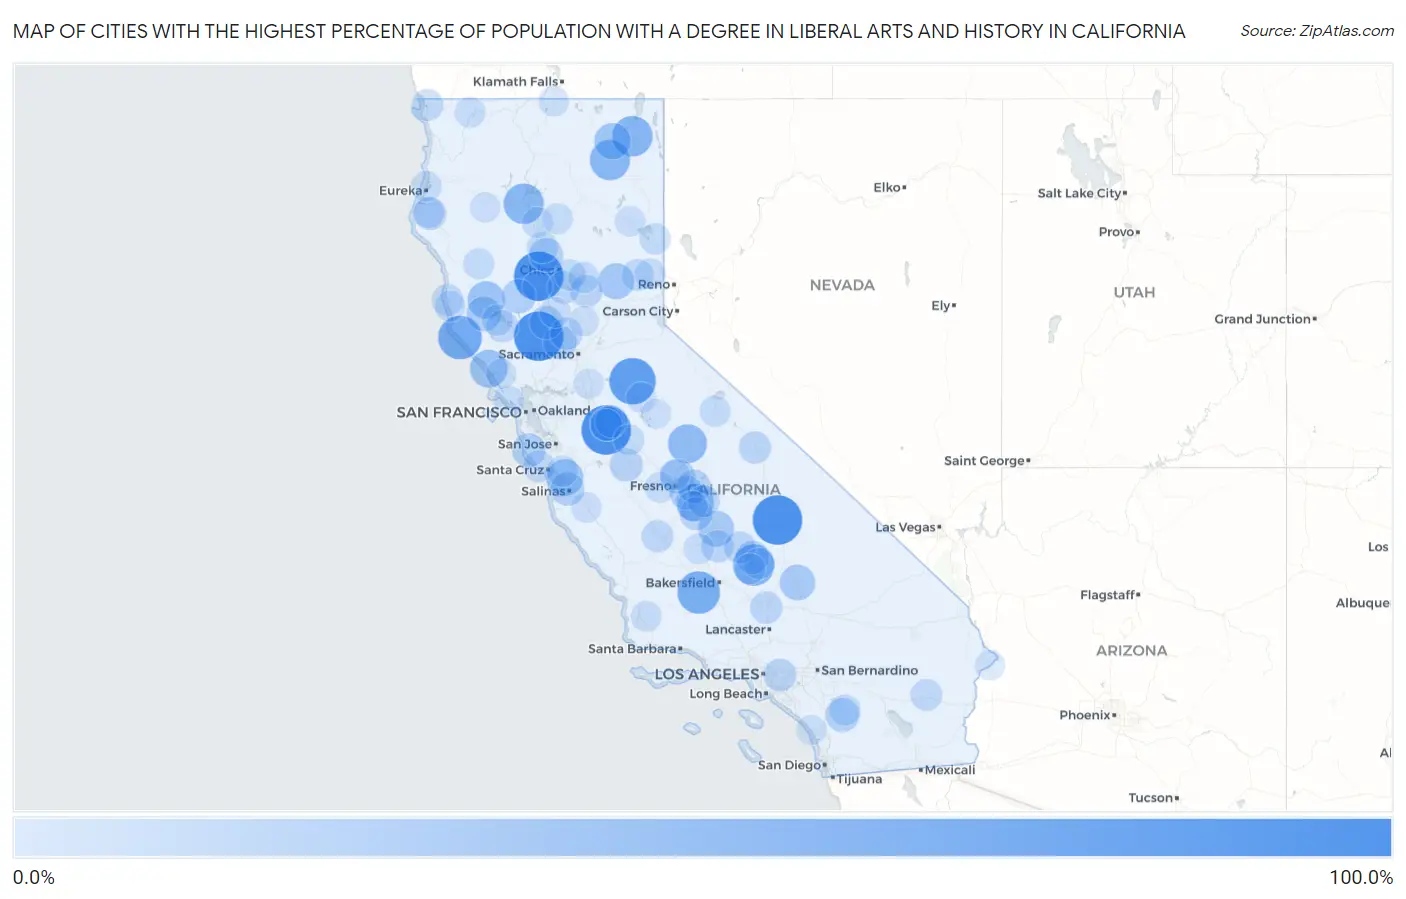
Map of Cities with the Highest Percentage of Population with a Degree in Liberal Arts and History in California
0.0%
100.0%
Cities with the Highest Percentage of Population with a Degree in Liberal Arts and History in California
| City | % Graduates | vs State | vs National | |
| 1. | Artois | 100.0% | 5.5%(+94.5)#1 | 4.9%(+95.1)#27 |
| 2. | Guinda | 100.0% | 5.5%(+94.5)#2 | 4.9%(+95.1)#37 |
| 3. | Olancha | 100.0% | 5.5%(+94.5)#3 | 4.9%(+95.1)#40 |
| 4. | Monterey Park Tract | 100.0% | 5.5%(+94.5)#4 | 4.9%(+95.1)#46 |
| 5. | Mountain Ranch | 86.8% | 5.5%(+81.3)#5 | 4.9%(+81.9)#97 |
| 6. | Anchor Bay | 75.0% | 5.5%(+69.5)#6 | 4.9%(+70.1)#117 |
| 7. | Dustin Acres | 70.0% | 5.5%(+64.5)#7 | 4.9%(+65.1)#131 |
| 8. | Squirrel Mountain Valley | 66.1% | 5.5%(+60.6)#8 | 4.9%(+61.2)#150 |
| 9. | Daphnedale Park | 61.5% | 5.5%(+56.0)#9 | 4.9%(+56.7)#164 |
| 10. | Keswick | 60.9% | 5.5%(+55.4)#10 | 4.9%(+56.0)#168 |
| 11. | Adin | 60.7% | 5.5%(+55.2)#11 | 4.9%(+55.8)#170 |
| 12. | Bass Lake | 55.3% | 5.5%(+49.8)#12 | 4.9%(+50.4)#201 |
| 13. | Delft Colony | 50.0% | 5.5%(+44.5)#13 | 4.9%(+45.1)#224 |
| 14. | Carmet | 50.0% | 5.5%(+44.5)#14 | 4.9%(+45.1)#266 |
| 15. | Potter Valley | 48.3% | 5.5%(+42.8)#15 | 4.9%(+43.5)#284 |
| 16. | Las Lomas | 45.2% | 5.5%(+39.7)#16 | 4.9%(+40.3)#309 |
| 17. | Castella | 45.0% | 5.5%(+39.5)#17 | 4.9%(+40.1)#310 |
| 18. | Canby | 44.5% | 5.5%(+39.0)#18 | 4.9%(+39.7)#312 |
| 19. | Downieville | 42.9% | 5.5%(+37.4)#19 | 4.9%(+38.0)#341 |
| 20. | Strathmore | 42.6% | 5.5%(+37.1)#20 | 4.9%(+37.7)#346 |
| 21. | Johannesburg | 41.2% | 5.5%(+35.7)#21 | 4.9%(+36.3)#364 |
| 22. | Talmage | 37.8% | 5.5%(+32.3)#22 | 4.9%(+33.0)#412 |
| 23. | Fort Washington | 37.1% | 5.5%(+31.6)#23 | 4.9%(+32.3)#429 |
| 24. | Stonyford | 35.3% | 5.5%(+29.8)#24 | 4.9%(+30.4)#477 |
| 25. | Bystrom | 35.2% | 5.5%(+29.7)#25 | 4.9%(+30.3)#480 |
| 26. | Aguanga | 34.4% | 5.5%(+28.9)#26 | 4.9%(+29.5)#499 |
| 27. | Del Rey | 34.2% | 5.5%(+28.7)#27 | 4.9%(+29.3)#504 |
| 28. | Vina | 34.1% | 5.5%(+28.7)#28 | 4.9%(+29.3)#505 |
| 29. | Boronda | 34.0% | 5.5%(+28.5)#29 | 4.9%(+29.1)#509 |
| 30. | Pescadero | 33.8% | 5.5%(+28.3)#30 | 4.9%(+28.9)#512 |
| 31. | Yolo | 33.3% | 5.5%(+27.8)#31 | 4.9%(+28.5)#528 |
| 32. | Minkler | 33.0% | 5.5%(+27.5)#32 | 4.9%(+28.1)#568 |
| 33. | Kernville | 32.7% | 5.5%(+27.2)#33 | 4.9%(+27.8)#575 |
| 34. | Arbuckle | 32.6% | 5.5%(+27.1)#34 | 4.9%(+27.7)#578 |
| 35. | Goshen | 31.0% | 5.5%(+25.5)#35 | 4.9%(+26.1)#625 |
| 36. | Dos Palos Y | 30.8% | 5.5%(+25.3)#36 | 4.9%(+25.9)#631 |
| 37. | Mountain Meadows | 30.7% | 5.5%(+25.2)#37 | 4.9%(+25.8)#638 |
| 38. | Oak Run | 30.3% | 5.5%(+24.8)#38 | 4.9%(+25.4)#647 |
| 39. | Industry | 29.6% | 5.5%(+24.1)#39 | 4.9%(+24.8)#671 |
| 40. | Scotia | 29.5% | 5.5%(+24.0)#40 | 4.9%(+24.6)#675 |
| 41. | Richvale | 28.8% | 5.5%(+23.3)#41 | 4.9%(+24.0)#698 |
| 42. | Robbins | 28.6% | 5.5%(+23.1)#42 | 4.9%(+23.7)#708 |
| 43. | Wilkerson | 28.3% | 5.5%(+22.8)#43 | 4.9%(+23.4)#728 |
| 44. | Mojave | 28.2% | 5.5%(+22.7)#44 | 4.9%(+23.4)#731 |
| 45. | Rackerby | 28.1% | 5.5%(+22.6)#45 | 4.9%(+23.3)#734 |
| 46. | Ducor | 27.8% | 5.5%(+22.3)#46 | 4.9%(+22.9)#745 |
| 47. | Empire | 27.5% | 5.5%(+22.0)#47 | 4.9%(+22.7)#760 |
| 48. | Avenal | 27.1% | 5.5%(+21.6)#48 | 4.9%(+22.2)#787 |
| 49. | Pine Flat | 26.9% | 5.5%(+21.4)#49 | 4.9%(+22.1)#791 |
| 50. | Cutler | 26.9% | 5.5%(+21.4)#50 | 4.9%(+22.0)#793 |
| 51. | Happy Valley | 26.8% | 5.5%(+21.3)#51 | 4.9%(+22.0)#796 |
| 52. | Kelseyville | 26.7% | 5.5%(+21.2)#52 | 4.9%(+21.8)#801 |
| 53. | Bret Harte | 26.7% | 5.5%(+21.2)#53 | 4.9%(+21.8)#802 |
| 54. | Calpine | 26.3% | 5.5%(+20.8)#54 | 4.9%(+21.4)#830 |
| 55. | Mendocino | 26.2% | 5.5%(+20.7)#55 | 4.9%(+21.3)#834 |
| 56. | Desert Center | 26.0% | 5.5%(+20.5)#56 | 4.9%(+21.1)#847 |
| 57. | Davenport | 25.9% | 5.5%(+20.4)#57 | 4.9%(+21.0)#854 |
| 58. | Smith River | 25.8% | 5.5%(+20.3)#58 | 4.9%(+20.9)#856 |
| 59. | Butte Valley | 24.4% | 5.5%(+18.9)#59 | 4.9%(+19.5)#943 |
| 60. | Olde Stockdale | 24.4% | 5.5%(+18.9)#60 | 4.9%(+19.5)#946 |
| 61. | Herlong | 24.3% | 5.5%(+18.8)#61 | 4.9%(+19.5)#947 |
| 62. | Tehama | 24.1% | 5.5%(+18.6)#62 | 4.9%(+19.3)#956 |
| 63. | Lake Riverside | 23.9% | 5.5%(+18.4)#63 | 4.9%(+19.0)#970 |
| 64. | Amesti | 23.7% | 5.5%(+18.2)#64 | 4.9%(+18.8)#983 |
| 65. | Weldon | 23.6% | 5.5%(+18.1)#65 | 4.9%(+18.7)#991 |
| 66. | Lakeport | 23.5% | 5.5%(+18.0)#66 | 4.9%(+18.7)#992 |
| 67. | Rio Dell | 23.5% | 5.5%(+18.0)#67 | 4.9%(+18.6)#999 |
| 68. | Covelo | 23.3% | 5.5%(+17.8)#68 | 4.9%(+18.4)#1,016 |
| 69. | Berry Creek | 23.1% | 5.5%(+17.6)#69 | 4.9%(+18.2)#1,024 |
| 70. | Winton | 23.0% | 5.5%(+17.5)#70 | 4.9%(+18.1)#1,035 |
| 71. | Pinon Hills | 22.8% | 5.5%(+17.3)#71 | 4.9%(+17.9)#1,045 |
| 72. | June Lake | 22.7% | 5.5%(+17.2)#72 | 4.9%(+17.9)#1,047 |
| 73. | Williams Canyon | 22.7% | 5.5%(+17.2)#73 | 4.9%(+17.9)#1,050 |
| 74. | Lake California | 22.3% | 5.5%(+16.8)#74 | 4.9%(+17.4)#1,073 |
| 75. | Manton | 22.2% | 5.5%(+16.7)#75 | 4.9%(+17.4)#1,080 |
| 76. | Loyalton | 22.1% | 5.5%(+16.6)#76 | 4.9%(+17.2)#1,106 |
| 77. | Albion | 21.8% | 5.5%(+16.3)#77 | 4.9%(+16.9)#1,124 |
| 78. | Bodfish | 21.7% | 5.5%(+16.2)#78 | 4.9%(+16.8)#1,130 |
| 79. | Happy Camp | 21.6% | 5.5%(+16.1)#79 | 4.9%(+16.7)#1,136 |
| 80. | Allensworth | 21.4% | 5.5%(+15.9)#80 | 4.9%(+16.6)#1,150 |
| 81. | Traver | 21.4% | 5.5%(+15.9)#81 | 4.9%(+16.6)#1,151 |
| 82. | Meridian | 21.4% | 5.5%(+15.9)#82 | 4.9%(+16.6)#1,152 |
| 83. | Garey | 21.4% | 5.5%(+15.9)#83 | 4.9%(+16.6)#1,163 |
| 84. | Manila | 21.3% | 5.5%(+15.8)#84 | 4.9%(+16.4)#1,172 |
| 85. | Bolinas | 21.2% | 5.5%(+15.7)#85 | 4.9%(+16.3)#1,177 |
| 86. | Kerman | 21.1% | 5.5%(+15.6)#86 | 4.9%(+16.3)#1,179 |
| 87. | Johnstonville | 20.9% | 5.5%(+15.4)#87 | 4.9%(+16.0)#1,199 |
| 88. | Sonora | 20.4% | 5.5%(+14.9)#88 | 4.9%(+15.5)#1,236 |
| 89. | Soledad | 20.4% | 5.5%(+14.9)#89 | 4.9%(+15.5)#1,247 |
| 90. | Rolling Hills | 20.3% | 5.5%(+14.8)#90 | 4.9%(+15.4)#1,249 |
| 91. | Dorris | 20.0% | 5.5%(+14.5)#91 | 4.9%(+15.1)#1,265 |
| 92. | Bloomfield | 20.0% | 5.5%(+14.5)#92 | 4.9%(+15.1)#1,288 |
| 93. | Hayfork | 19.9% | 5.5%(+14.4)#93 | 4.9%(+15.0)#1,313 |
| 94. | Fort Hunter Liggett | 19.9% | 5.5%(+14.4)#94 | 4.9%(+15.0)#1,315 |
| 95. | Bluewater | 19.2% | 5.5%(+13.7)#95 | 4.9%(+14.4)#1,370 |
| 96. | Woodbridge | 19.1% | 5.5%(+13.7)#96 | 4.9%(+14.3)#1,378 |
| 97. | Greeley Hill | 19.1% | 5.5%(+13.6)#97 | 4.9%(+14.2)#1,382 |
| 98. | Camp Pendleton South | 19.1% | 5.5%(+13.6)#98 | 4.9%(+14.2)#1,386 |
| 99. | Wheatland | 19.0% | 5.5%(+13.5)#99 | 4.9%(+14.1)#1,396 |
| 100. | Willows | 19.0% | 5.5%(+13.5)#100 | 4.9%(+14.1)#1,401 |
Common Questions
What are the Top 10 Cities with the Highest Percentage of Population with a Degree in Liberal Arts and History in California?
Top 10 Cities with the Highest Percentage of Population with a Degree in Liberal Arts and History in California are:
#1
100.0%
#2
100.0%
#3
100.0%
#4
100.0%
#5
86.8%
#6
75.0%
#7
70.0%
#8
66.1%
#9
61.5%
#10
60.9%
What city has the Highest Percentage of Population with a Degree in Liberal Arts and History in California?
Artois has the Highest Percentage of Population with a Degree in Liberal Arts and History in California with 100.0%.
What is the Percentage of Population with a Degree in Liberal Arts and History in the State of California?
Percentage of Population with a Degree in Liberal Arts and History in California is 5.5%.
What is the Percentage of Population with a Degree in Liberal Arts and History in the United States?
Percentage of Population with a Degree in Liberal Arts and History in the United States is 4.9%.