Cities with the Lowest Percentage of Births to Unmarried Women under the Age of under 20 in California
RELATED REPORTS & OPTIONS
Lowest Illegitimacy | Women 15-19
California
Compare Cities
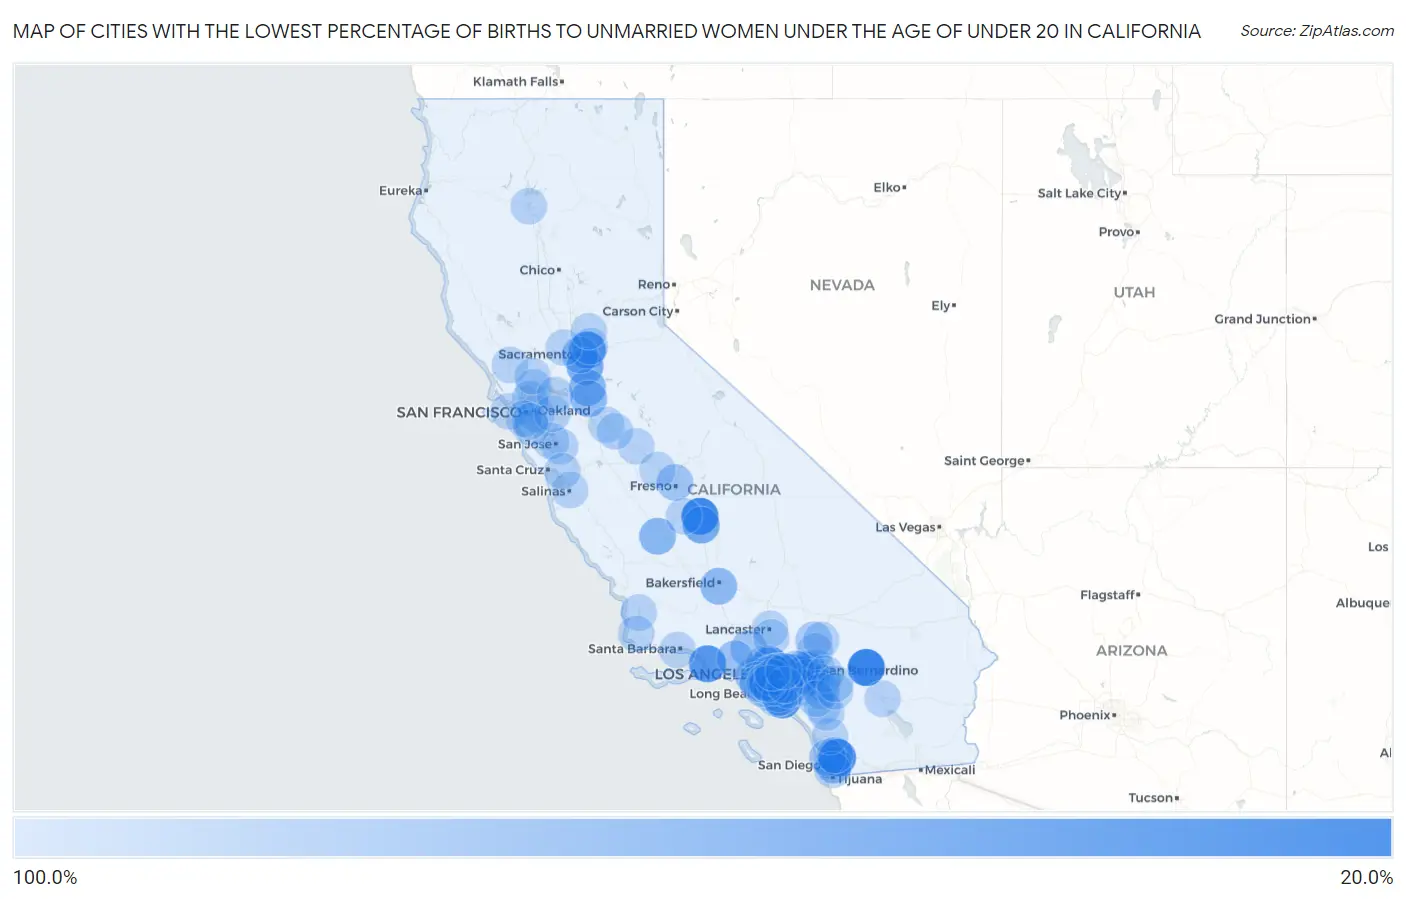
Map of Cities with the Lowest Percentage of Births to Unmarried Women under the Age of under 20 in California
100.0%
0.0%
Cities with the Lowest Percentage of Births to Unmarried Women under the Age of under 20 in California
| City | % Unmarried | vs State | vs National | |
| 1. | Yucca Valley | 27.9% | 83.2%(-55.3)#1 | 86.9%(-59.0)#24 |
| 2. | Visalia | 32.8% | 83.2%(-50.4)#2 | 86.9%(-54.1)#30 |
| 3. | Bostonia | 33.3% | 83.2%(-49.9)#3 | 86.9%(-53.6)#32 |
| 4. | Pomona | 44.4% | 83.2%(-38.8)#4 | 86.9%(-42.5)#46 |
| 5. | Oxnard | 46.4% | 83.2%(-36.8)#5 | 86.9%(-40.5)#48 |
| 6. | Carmichael | 47.5% | 83.2%(-35.7)#6 | 86.9%(-39.4)#49 |
| 7. | Costa Mesa | 48.3% | 83.2%(-34.9)#7 | 86.9%(-38.6)#51 |
| 8. | Pasadena | 50.0% | 83.2%(-33.2)#8 | 86.9%(-36.9)#54 |
| 9. | Florence Graham | 60.0% | 83.2%(-23.2)#9 | 86.9%(-26.9)#68 |
| 10. | Tulare | 64.0% | 83.2%(-19.2)#10 | 86.9%(-22.9)#75 |
| 11. | Elk Grove | 65.4% | 83.2%(-17.8)#11 | 86.9%(-21.5)#82 |
| 12. | Ontario | 70.0% | 83.2%(-13.2)#12 | 86.9%(-16.9)#94 |
| 13. | Fontana | 71.9% | 83.2%(-11.3)#13 | 86.9%(-15.0)#102 |
| 14. | Lodi | 73.6% | 83.2%(-9.60)#14 | 86.9%(-13.3)#106 |
| 15. | Avenal | 75.3% | 83.2%(-7.90)#15 | 86.9%(-11.6)#109 |
| 16. | La Presa | 76.7% | 83.2%(-6.50)#16 | 86.9%(-10.2)#116 |
| 17. | Bakersfield | 78.4% | 83.2%(-4.80)#17 | 86.9%(-8.50)#125 |
| 18. | Stockton | 80.1% | 83.2%(-3.10)#18 | 86.9%(-6.80)#132 |
| 19. | Los Angeles | 81.2% | 83.2%(-2.00)#19 | 86.9%(-5.70)#135 |
| 20. | Santa Clarita | 85.1% | 83.2%(+1.90)#20 | 86.9%(-1.80)#153 |
| 21. | Sacramento | 85.4% | 83.2%(+2.20)#21 | 86.9%(-1.50)#154 |
| 22. | Simi Valley | 86.4% | 83.2%(+3.20)#22 | 86.9%(-0.500)#158 |
| 23. | Fresno | 88.0% | 83.2%(+4.80)#23 | 86.9%(+1.10)#166 |
| 24. | San Diego | 89.4% | 83.2%(+6.20)#24 | 86.9%(+2.50)#169 |
| 25. | Victorville | 92.3% | 83.2%(+9.10)#25 | 86.9%(+5.40)#181 |
| 26. | San Jose | 100.0% | 83.2%(+16.8)#26 | 86.9%(+13.1)#196 |
| 27. | San Francisco | 100.0% | 83.2%(+16.8)#27 | 86.9%(+13.1)#199 |
| 28. | Long Beach | 100.0% | 83.2%(+16.8)#28 | 86.9%(+13.1)#211 |
| 29. | Oakland | 100.0% | 83.2%(+16.8)#29 | 86.9%(+13.1)#213 |
| 30. | Anaheim | 100.0% | 83.2%(+16.8)#30 | 86.9%(+13.1)#216 |
| 31. | Riverside | 100.0% | 83.2%(+16.8)#31 | 86.9%(+13.1)#220 |
| 32. | Chula Vista | 100.0% | 83.2%(+16.8)#32 | 86.9%(+13.1)#229 |
| 33. | San Bernardino | 100.0% | 83.2%(+16.8)#33 | 86.9%(+13.1)#241 |
| 34. | Modesto | 100.0% | 83.2%(+16.8)#34 | 86.9%(+13.1)#242 |
| 35. | Moreno Valley | 100.0% | 83.2%(+16.8)#35 | 86.9%(+13.1)#245 |
| 36. | Huntington Beach | 100.0% | 83.2%(+16.8)#36 | 86.9%(+13.1)#254 |
| 37. | Glendale | 100.0% | 83.2%(+16.8)#37 | 86.9%(+13.1)#256 |
| 38. | Santa Rosa | 100.0% | 83.2%(+16.8)#38 | 86.9%(+13.1)#268 |
| 39. | Rancho Cucamonga | 100.0% | 83.2%(+16.8)#39 | 86.9%(+13.1)#271 |
| 40. | Garden Grove | 100.0% | 83.2%(+16.8)#40 | 86.9%(+13.1)#272 |
| 41. | Lancaster | 100.0% | 83.2%(+16.8)#41 | 86.9%(+13.1)#273 |
| 42. | Palmdale | 100.0% | 83.2%(+16.8)#42 | 86.9%(+13.1)#275 |
| 43. | Salinas | 100.0% | 83.2%(+16.8)#43 | 86.9%(+13.1)#276 |
| 44. | Corona | 100.0% | 83.2%(+16.8)#44 | 86.9%(+13.1)#277 |
| 45. | Escondido | 100.0% | 83.2%(+16.8)#45 | 86.9%(+13.1)#282 |
| 46. | Fullerton | 100.0% | 83.2%(+16.8)#46 | 86.9%(+13.1)#288 |
| 47. | Orange | 100.0% | 83.2%(+16.8)#47 | 86.9%(+13.1)#292 |
| 48. | Santa Clara | 100.0% | 83.2%(+16.8)#48 | 86.9%(+13.1)#299 |
| 49. | Vallejo | 100.0% | 83.2%(+16.8)#49 | 86.9%(+13.1)#304 |
| 50. | East Los Angeles | 100.0% | 83.2%(+16.8)#50 | 86.9%(+13.1)#315 |
| 51. | Richmond | 100.0% | 83.2%(+16.8)#51 | 86.9%(+13.1)#319 |
| 52. | Murrieta | 100.0% | 83.2%(+16.8)#52 | 86.9%(+13.1)#331 |
| 53. | Temecula | 100.0% | 83.2%(+16.8)#53 | 86.9%(+13.1)#337 |
| 54. | Santa Maria | 100.0% | 83.2%(+16.8)#54 | 86.9%(+13.1)#339 |
| 55. | El Monte | 100.0% | 83.2%(+16.8)#55 | 86.9%(+13.1)#340 |
| 56. | West Covina | 100.0% | 83.2%(+16.8)#56 | 86.9%(+13.1)#341 |
| 57. | Inglewood | 100.0% | 83.2%(+16.8)#57 | 86.9%(+13.1)#344 |
| 58. | Jurupa Valley | 100.0% | 83.2%(+16.8)#58 | 86.9%(+13.1)#349 |
| 59. | San Mateo | 100.0% | 83.2%(+16.8)#59 | 86.9%(+13.1)#352 |
| 60. | Daly City | 100.0% | 83.2%(+16.8)#60 | 86.9%(+13.1)#353 |
| 61. | Norwalk | 100.0% | 83.2%(+16.8)#61 | 86.9%(+13.1)#355 |
| 62. | Hesperia | 100.0% | 83.2%(+16.8)#62 | 86.9%(+13.1)#361 |
| 63. | Compton | 100.0% | 83.2%(+16.8)#63 | 86.9%(+13.1)#371 |
| 64. | Carson | 100.0% | 83.2%(+16.8)#64 | 86.9%(+13.1)#373 |
| 65. | Redding | 100.0% | 83.2%(+16.8)#65 | 86.9%(+13.1)#376 |
| 66. | South Gate | 100.0% | 83.2%(+16.8)#66 | 86.9%(+13.1)#378 |
| 67. | Santa Barbara | 100.0% | 83.2%(+16.8)#67 | 86.9%(+13.1)#391 |
| 68. | Merced | 100.0% | 83.2%(+16.8)#68 | 86.9%(+13.1)#395 |
| 69. | Citrus Heights | 100.0% | 83.2%(+16.8)#69 | 86.9%(+13.1)#397 |
| 70. | Hawthorne | 100.0% | 83.2%(+16.8)#70 | 86.9%(+13.1)#398 |
| 71. | San Ramon | 100.0% | 83.2%(+16.8)#71 | 86.9%(+13.1)#400 |
| 72. | Buena Park | 100.0% | 83.2%(+16.8)#72 | 86.9%(+13.1)#406 |
| 73. | Lakewood | 100.0% | 83.2%(+16.8)#73 | 86.9%(+13.1)#414 |
| 74. | Napa | 100.0% | 83.2%(+16.8)#74 | 86.9%(+13.1)#419 |
| 75. | Perris | 100.0% | 83.2%(+16.8)#75 | 86.9%(+13.1)#420 |
| 76. | Upland | 100.0% | 83.2%(+16.8)#76 | 86.9%(+13.1)#421 |
| 77. | Pittsburg | 100.0% | 83.2%(+16.8)#77 | 86.9%(+13.1)#428 |
| 78. | Apple Valley | 100.0% | 83.2%(+16.8)#78 | 86.9%(+13.1)#431 |
| 79. | Redlands | 100.0% | 83.2%(+16.8)#79 | 86.9%(+13.1)#436 |
| 80. | Turlock | 100.0% | 83.2%(+16.8)#80 | 86.9%(+13.1)#439 |
| 81. | Baldwin Park | 100.0% | 83.2%(+16.8)#81 | 86.9%(+13.1)#444 |
| 82. | Lake Elsinore | 100.0% | 83.2%(+16.8)#82 | 86.9%(+13.1)#454 |
| 83. | Madera | 100.0% | 83.2%(+16.8)#83 | 86.9%(+13.1)#466 |
| 84. | Lynwood | 100.0% | 83.2%(+16.8)#84 | 86.9%(+13.1)#468 |
| 85. | South San Francisco | 100.0% | 83.2%(+16.8)#85 | 86.9%(+13.1)#472 |
| 86. | Pico Rivera | 100.0% | 83.2%(+16.8)#86 | 86.9%(+13.1)#493 |
| 87. | Woodland | 100.0% | 83.2%(+16.8)#87 | 86.9%(+13.1)#494 |
| 88. | Santee | 100.0% | 83.2%(+16.8)#88 | 86.9%(+13.1)#502 |
| 89. | Hanford | 100.0% | 83.2%(+16.8)#89 | 86.9%(+13.1)#511 |
| 90. | Fountain Valley | 100.0% | 83.2%(+16.8)#90 | 86.9%(+13.1)#517 |
| 91. | San Jacinto | 100.0% | 83.2%(+16.8)#91 | 86.9%(+13.1)#533 |
| 92. | Beaumont | 100.0% | 83.2%(+16.8)#92 | 86.9%(+13.1)#537 |
| 93. | Paramount | 100.0% | 83.2%(+16.8)#93 | 86.9%(+13.1)#539 |
| 94. | Watsonville | 100.0% | 83.2%(+16.8)#94 | 86.9%(+13.1)#543 |
| 95. | Placentia | 100.0% | 83.2%(+16.8)#95 | 86.9%(+13.1)#547 |
| 96. | Rosemead | 100.0% | 83.2%(+16.8)#96 | 86.9%(+13.1)#551 |
| 97. | Covina | 100.0% | 83.2%(+16.8)#97 | 86.9%(+13.1)#556 |
| 98. | Lincoln | 100.0% | 83.2%(+16.8)#98 | 86.9%(+13.1)#559 |
| 99. | Lompoc | 100.0% | 83.2%(+16.8)#99 | 86.9%(+13.1)#598 |
| 100. | Coachella | 100.0% | 83.2%(+16.8)#100 | 86.9%(+13.1)#613 |
Common Questions
What are the Top 10 Cities with the Lowest Percentage of Births to Unmarried Women under the Age of under 20 in California?
Top 10 Cities with the Lowest Percentage of Births to Unmarried Women under the Age of under 20 in California are:
#1
27.9%
#2
32.8%
#3
33.3%
#4
44.4%
#5
46.4%
#6
47.5%
#7
48.3%
#8
50.0%
#9
60.0%
#10
64.0%
What city has the Lowest Percentage of Births to Unmarried Women under the Age of under 20 in California?
Yucca Valley has the Lowest Percentage of Births to Unmarried Women under the Age of under 20 in California with 27.9%.
What is the Percentage of Births to Unmarried Women under the Age of under 20 in the State of California?
Percentage of Births to Unmarried Women under the Age of under 20 in California is 83.2%.
What is the Percentage of Births to Unmarried Women under the Age of under 20 in the United States?
Percentage of Births to Unmarried Women under the Age of under 20 in the United States is 86.9%.