Sky Valley, CA Map & Demographics
Sky Valley Map
Sky Valley Overview
$31,326
PER CAPITA INCOME
$74,821
AVG FAMILY INCOME
$45,985
AVG HOUSEHOLD INCOME
22.6%
WAGE / INCOME GAP [ % ]
77.4¢/ $1
WAGE / INCOME GAP [ $ ]
0.48
INEQUALITY / GINI INDEX
2,307
TOTAL POPULATION
1,104
MALE POPULATION
1,203
FEMALE POPULATION
91.77
MALES / 100 FEMALES
108.97
FEMALES / 100 MALES
52.7
MEDIAN AGE
3.1
AVG FAMILY SIZE
2.3
AVG HOUSEHOLD SIZE
875
LABOR FORCE [ PEOPLE ]
43.3%
PERCENT IN LABOR FORCE
10.6%
UNEMPLOYMENT RATE
Income in Sky Valley
Income Overview in Sky Valley
Per Capita Income in Sky Valley is $31,326, while median incomes of families and households are $74,821 and $45,985 respectively.
| Characteristic | Number | Measure |
| Per Capita Income | 2,307 | $31,326 |
| Median Family Income | 533 | $74,821 |
| Mean Family Income | 533 | $95,037 |
| Median Household Income | 994 | $45,985 |
| Mean Household Income | 994 | $72,883 |
| Income Deficit | 533 | $0 |
| Wage / Income Gap (%) | 2,307 | 22.55% |
| Wage / Income Gap ($) | 2,307 | 77.45¢ per $1 |
| Gini / Inequality Index | 2,307 | 0.48 |
Earnings by Sex in Sky Valley
Average Earnings in Sky Valley are $30,847, $36,652 for men and $28,386 for women, a difference of 22.6%.
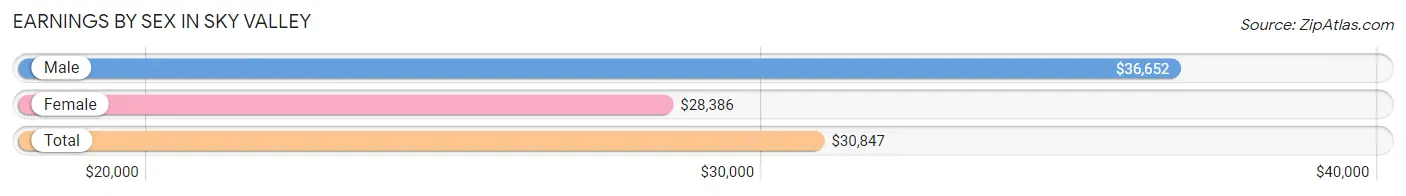
| Sex | Number | Average Earnings |
| Male | 498 (51.5%) | $36,652 |
| Female | 469 (48.5%) | $28,386 |
| Total | 967 (100.0%) | $30,847 |
Earnings by Sex by Income Bracket in Sky Valley
The most common earnings brackets in Sky Valley are $100,000+ for men (69 | 13.9%) and $25,000 to $29,999 for women (99 | 21.1%).
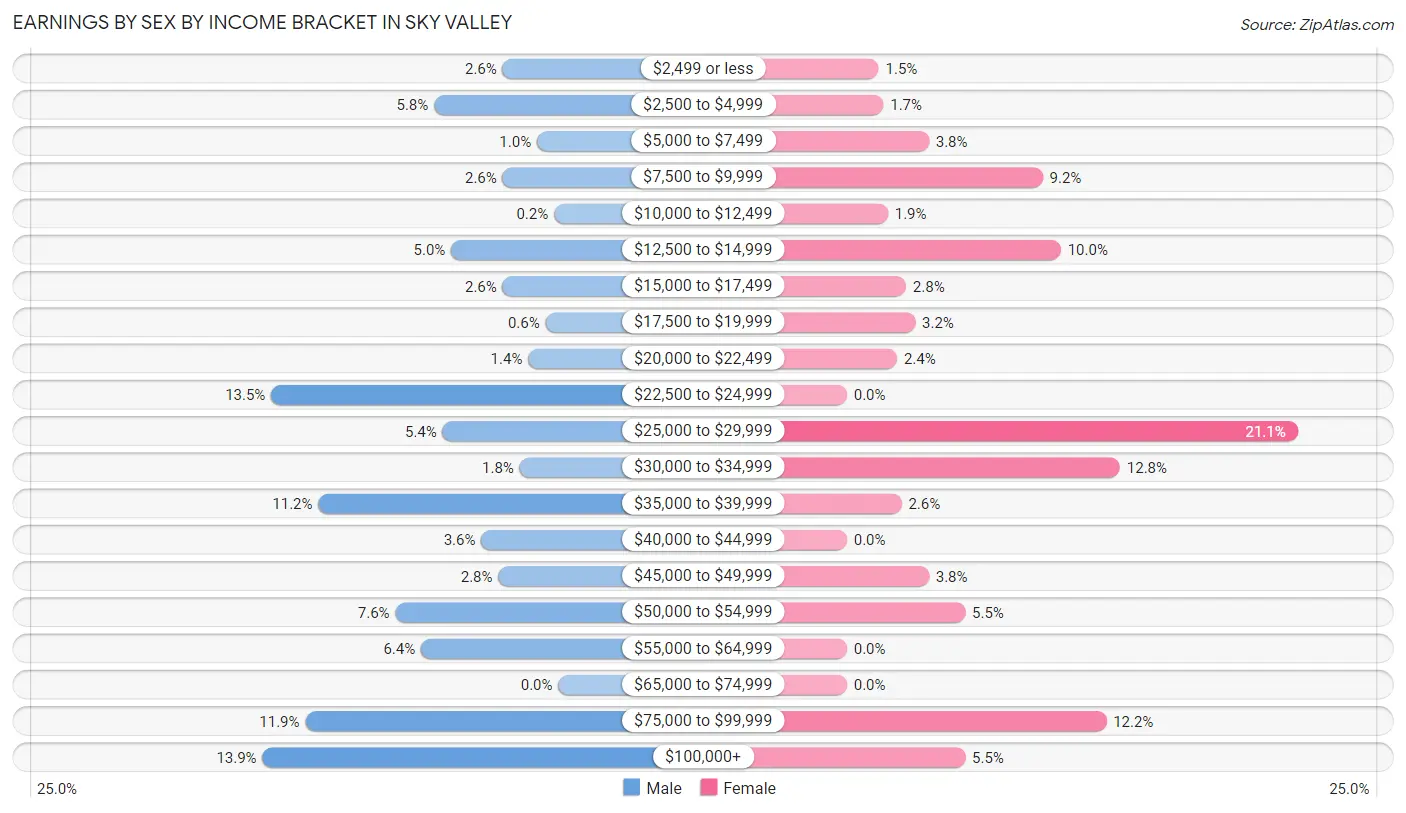
| Income | Male | Female |
| $2,499 or less | 13 (2.6%) | 7 (1.5%) |
| $2,500 to $4,999 | 29 (5.8%) | 8 (1.7%) |
| $5,000 to $7,499 | 5 (1.0%) | 18 (3.8%) |
| $7,500 to $9,999 | 13 (2.6%) | 43 (9.2%) |
| $10,000 to $12,499 | 1 (0.2%) | 9 (1.9%) |
| $12,500 to $14,999 | 25 (5.0%) | 47 (10.0%) |
| $15,000 to $17,499 | 13 (2.6%) | 13 (2.8%) |
| $17,500 to $19,999 | 3 (0.6%) | 15 (3.2%) |
| $20,000 to $22,499 | 7 (1.4%) | 11 (2.4%) |
| $22,500 to $24,999 | 67 (13.5%) | 0 (0.0%) |
| $25,000 to $29,999 | 27 (5.4%) | 99 (21.1%) |
| $30,000 to $34,999 | 9 (1.8%) | 60 (12.8%) |
| $35,000 to $39,999 | 56 (11.2%) | 12 (2.6%) |
| $40,000 to $44,999 | 18 (3.6%) | 0 (0.0%) |
| $45,000 to $49,999 | 14 (2.8%) | 18 (3.8%) |
| $50,000 to $54,999 | 38 (7.6%) | 26 (5.5%) |
| $55,000 to $64,999 | 32 (6.4%) | 0 (0.0%) |
| $65,000 to $74,999 | 0 (0.0%) | 0 (0.0%) |
| $75,000 to $99,999 | 59 (11.8%) | 57 (12.1%) |
| $100,000+ | 69 (13.9%) | 26 (5.5%) |
| Total | 498 (100.0%) | 469 (100.0%) |
Earnings by Sex by Educational Attainment in Sky Valley
Average earnings in Sky Valley are $36,987 for men and $29,841 for women, a difference of 19.3%. Men with an educational attainment of bachelor's degree enjoy the highest average annual earnings of $106,607, while those with high school diploma education earn the least with $16,250. Women with an educational attainment of high school diploma earn the most with the average annual earnings of $32,931, while those with college or associate's degree education have the smallest earnings of $30,081.
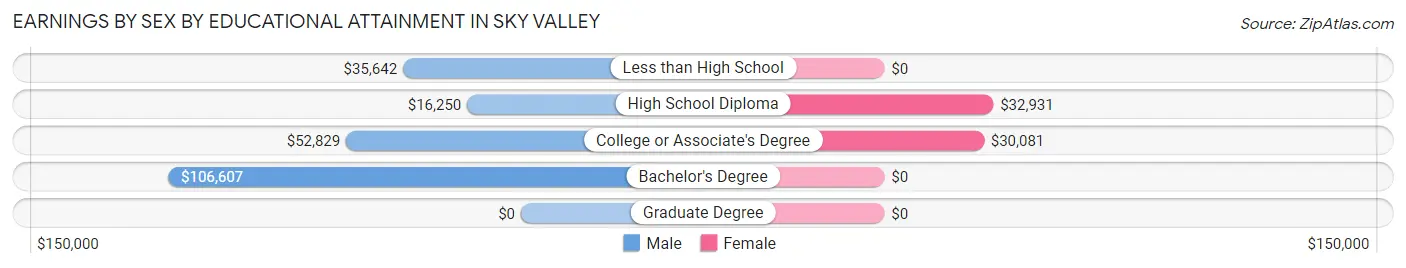
| Educational Attainment | Male Income | Female Income |
| Less than High School | $35,642 | $0 |
| High School Diploma | $16,250 | $32,931 |
| College or Associate's Degree | $52,829 | $30,081 |
| Bachelor's Degree | $106,607 | $0 |
| Graduate Degree | - | - |
| Total | $36,987 | $29,841 |
Family Income in Sky Valley
Family Income Brackets in Sky Valley
According to the Sky Valley family income data, there are 136 families falling into the $50,000 to $74,999 income range, which is the most common income bracket and makes up 25.5% of all families. Conversely, the $10,000 to $14,999 income bracket is the least frequent group with only 6 families (1.1%) belonging to this category.
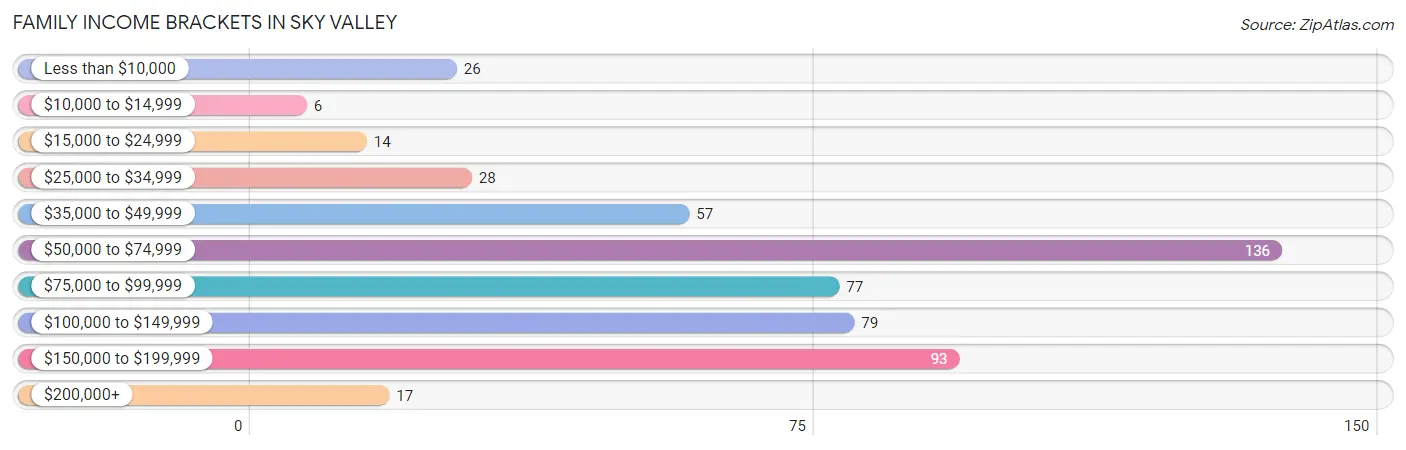
| Income Bracket | # Families | % Families |
| Less than $10,000 | 26 | 4.9% |
| $10,000 to $14,999 | 6 | 1.1% |
| $15,000 to $24,999 | 14 | 2.6% |
| $25,000 to $34,999 | 28 | 5.3% |
| $35,000 to $49,999 | 57 | 10.7% |
| $50,000 to $74,999 | 136 | 25.5% |
| $75,000 to $99,999 | 77 | 14.4% |
| $100,000 to $149,999 | 79 | 14.8% |
| $150,000 to $199,999 | 93 | 17.4% |
| $200,000+ | 17 | 3.2% |
Family Income by Famaliy Size in Sky Valley
3-person families (99 | 18.6%) account for the highest median family income in Sky Valley with $85,898 per family, while 3-person families (99 | 18.6%) have the highest median income of $28,633 per family member.
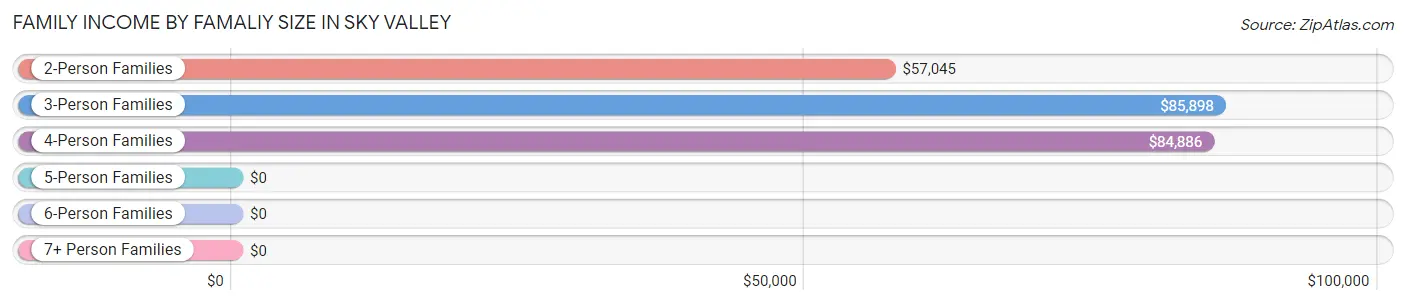
| Income Bracket | # Families | Median Income |
| 2-Person Families | 286 (53.7%) | $57,045 |
| 3-Person Families | 99 (18.6%) | $85,898 |
| 4-Person Families | 81 (15.2%) | $84,886 |
| 5-Person Families | 23 (4.3%) | $0 |
| 6-Person Families | 5 (0.9%) | $0 |
| 7+ Person Families | 39 (7.3%) | $0 |
| Total | 533 (100.0%) | $74,821 |
Family Income by Number of Earners in Sky Valley
The median family income in Sky Valley is $74,821, with families comprising 3+ earners (19) having the highest median family income of $143,594, while families with no earners (171) have the lowest median family income of $54,263, accounting for 3.6% and 32.1% of families, respectively.
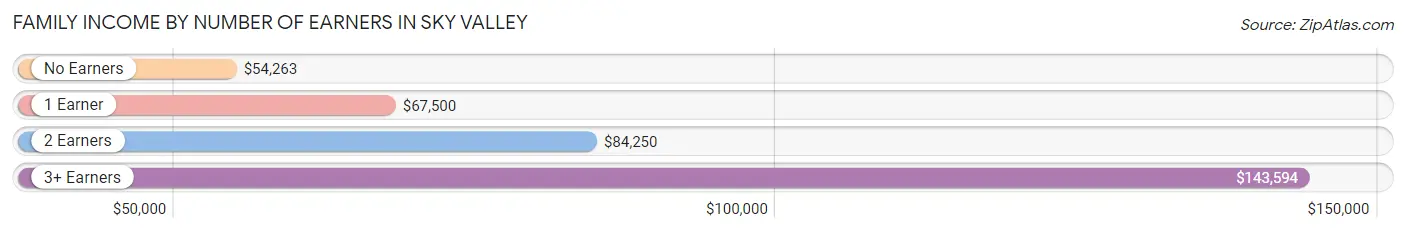
| Number of Earners | # Families | Median Income |
| No Earners | 171 (32.1%) | $54,263 |
| 1 Earner | 126 (23.6%) | $67,500 |
| 2 Earners | 217 (40.7%) | $84,250 |
| 3+ Earners | 19 (3.6%) | $143,594 |
| Total | 533 (100.0%) | $74,821 |
Household Income in Sky Valley
Household Income Brackets in Sky Valley
With 196 households falling in the category, the $25,000 to $34,999 income range is the most frequent in Sky Valley, accounting for 19.7% of all households. In contrast, only 25 households (2.5%) fall into the $200,000+ income bracket, making it the least populous group.
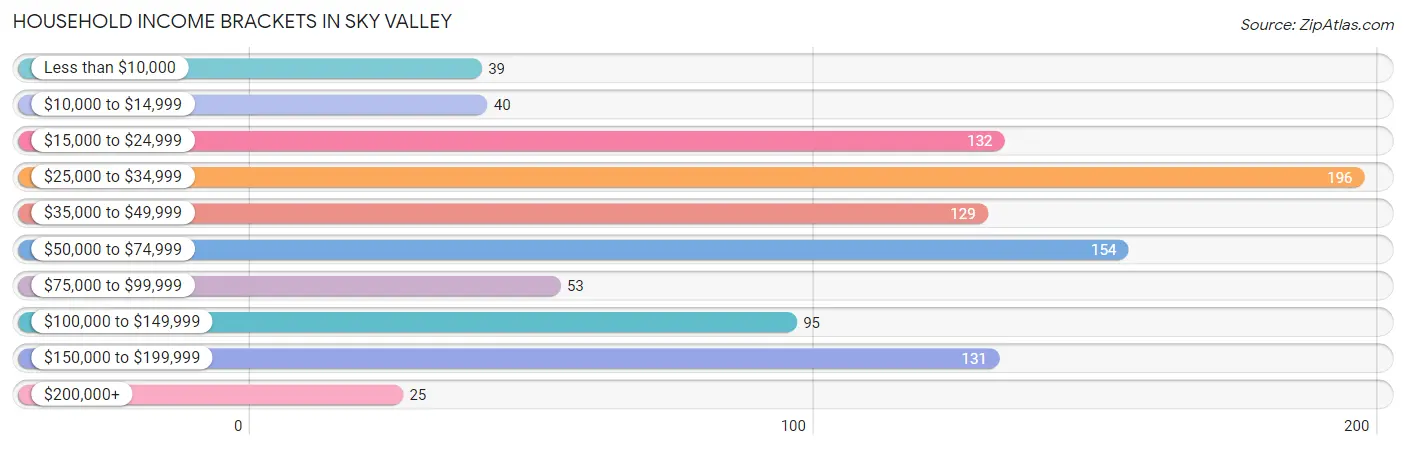
| Income Bracket | # Households | % Households |
| Less than $10,000 | 39 | 3.9% |
| $10,000 to $14,999 | 40 | 4.0% |
| $15,000 to $24,999 | 132 | 13.3% |
| $25,000 to $34,999 | 196 | 19.7% |
| $35,000 to $49,999 | 129 | 13.0% |
| $50,000 to $74,999 | 154 | 15.5% |
| $75,000 to $99,999 | 53 | 5.3% |
| $100,000 to $149,999 | 95 | 9.6% |
| $150,000 to $199,999 | 131 | 13.2% |
| $200,000+ | 25 | 2.5% |
Household Income by Householder Age in Sky Valley
The median household income in Sky Valley is $45,985, with the highest median household income of $106,250 found in the 45 to 64 years age bracket for the primary householder. A total of 300 households (30.2%) fall into this category.
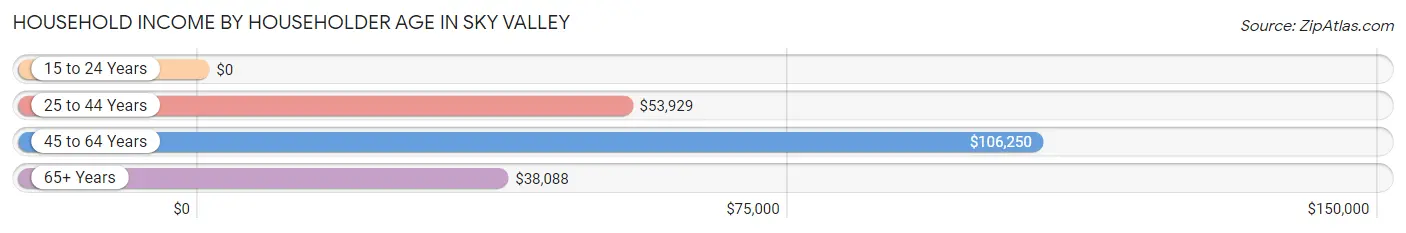
| Income Bracket | # Households | Median Income |
| 15 to 24 Years | 0 (0.0%) | $0 |
| 25 to 44 Years | 172 (17.3%) | $53,929 |
| 45 to 64 Years | 300 (30.2%) | $106,250 |
| 65+ Years | 522 (52.5%) | $38,088 |
| Total | 994 (100.0%) | $45,985 |
Poverty in Sky Valley
Income Below Poverty by Sex and Age in Sky Valley
With 16.4% poverty level for males and 10.1% for females among the residents of Sky Valley, 15 year old males and 5 year old females are the most vulnerable to poverty, with 8 males (80.0%) and 7 females (100.0%) in their respective age groups living below the poverty level.
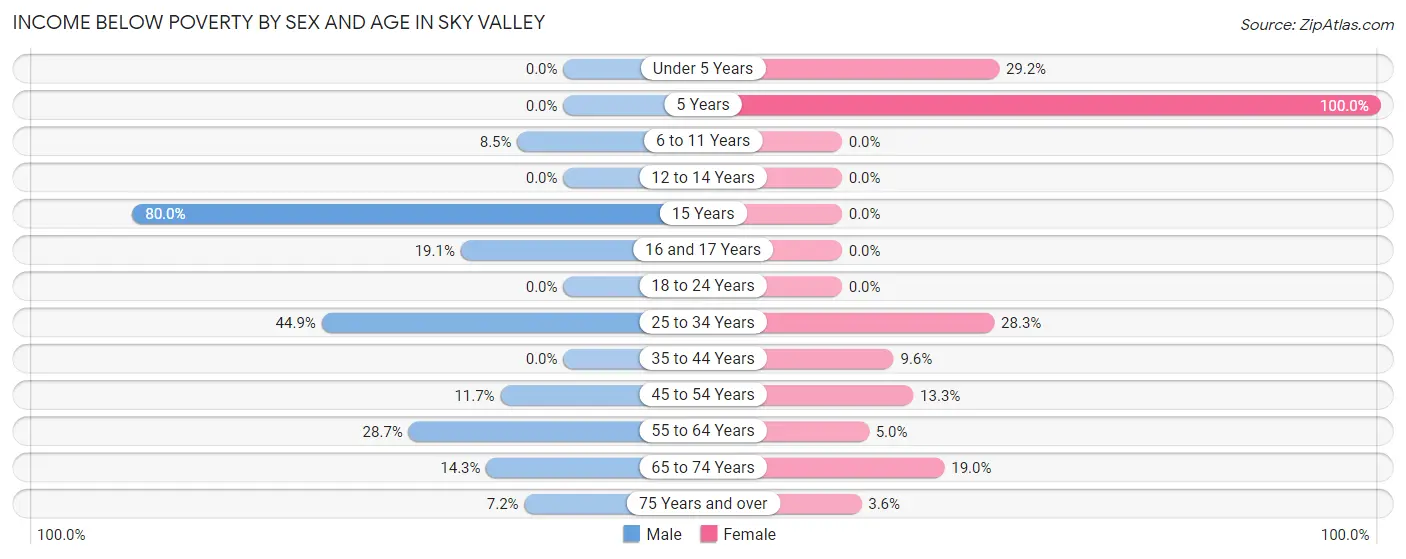
| Age Bracket | Male | Female |
| Under 5 Years | 0 (0.0%) | 7 (29.2%) |
| 5 Years | 0 (0.0%) | 7 (100.0%) |
| 6 to 11 Years | 7 (8.5%) | 0 (0.0%) |
| 12 to 14 Years | 0 (0.0%) | 0 (0.0%) |
| 15 Years | 8 (80.0%) | 0 (0.0%) |
| 16 and 17 Years | 8 (19.1%) | 0 (0.0%) |
| 18 to 24 Years | 0 (0.0%) | 0 (0.0%) |
| 25 to 34 Years | 48 (44.9%) | 28 (28.3%) |
| 35 to 44 Years | 0 (0.0%) | 12 (9.6%) |
| 45 to 54 Years | 16 (11.7%) | 20 (13.3%) |
| 55 to 64 Years | 60 (28.7%) | 6 (5.0%) |
| 65 to 74 Years | 20 (14.3%) | 31 (19.0%) |
| 75 Years and over | 14 (7.2%) | 10 (3.6%) |
| Total | 181 (16.4%) | 121 (10.1%) |
Income Above Poverty by Sex and Age in Sky Valley
According to the poverty statistics in Sky Valley, males aged under 5 years and females aged 6 to 11 years are the age groups that are most secure financially, with 100.0% of males and 100.0% of females in these age groups living above the poverty line.
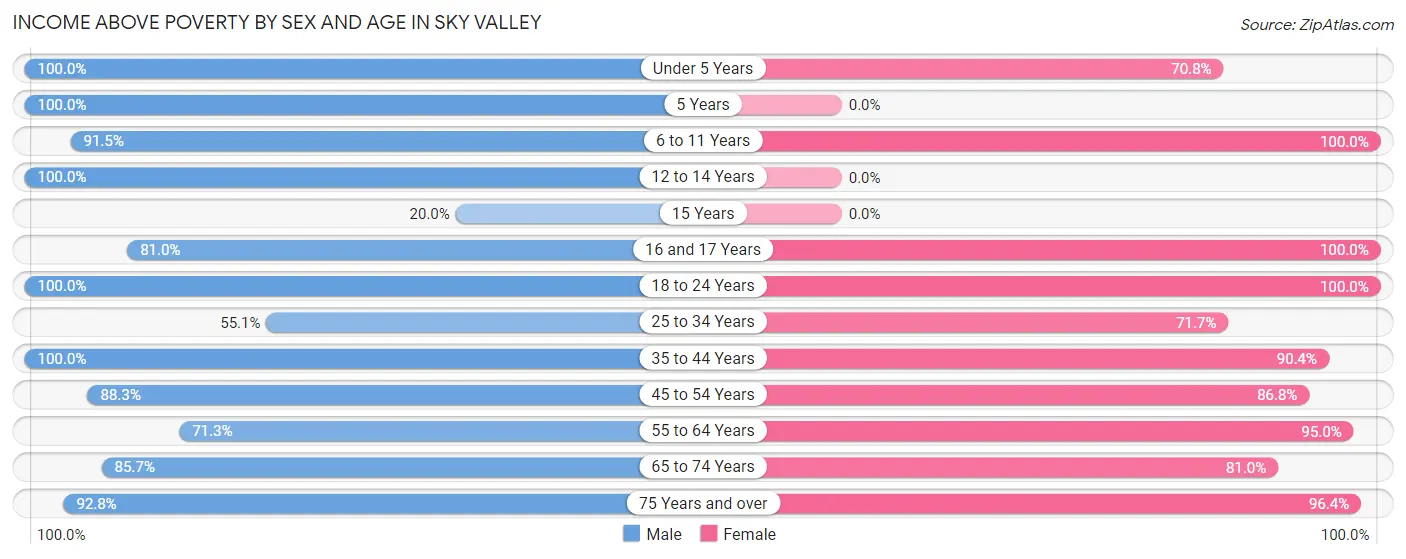
| Age Bracket | Male | Female |
| Under 5 Years | 8 (100.0%) | 17 (70.8%) |
| 5 Years | 8 (100.0%) | 0 (0.0%) |
| 6 to 11 Years | 75 (91.5%) | 145 (100.0%) |
| 12 to 14 Years | 2 (100.0%) | 0 (0.0%) |
| 15 Years | 2 (20.0%) | 0 (0.0%) |
| 16 and 17 Years | 34 (80.9%) | 8 (100.0%) |
| 18 to 24 Years | 58 (100.0%) | 85 (100.0%) |
| 25 to 34 Years | 59 (55.1%) | 71 (71.7%) |
| 35 to 44 Years | 104 (100.0%) | 113 (90.4%) |
| 45 to 54 Years | 121 (88.3%) | 131 (86.8%) |
| 55 to 64 Years | 149 (71.3%) | 114 (95.0%) |
| 65 to 74 Years | 120 (85.7%) | 132 (81.0%) |
| 75 Years and over | 180 (92.8%) | 266 (96.4%) |
| Total | 920 (83.6%) | 1,082 (89.9%) |
Income Below Poverty Among Married-Couple Families in Sky Valley
The poverty statistics for married-couple families in Sky Valley show that 9.2% or 41 of the total 445 families live below the poverty line. Families with 3 or 4 children have the highest poverty rate of 13.0%, comprising of 7 families. On the other hand, families with no children have the lowest poverty rate of 8.6%, which includes 27 families.
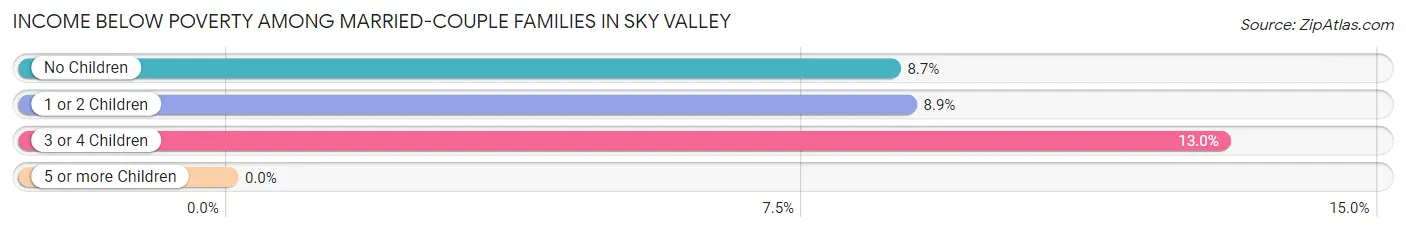
| Children | Above Poverty | Below Poverty |
| No Children | 285 (91.3%) | 27 (8.6%) |
| 1 or 2 Children | 72 (91.1%) | 7 (8.9%) |
| 3 or 4 Children | 47 (87.0%) | 7 (13.0%) |
| 5 or more Children | 0 (0.0%) | 0 (0.0%) |
| Total | 404 (90.8%) | 41 (9.2%) |
Income Below Poverty Among Single-Parent Households in Sky Valley
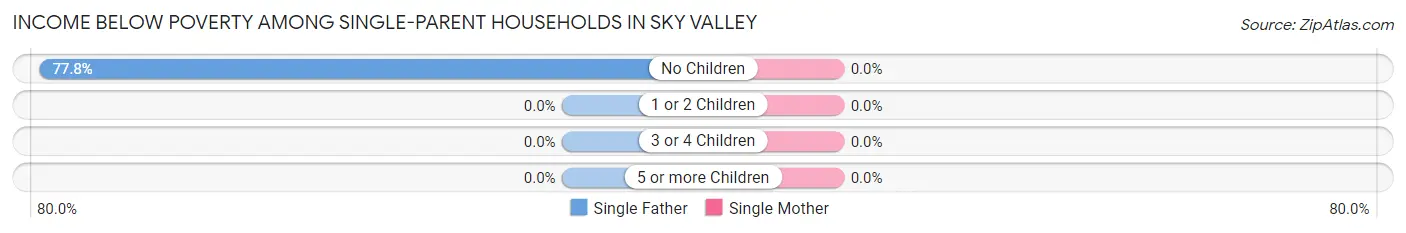
| Children | Single Father | Single Mother |
| No Children | 21 (77.8%) | 0 (0.0%) |
| 1 or 2 Children | 0 (0.0%) | 0 (0.0%) |
| 3 or 4 Children | 0 (0.0%) | 0 (0.0%) |
| 5 or more Children | 0 (0.0%) | 0 (0.0%) |
| Total | 21 (35.6%) | 0 (0.0%) |
Income Below Poverty Among Married-Couple vs Single-Parent Households in Sky Valley
The poverty data for Sky Valley shows that 41 of the married-couple family households (9.2%) and 21 of the single-parent households (23.9%) are living below the poverty level. Within the married-couple family households, those with 3 or 4 children have the highest poverty rate, with 7 households (13.0%) falling below the poverty line. Among the single-parent households, those with no children have the highest poverty rate, with 21 household (37.5%) living below poverty.
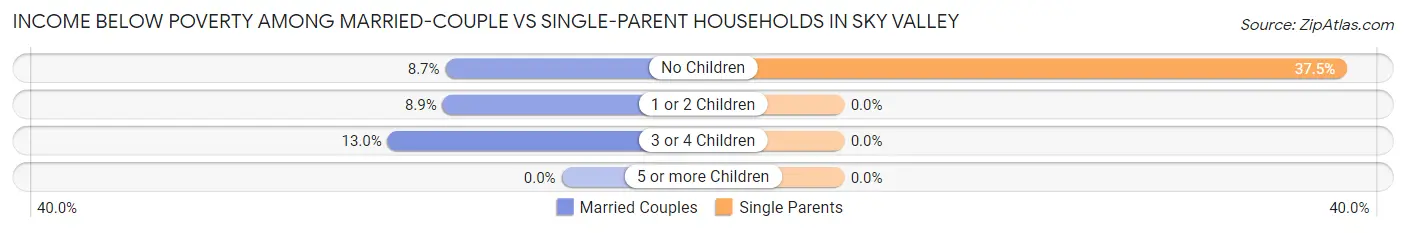
| Children | Married-Couple Families | Single-Parent Households |
| No Children | 27 (8.6%) | 21 (37.5%) |
| 1 or 2 Children | 7 (8.9%) | 0 (0.0%) |
| 3 or 4 Children | 7 (13.0%) | 0 (0.0%) |
| 5 or more Children | 0 (0.0%) | 0 (0.0%) |
| Total | 41 (9.2%) | 21 (23.9%) |
Race in Sky Valley
The most populous races in Sky Valley are White / Caucasian (1,496 | 64.8%), Hispanic or Latino (958 | 41.5%), and Some other Race (474 | 20.5%).
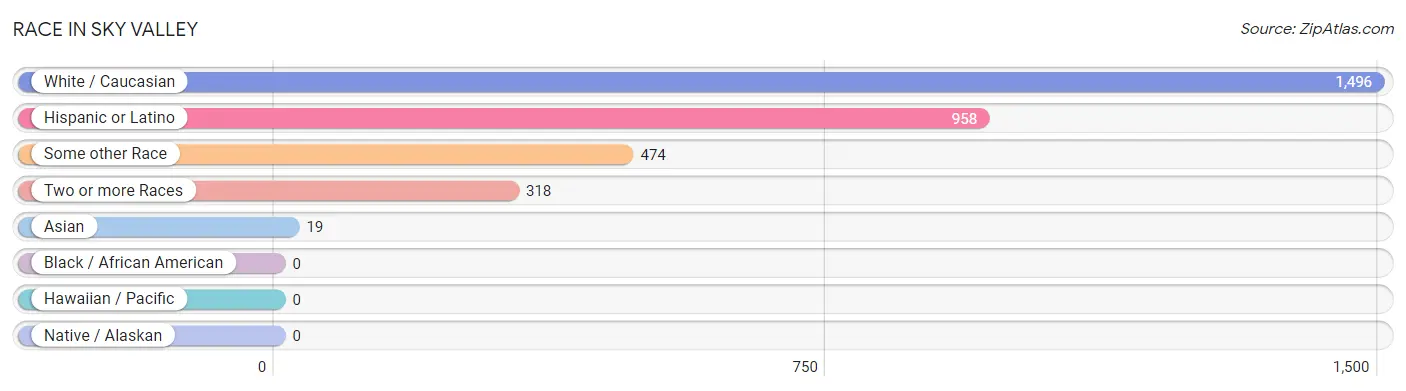
| Race | # Population | % Population |
| Asian | 19 | 0.8% |
| Black / African American | 0 | 0.0% |
| Hawaiian / Pacific | 0 | 0.0% |
| Hispanic or Latino | 958 | 41.5% |
| Native / Alaskan | 0 | 0.0% |
| White / Caucasian | 1,496 | 64.8% |
| Two or more Races | 318 | 13.8% |
| Some other Race | 474 | 20.5% |
| Total | 2,307 | 100.0% |
Ancestry in Sky Valley
The most populous ancestries reported in Sky Valley are Mexican (802 | 34.8%), English (311 | 13.5%), German (247 | 10.7%), Irish (205 | 8.9%), and Central American (119 | 5.2%), together accounting for 73.0% of all Sky Valley residents.
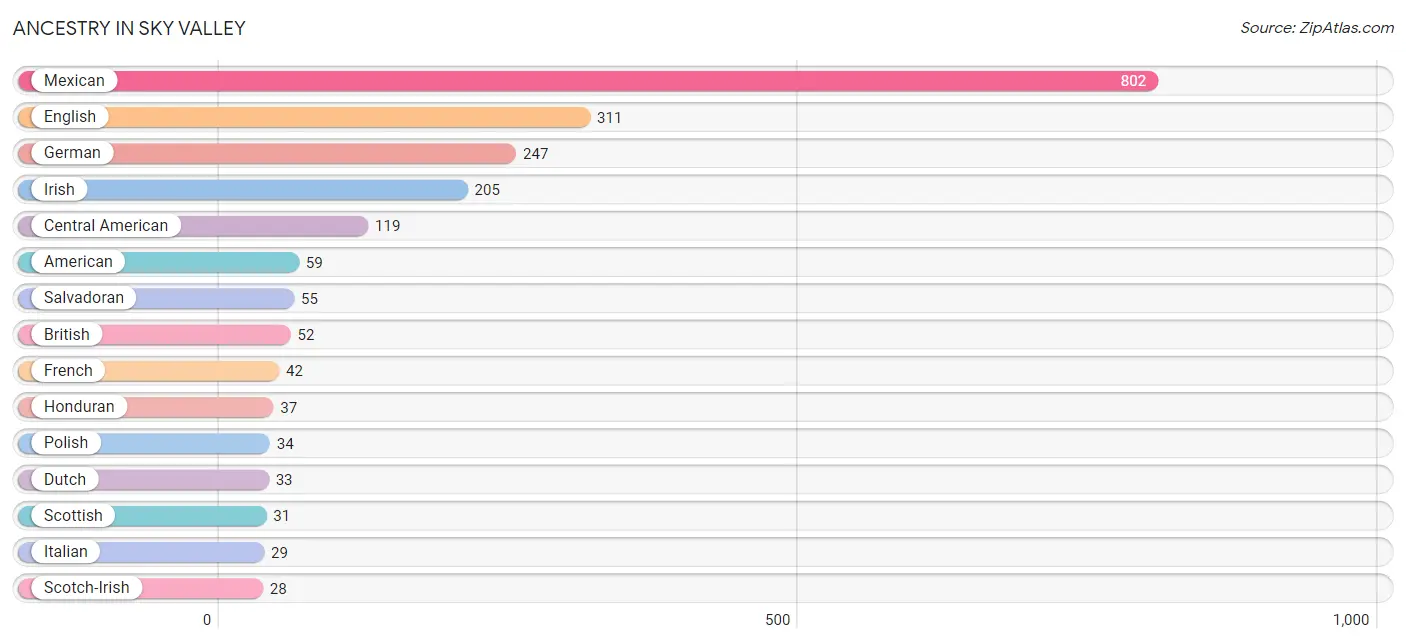
| Ancestry | # Population | % Population |
| African | 1 | 0.0% |
| Albanian | 6 | 0.3% |
| American | 59 | 2.6% |
| Bhutanese | 8 | 0.4% |
| British | 52 | 2.2% |
| Canadian | 13 | 0.6% |
| Central American | 119 | 5.2% |
| Cherokee | 16 | 0.7% |
| Czech | 27 | 1.2% |
| Danish | 9 | 0.4% |
| Dutch | 33 | 1.4% |
| Eastern European | 6 | 0.3% |
| English | 311 | 13.5% |
| European | 5 | 0.2% |
| French | 42 | 1.8% |
| French Canadian | 7 | 0.3% |
| German | 247 | 10.7% |
| Guamanian / Chamorro | 1 | 0.0% |
| Guatemalan | 27 | 1.2% |
| Honduran | 37 | 1.6% |
| Hungarian | 7 | 0.3% |
| Irish | 205 | 8.9% |
| Italian | 29 | 1.3% |
| Korean | 12 | 0.5% |
| Mexican | 802 | 34.8% |
| Native Hawaiian | 1 | 0.0% |
| Northern European | 9 | 0.4% |
| Norwegian | 23 | 1.0% |
| Polish | 34 | 1.5% |
| Romanian | 4 | 0.2% |
| Salvadoran | 55 | 2.4% |
| Scotch-Irish | 28 | 1.2% |
| Scottish | 31 | 1.3% |
| Subsaharan African | 1 | 0.0% |
| Swedish | 14 | 0.6% |
| Swiss | 28 | 1.2% |
| Ukrainian | 18 | 0.8% |
| Welsh | 12 | 0.5% | View All 38 Rows |
Immigrants in Sky Valley
The most numerous immigrant groups reported in Sky Valley came from Central America (253 | 11.0%), Latin America (253 | 11.0%), Mexico (193 | 8.4%), Canada (76 | 3.3%), and Europe (71 | 3.1%), together accounting for 36.7% of all Sky Valley residents.
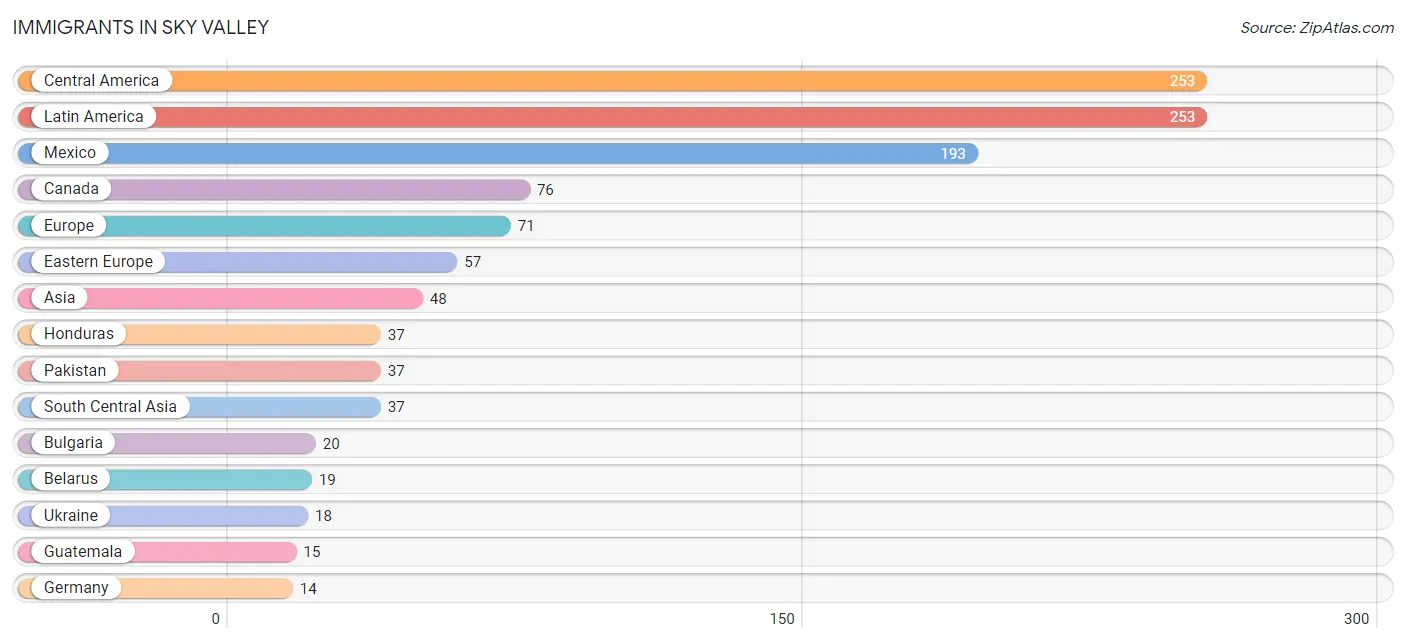
| Immigration Origin | # Population | % Population |
| Africa | 6 | 0.3% |
| Asia | 48 | 2.1% |
| Belarus | 19 | 0.8% |
| Bulgaria | 20 | 0.9% |
| Canada | 76 | 3.3% |
| Central America | 253 | 11.0% |
| Eastern Europe | 57 | 2.5% |
| Egypt | 6 | 0.3% |
| El Salvador | 8 | 0.4% |
| Europe | 71 | 3.1% |
| Germany | 14 | 0.6% |
| Guatemala | 15 | 0.6% |
| Honduras | 37 | 1.6% |
| Latin America | 253 | 11.0% |
| Mexico | 193 | 8.4% |
| Northern Africa | 6 | 0.3% |
| Pakistan | 37 | 1.6% |
| Philippines | 11 | 0.5% |
| South Central Asia | 37 | 1.6% |
| South Eastern Asia | 11 | 0.5% |
| Ukraine | 18 | 0.8% |
| Western Europe | 14 | 0.6% | View All 22 Rows |
Sex and Age in Sky Valley
Sex and Age in Sky Valley
The most populous age groups in Sky Valley are 75 to 79 Years (139 | 12.6%) for men and 65 to 69 Years (117 | 9.7%) for women.
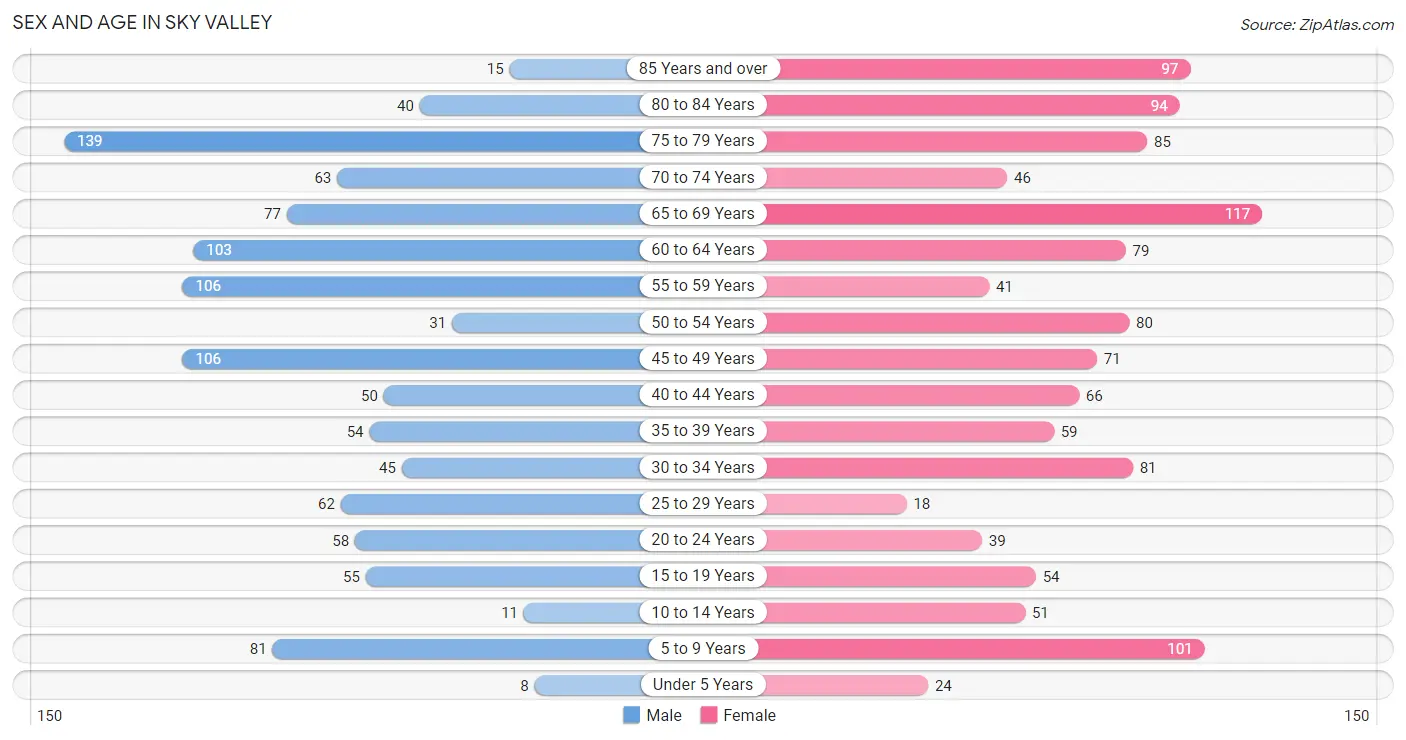
| Age Bracket | Male | Female |
| Under 5 Years | 8 (0.7%) | 24 (2.0%) |
| 5 to 9 Years | 81 (7.3%) | 101 (8.4%) |
| 10 to 14 Years | 11 (1.0%) | 51 (4.2%) |
| 15 to 19 Years | 55 (5.0%) | 54 (4.5%) |
| 20 to 24 Years | 58 (5.2%) | 39 (3.2%) |
| 25 to 29 Years | 62 (5.6%) | 18 (1.5%) |
| 30 to 34 Years | 45 (4.1%) | 81 (6.7%) |
| 35 to 39 Years | 54 (4.9%) | 59 (4.9%) |
| 40 to 44 Years | 50 (4.5%) | 66 (5.5%) |
| 45 to 49 Years | 106 (9.6%) | 71 (5.9%) |
| 50 to 54 Years | 31 (2.8%) | 80 (6.7%) |
| 55 to 59 Years | 106 (9.6%) | 41 (3.4%) |
| 60 to 64 Years | 103 (9.3%) | 79 (6.6%) |
| 65 to 69 Years | 77 (7.0%) | 117 (9.7%) |
| 70 to 74 Years | 63 (5.7%) | 46 (3.8%) |
| 75 to 79 Years | 139 (12.6%) | 85 (7.1%) |
| 80 to 84 Years | 40 (3.6%) | 94 (7.8%) |
| 85 Years and over | 15 (1.4%) | 97 (8.1%) |
| Total | 1,104 (100.0%) | 1,203 (100.0%) |
Families and Households in Sky Valley
Median Family Size in Sky Valley
The median family size in Sky Valley is 3.12 persons per family, with married-couple families (445 | 83.5%) accounting for the largest median family size of 3.19 persons per family. On the other hand, single female/mother families (29 | 5.4%) represent the smallest median family size with 2.52 persons per family.
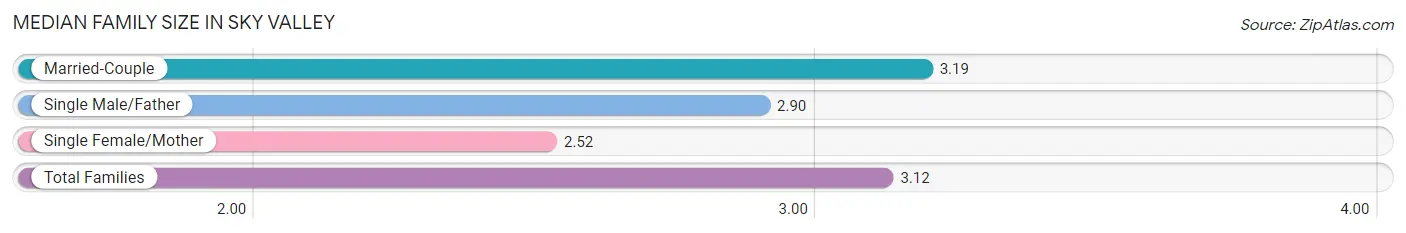
| Family Type | # Families | Family Size |
| Married-Couple | 445 (83.5%) | 3.19 |
| Single Male/Father | 59 (11.1%) | 2.90 |
| Single Female/Mother | 29 (5.4%) | 2.52 |
| Total Families | 533 (100.0%) | 3.12 |
Median Household Size in Sky Valley
The median household size in Sky Valley is 2.28 persons per household, with single male/father households (59 | 5.9%) accounting for the largest median household size of 4.68 persons per household. non-family households (461 | 46.4%) represent the smallest median household size with 1.06 persons per household.
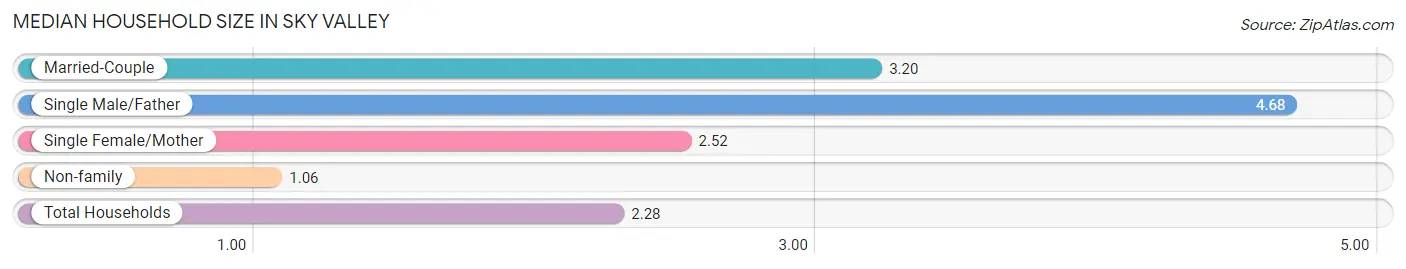
| Household Type | # Households | Household Size |
| Married-Couple | 445 (44.8%) | 3.20 |
| Single Male/Father | 59 (5.9%) | 4.68 |
| Single Female/Mother | 29 (2.9%) | 2.52 |
| Non-family | 461 (46.4%) | 1.06 |
| Total Households | 994 (100.0%) | 2.28 |
Household Size by Marriage Status in Sky Valley
Out of a total of 994 households in Sky Valley, 533 (53.6%) are family households, while 461 (46.4%) are nonfamily households. The most numerous type of family households are 2-person households, comprising 286, and the most common type of nonfamily households are 1-person households, comprising 434.
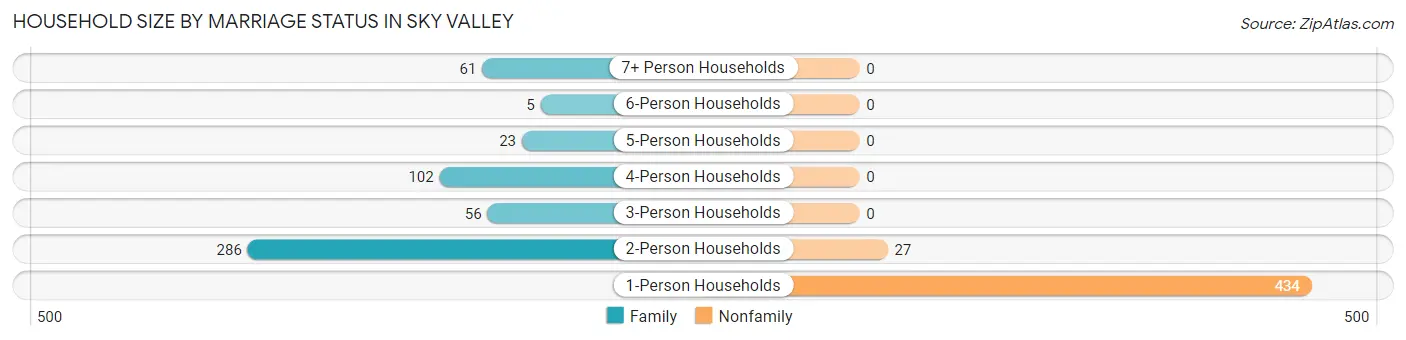
| Household Size | Family Households | Nonfamily Households |
| 1-Person Households | - | 434 (43.7%) |
| 2-Person Households | 286 (28.8%) | 27 (2.7%) |
| 3-Person Households | 56 (5.6%) | 0 (0.0%) |
| 4-Person Households | 102 (10.3%) | 0 (0.0%) |
| 5-Person Households | 23 (2.3%) | 0 (0.0%) |
| 6-Person Households | 5 (0.5%) | 0 (0.0%) |
| 7+ Person Households | 61 (6.1%) | 0 (0.0%) |
| Total | 533 (53.6%) | 461 (46.4%) |
Female Fertility in Sky Valley
Fertility by Age in Sky Valley
Average fertility rate in Sky Valley is 23.0 births per 1,000 women. Women in the age bracket of 35 to 50 years have the highest fertility rate with 46.0 births per 1,000 women. Women in the age bracket of 35 to 50 years acount for 100.0% of all women with births.
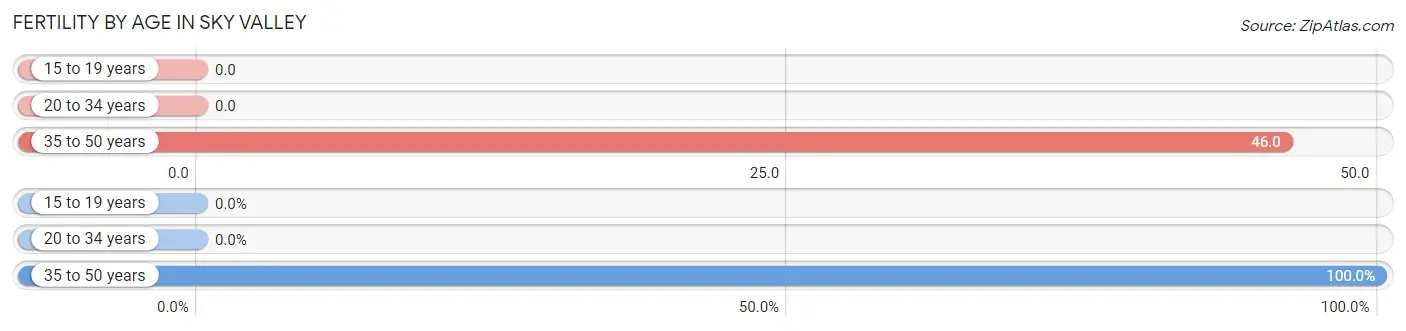
| Age Bracket | Women with Births | Births / 1,000 Women |
| 15 to 19 years | 0 (0.0%) | 0.0 |
| 20 to 34 years | 0 (0.0%) | 0.0 |
| 35 to 50 years | 9 (100.0%) | 46.0 |
| Total | 9 (100.0%) | 23.0 |
Fertility by Age by Marriage Status in Sky Valley
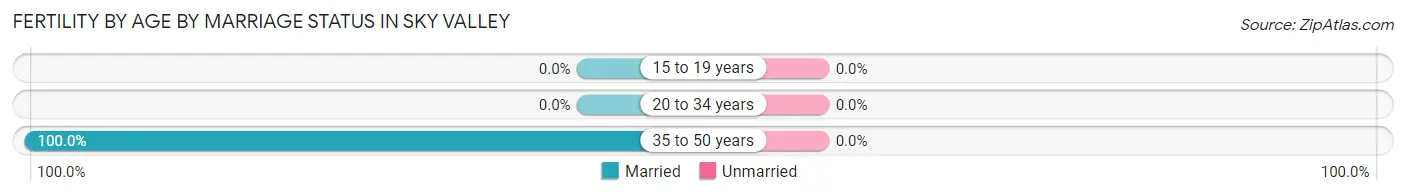
| Age Bracket | Married | Unmarried |
| 15 to 19 years | 0 (0.0%) | 0 (0.0%) |
| 20 to 34 years | 0 (0.0%) | 0 (0.0%) |
| 35 to 50 years | 9 (100.0%) | 0 (0.0%) |
| Total | 9 (100.0%) | 0 (0.0%) |
Fertility by Education in Sky Valley
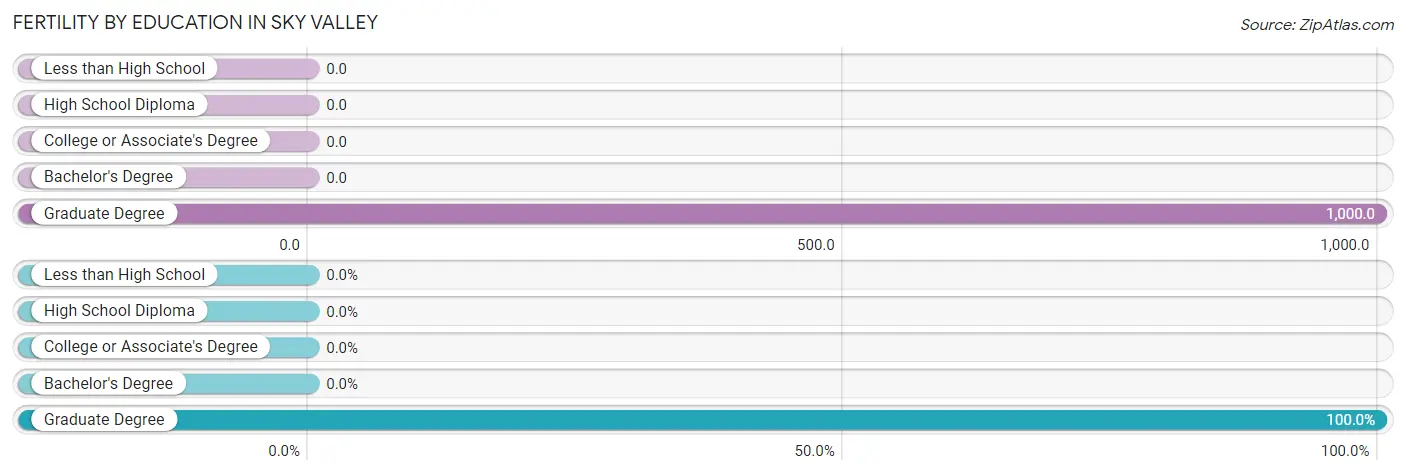
| Educational Attainment | Women with Births | Births / 1,000 Women |
| Less than High School | 0 (0.0%) | 0.0 |
| High School Diploma | 0 (0.0%) | 0.0 |
| College or Associate's Degree | 0 (0.0%) | 0.0 |
| Bachelor's Degree | 0 (0.0%) | 0.0 |
| Graduate Degree | 9 (100.0%) | 1,000.0 |
| Total | 9 (100.0%) | 23.0 |
Fertility by Education by Marriage Status in Sky Valley
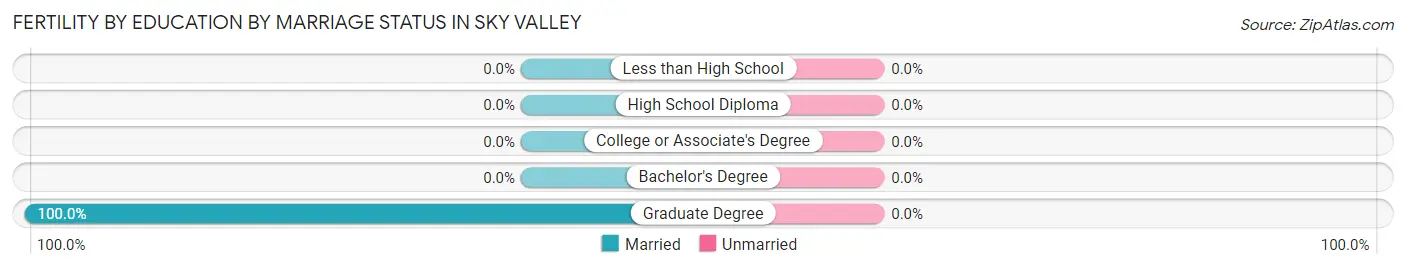
| Educational Attainment | Married | Unmarried |
| Less than High School | 0 (0.0%) | 0 (0.0%) |
| High School Diploma | 0 (0.0%) | 0 (0.0%) |
| College or Associate's Degree | 0 (0.0%) | 0 (0.0%) |
| Bachelor's Degree | 0 (0.0%) | 0 (0.0%) |
| Graduate Degree | 9 (100.0%) | 0 (0.0%) |
| Total | 9 (100.0%) | 0 (0.0%) |
Employment Characteristics in Sky Valley
Employment by Class of Employer in Sky Valley
Among the 782 employed individuals in Sky Valley, private company employees (350 | 44.8%), self-employed (incorporated) (158 | 20.2%), and self-employed (not incorporated) (118 | 15.1%) make up the most common classes of employment.
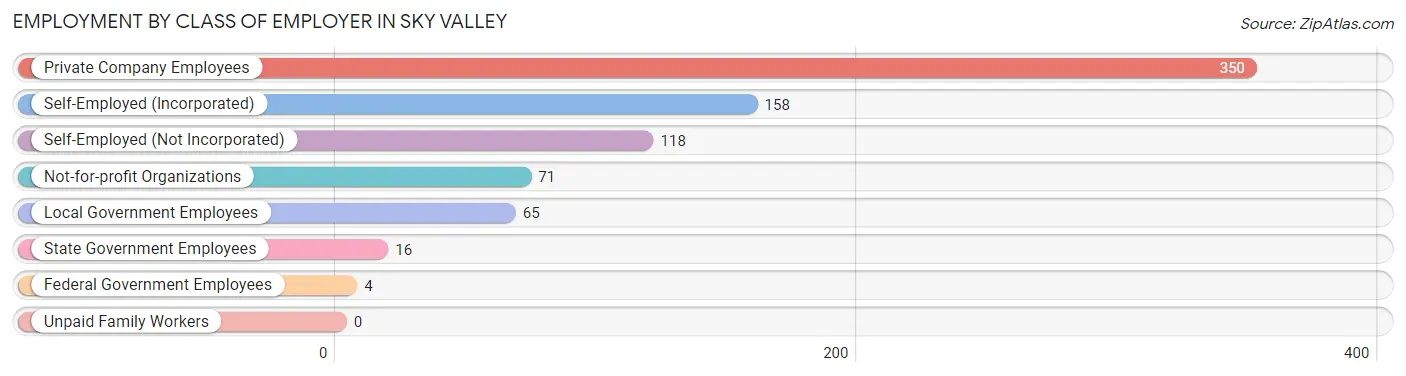
| Employer Class | # Employees | % Employees |
| Private Company Employees | 350 | 44.8% |
| Self-Employed (Incorporated) | 158 | 20.2% |
| Self-Employed (Not Incorporated) | 118 | 15.1% |
| Not-for-profit Organizations | 71 | 9.1% |
| Local Government Employees | 65 | 8.3% |
| State Government Employees | 16 | 2.1% |
| Federal Government Employees | 4 | 0.5% |
| Unpaid Family Workers | 0 | 0.0% |
| Total | 782 | 100.0% |
Employment Status by Age in Sky Valley
According to the labor force statistics for Sky Valley, out of the total population over 16 years of age (2,021), 43.3% or 875 individuals are in the labor force, with 10.6% or 93 of them unemployed. The age group with the highest labor force participation rate is 35 to 44 years, with 85.6% or 196 individuals in the labor force. Within the labor force, the 65 to 74 years age range has the highest percentage of unemployed individuals, with 27.7% or 18 of them being unemployed.
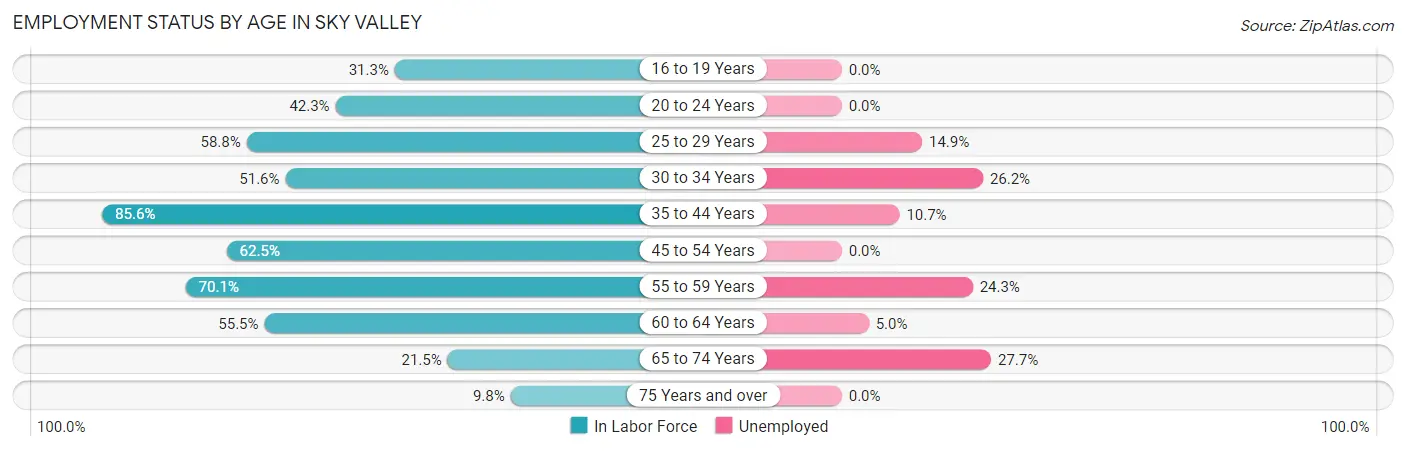
| Age Bracket | In Labor Force | Unemployed |
| 16 to 19 Years | 31 (31.3%) | 0 (0.0%) |
| 20 to 24 Years | 41 (42.3%) | 0 (0.0%) |
| 25 to 29 Years | 47 (58.8%) | 7 (14.9%) |
| 30 to 34 Years | 65 (51.6%) | 17 (26.2%) |
| 35 to 44 Years | 196 (85.6%) | 21 (10.7%) |
| 45 to 54 Years | 180 (62.5%) | 0 (0.0%) |
| 55 to 59 Years | 103 (70.1%) | 25 (24.3%) |
| 60 to 64 Years | 101 (55.5%) | 5 (5.0%) |
| 65 to 74 Years | 65 (21.5%) | 18 (27.7%) |
| 75 Years and over | 46 (9.8%) | 0 (0.0%) |
| Total | 875 (43.3%) | 93 (10.6%) |
Employment Status by Educational Attainment in Sky Valley
According to labor force statistics for Sky Valley, 65.8% of individuals (692) out of the total population between 25 and 64 years of age (1,052) are in the labor force, with 10.8% or 75 of them being unemployed. The group with the highest labor force participation rate are those with the educational attainment of college / associate degree, with 74.0% or 282 individuals in the labor force. Within the labor force, individuals with high school diploma education have the highest percentage of unemployment, with 25.0% or 42 of them being unemployed.
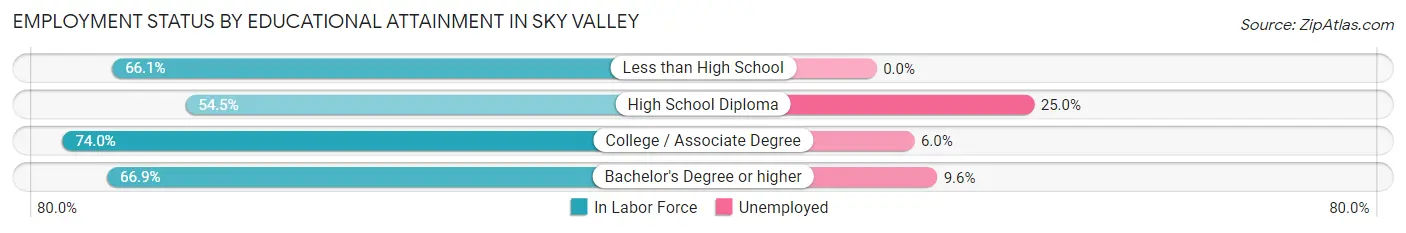
| Educational Attainment | In Labor Force | Unemployed |
| Less than High School | 76 (66.1%) | 0 (0.0%) |
| High School Diploma | 168 (54.5%) | 77 (25.0%) |
| College / Associate Degree | 282 (74.0%) | 23 (6.0%) |
| Bachelor's Degree or higher | 166 (66.9%) | 24 (9.6%) |
| Total | 692 (65.8%) | 114 (10.8%) |
Employment Occupations by Sex in Sky Valley
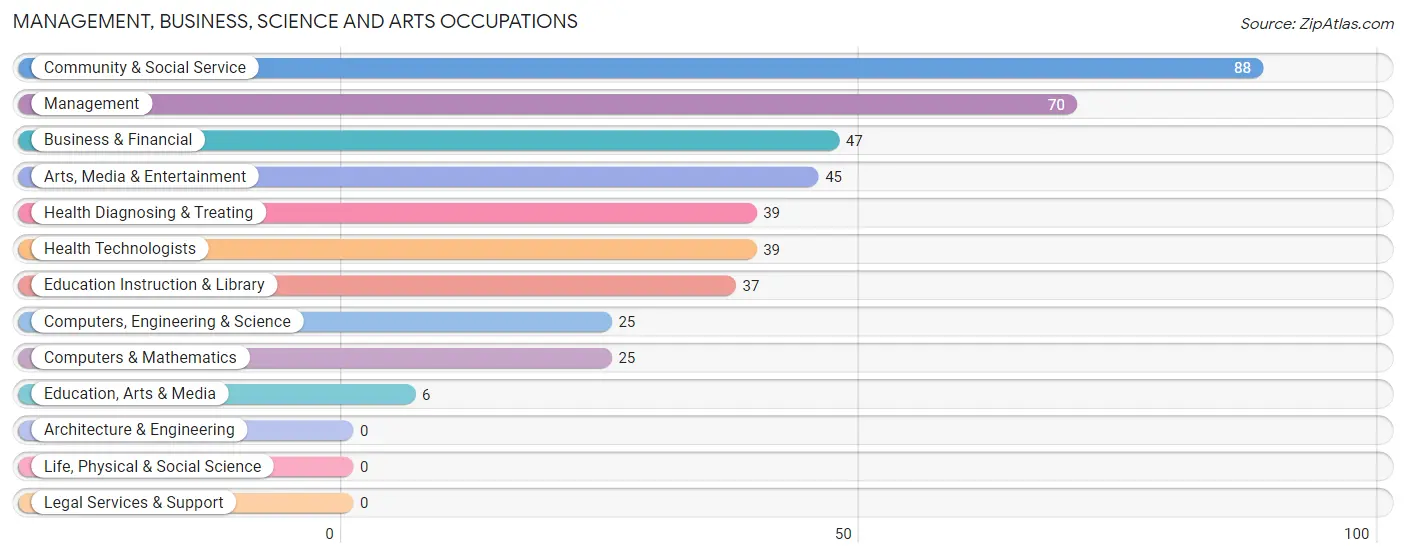
Management, Business, Science and Arts Occupations
The most common Management, Business, Science and Arts occupations in Sky Valley are Community & Social Service (88 | 11.3%), Management (70 | 8.9%), Business & Financial (47 | 6.0%), Arts, Media & Entertainment (45 | 5.8%), and Health Diagnosing & Treating (39 | 5.0%).
Management, Business, Science and Arts Occupations by Sex
Within the Management, Business, Science and Arts occupations in Sky Valley, the most male-oriented occupations are Health Diagnosing & Treating (100.0%), Health Technologists (100.0%), and Computers, Engineering & Science (76.0%), while the most female-oriented occupations are Education, Arts & Media (100.0%), Management (81.4%), and Education Instruction & Library (78.4%).
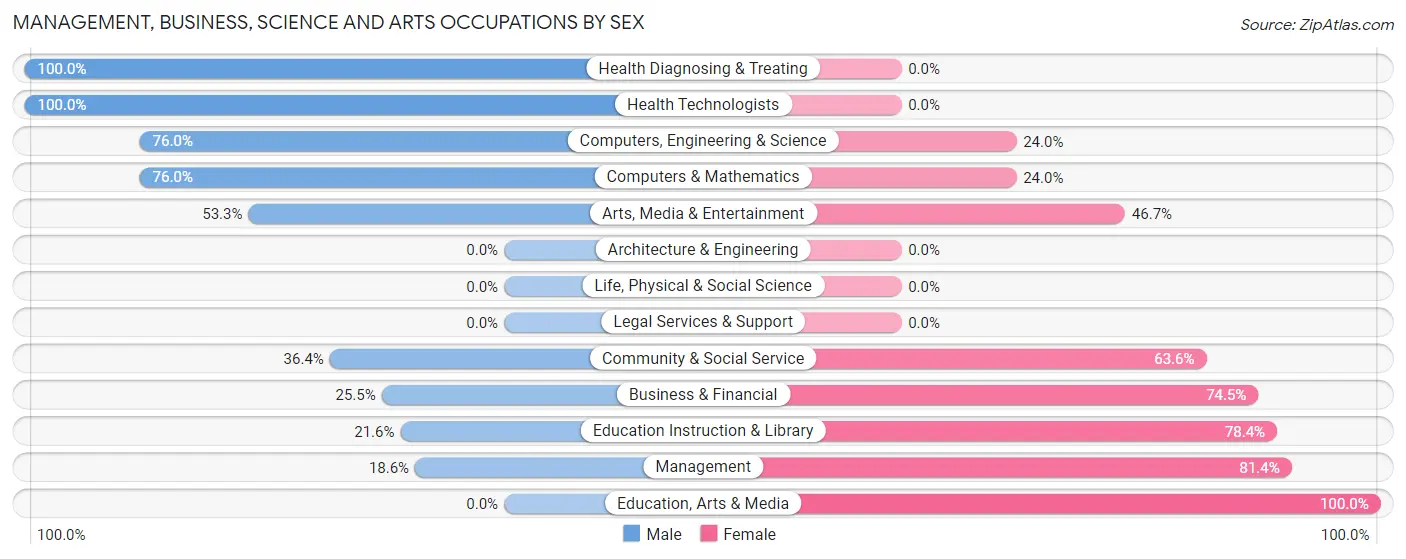
| Occupation | Male | Female |
| Management | 13 (18.6%) | 57 (81.4%) |
| Business & Financial | 12 (25.5%) | 35 (74.5%) |
| Computers, Engineering & Science | 19 (76.0%) | 6 (24.0%) |
| Computers & Mathematics | 19 (76.0%) | 6 (24.0%) |
| Architecture & Engineering | 0 (0.0%) | 0 (0.0%) |
| Life, Physical & Social Science | 0 (0.0%) | 0 (0.0%) |
| Community & Social Service | 32 (36.4%) | 56 (63.6%) |
| Education, Arts & Media | 0 (0.0%) | 6 (100.0%) |
| Legal Services & Support | 0 (0.0%) | 0 (0.0%) |
| Education Instruction & Library | 8 (21.6%) | 29 (78.4%) |
| Arts, Media & Entertainment | 24 (53.3%) | 21 (46.7%) |
| Health Diagnosing & Treating | 39 (100.0%) | 0 (0.0%) |
| Health Technologists | 39 (100.0%) | 0 (0.0%) |
| Total (Category) | 115 (42.7%) | 154 (57.3%) |
| Total (Overall) | 421 (53.8%) | 361 (46.2%) |
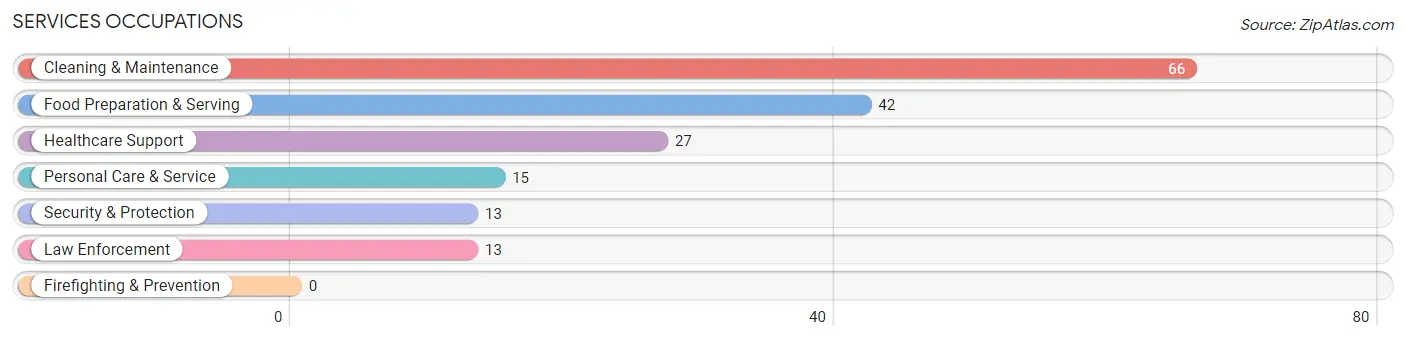
Services Occupations
The most common Services occupations in Sky Valley are Cleaning & Maintenance (66 | 8.4%), Food Preparation & Serving (42 | 5.4%), Healthcare Support (27 | 3.5%), Personal Care & Service (15 | 1.9%), and Security & Protection (13 | 1.7%).
Services Occupations by Sex
Within the Services occupations in Sky Valley, the most male-oriented occupations are Security & Protection (100.0%), Law Enforcement (100.0%), and Cleaning & Maintenance (78.8%), while the most female-oriented occupations are Healthcare Support (100.0%), Food Preparation & Serving (73.8%), and Personal Care & Service (46.7%).
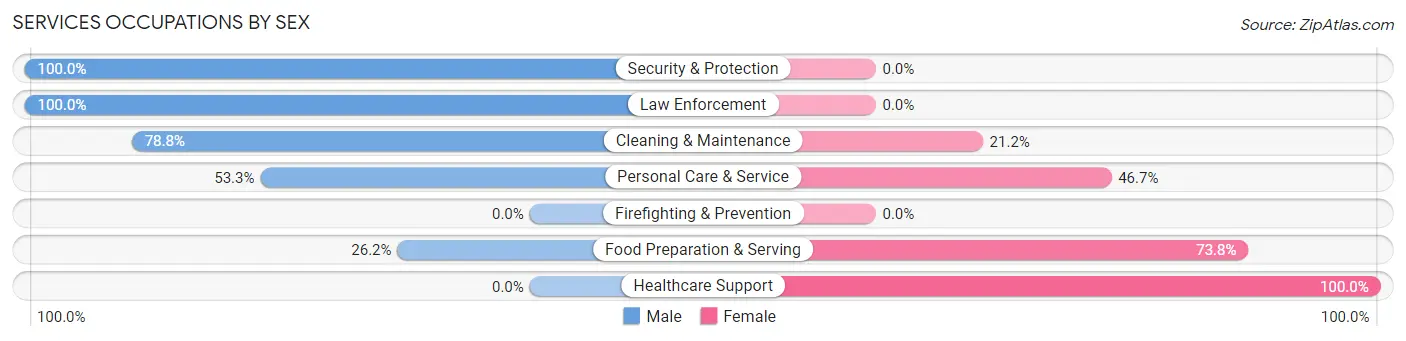
| Occupation | Male | Female |
| Healthcare Support | 0 (0.0%) | 27 (100.0%) |
| Security & Protection | 13 (100.0%) | 0 (0.0%) |
| Firefighting & Prevention | 0 (0.0%) | 0 (0.0%) |
| Law Enforcement | 13 (100.0%) | 0 (0.0%) |
| Food Preparation & Serving | 11 (26.2%) | 31 (73.8%) |
| Cleaning & Maintenance | 52 (78.8%) | 14 (21.2%) |
| Personal Care & Service | 8 (53.3%) | 7 (46.7%) |
| Total (Category) | 84 (51.5%) | 79 (48.5%) |
| Total (Overall) | 421 (53.8%) | 361 (46.2%) |
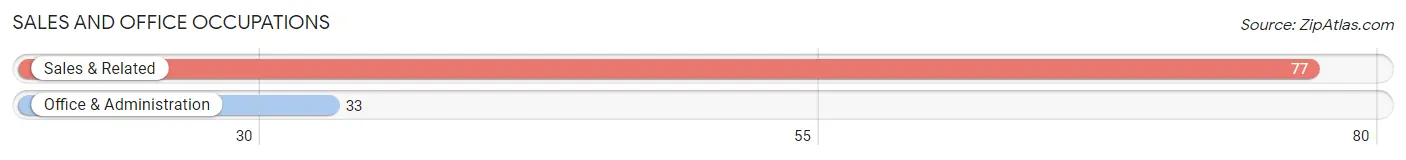
Sales and Office Occupations
The most common Sales and Office occupations in Sky Valley are Sales & Related (77 | 9.9%), and Office & Administration (33 | 4.2%).
Sales and Office Occupations by Sex
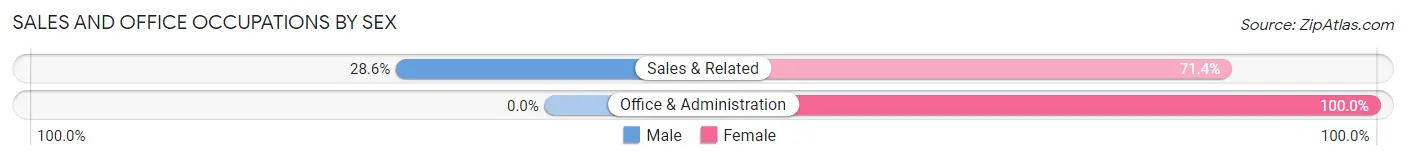
| Occupation | Male | Female |
| Sales & Related | 22 (28.6%) | 55 (71.4%) |
| Office & Administration | 0 (0.0%) | 33 (100.0%) |
| Total (Category) | 22 (20.0%) | 88 (80.0%) |
| Total (Overall) | 421 (53.8%) | 361 (46.2%) |
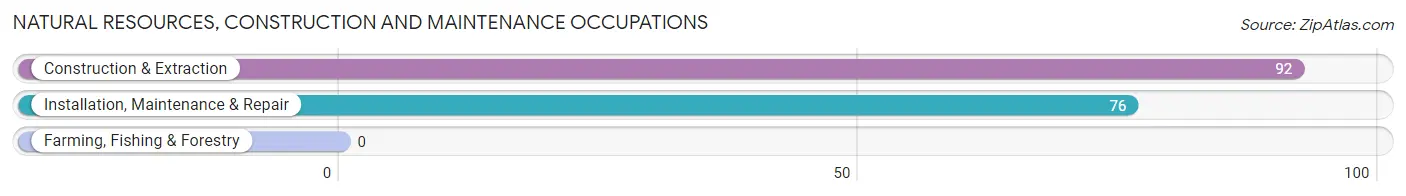
Natural Resources, Construction and Maintenance Occupations
The most common Natural Resources, Construction and Maintenance occupations in Sky Valley are Construction & Extraction (92 | 11.8%), and Installation, Maintenance & Repair (76 | 9.7%).
Natural Resources, Construction and Maintenance Occupations by Sex
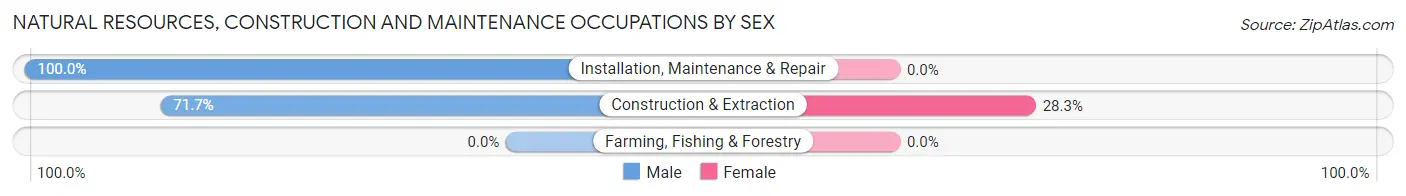
| Occupation | Male | Female |
| Farming, Fishing & Forestry | 0 (0.0%) | 0 (0.0%) |
| Construction & Extraction | 66 (71.7%) | 26 (28.3%) |
| Installation, Maintenance & Repair | 76 (100.0%) | 0 (0.0%) |
| Total (Category) | 142 (84.5%) | 26 (15.5%) |
| Total (Overall) | 421 (53.8%) | 361 (46.2%) |
Production, Transportation and Moving Occupations
The most common Production, Transportation and Moving occupations in Sky Valley are Transportation (65 | 8.3%), and Material Moving (7 | 0.9%).
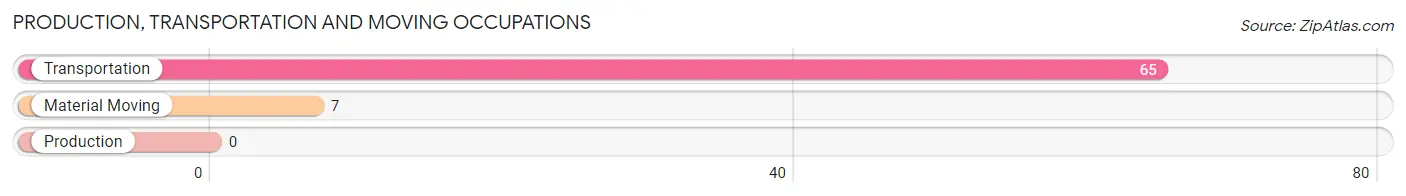
Production, Transportation and Moving Occupations by Sex
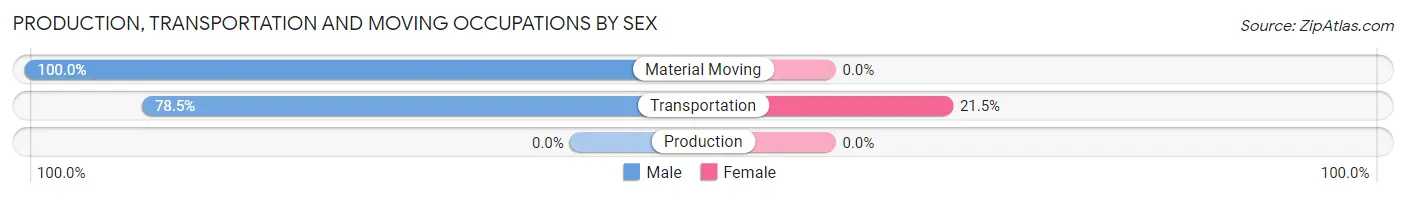
| Occupation | Male | Female |
| Production | 0 (0.0%) | 0 (0.0%) |
| Transportation | 51 (78.5%) | 14 (21.5%) |
| Material Moving | 7 (100.0%) | 0 (0.0%) |
| Total (Category) | 58 (80.6%) | 14 (19.4%) |
| Total (Overall) | 421 (53.8%) | 361 (46.2%) |
Employment Industries by Sex in Sky Valley
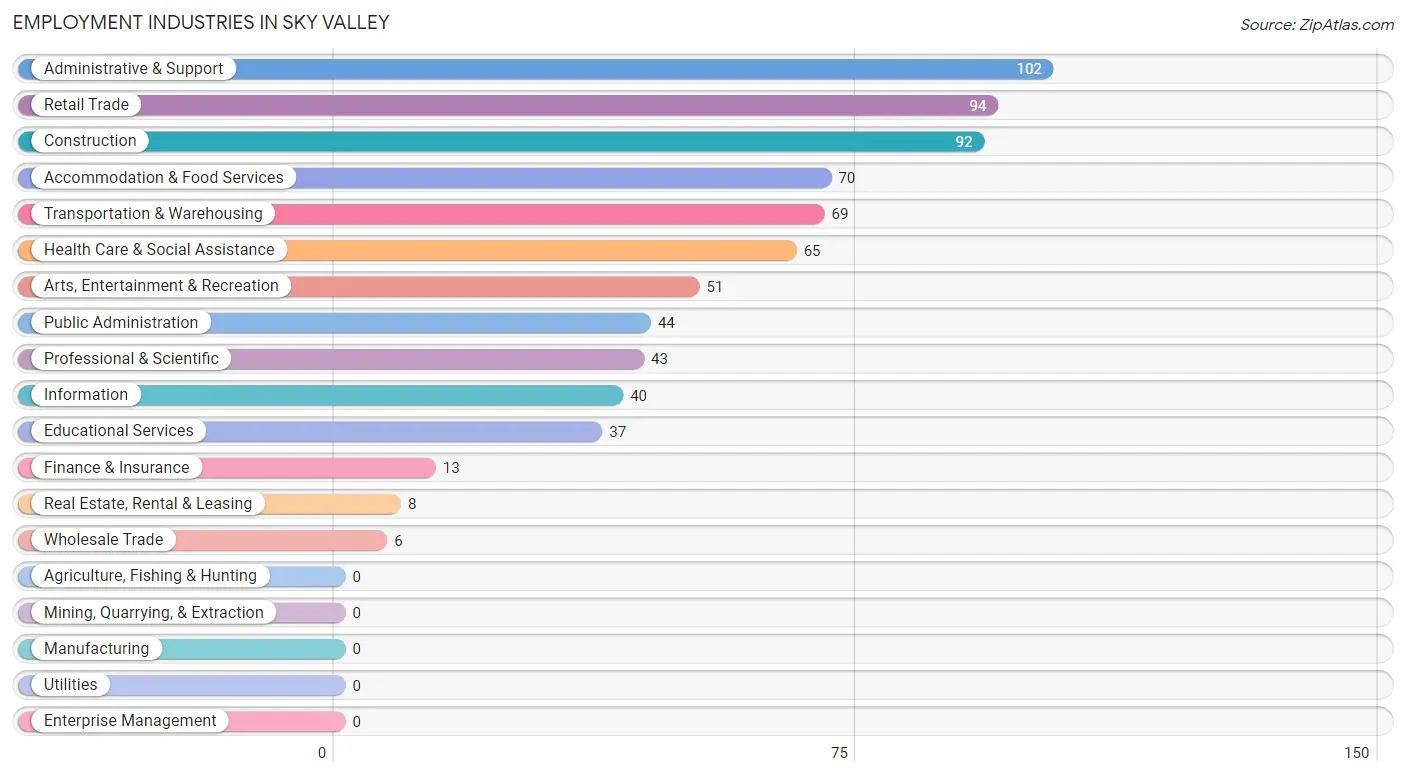
Employment Industries in Sky Valley
The major employment industries in Sky Valley include Administrative & Support (102 | 13.0%), Retail Trade (94 | 12.0%), Construction (92 | 11.8%), Accommodation & Food Services (70 | 8.9%), and Transportation & Warehousing (69 | 8.8%).
Employment Industries by Sex in Sky Valley
The Sky Valley industries that see more men than women are Wholesale Trade (100.0%), Finance & Insurance (100.0%), and Transportation & Warehousing (84.1%), whereas the industries that tend to have a higher number of women are Real Estate, Rental & Leasing (100.0%), Information (87.5%), and Educational Services (78.4%).
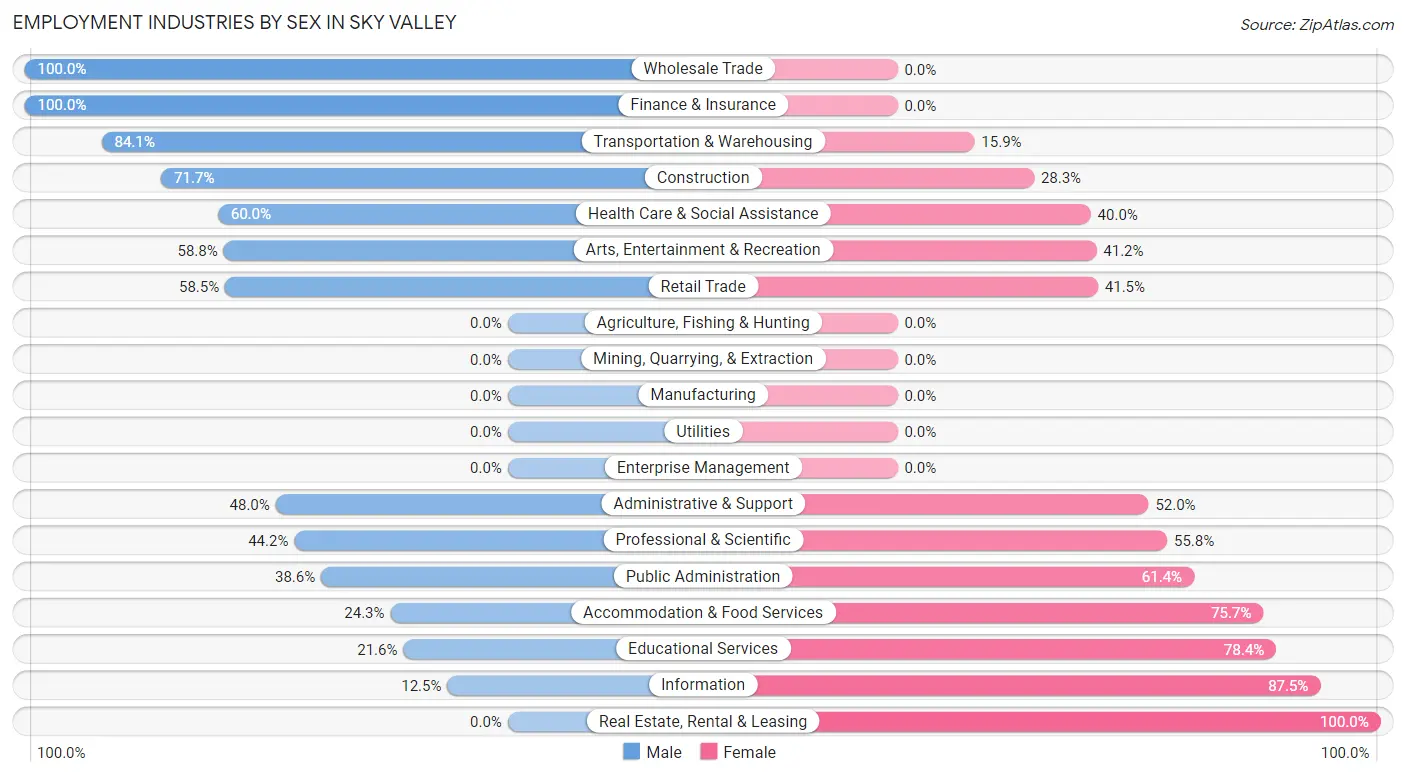
| Industry | Male | Female |
| Agriculture, Fishing & Hunting | 0 (0.0%) | 0 (0.0%) |
| Mining, Quarrying, & Extraction | 0 (0.0%) | 0 (0.0%) |
| Construction | 66 (71.7%) | 26 (28.3%) |
| Manufacturing | 0 (0.0%) | 0 (0.0%) |
| Wholesale Trade | 6 (100.0%) | 0 (0.0%) |
| Retail Trade | 55 (58.5%) | 39 (41.5%) |
| Transportation & Warehousing | 58 (84.1%) | 11 (15.9%) |
| Utilities | 0 (0.0%) | 0 (0.0%) |
| Information | 5 (12.5%) | 35 (87.5%) |
| Finance & Insurance | 13 (100.0%) | 0 (0.0%) |
| Real Estate, Rental & Leasing | 0 (0.0%) | 8 (100.0%) |
| Professional & Scientific | 19 (44.2%) | 24 (55.8%) |
| Enterprise Management | 0 (0.0%) | 0 (0.0%) |
| Administrative & Support | 49 (48.0%) | 53 (52.0%) |
| Educational Services | 8 (21.6%) | 29 (78.4%) |
| Health Care & Social Assistance | 39 (60.0%) | 26 (40.0%) |
| Arts, Entertainment & Recreation | 30 (58.8%) | 21 (41.2%) |
| Accommodation & Food Services | 17 (24.3%) | 53 (75.7%) |
| Public Administration | 17 (38.6%) | 27 (61.4%) |
| Total | 421 (53.8%) | 361 (46.2%) |
Education in Sky Valley
School Enrollment in Sky Valley
The most common levels of schooling among the 473 students in Sky Valley are elementary school (176 | 37.2%), college / undergraduate (127 | 26.9%), and high school (76 | 16.1%).
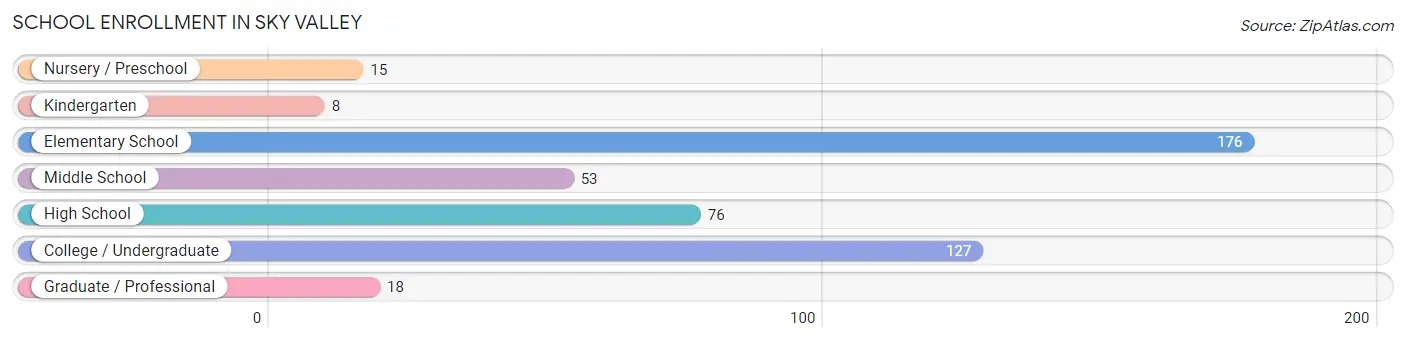
| School Level | # Students | % Students |
| Nursery / Preschool | 15 | 3.2% |
| Kindergarten | 8 | 1.7% |
| Elementary School | 176 | 37.2% |
| Middle School | 53 | 11.2% |
| High School | 76 | 16.1% |
| College / Undergraduate | 127 | 26.9% |
| Graduate / Professional | 18 | 3.8% |
| Total | 473 | 100.0% |
School Enrollment by Age by Funding Source in Sky Valley
Out of a total of 473 students who are enrolled in schools in Sky Valley, 41 (8.7%) attend a private institution, while the remaining 432 (91.3%) are enrolled in public schools. The age group of 3 to 4 year olds has the highest likelihood of being enrolled in private schools, with 7 (46.7% in the age bracket) enrolled. Conversely, the age group of 5 to 9 year old has the lowest likelihood of being enrolled in a private school, with 175 (100.0% in the age bracket) attending a public institution.
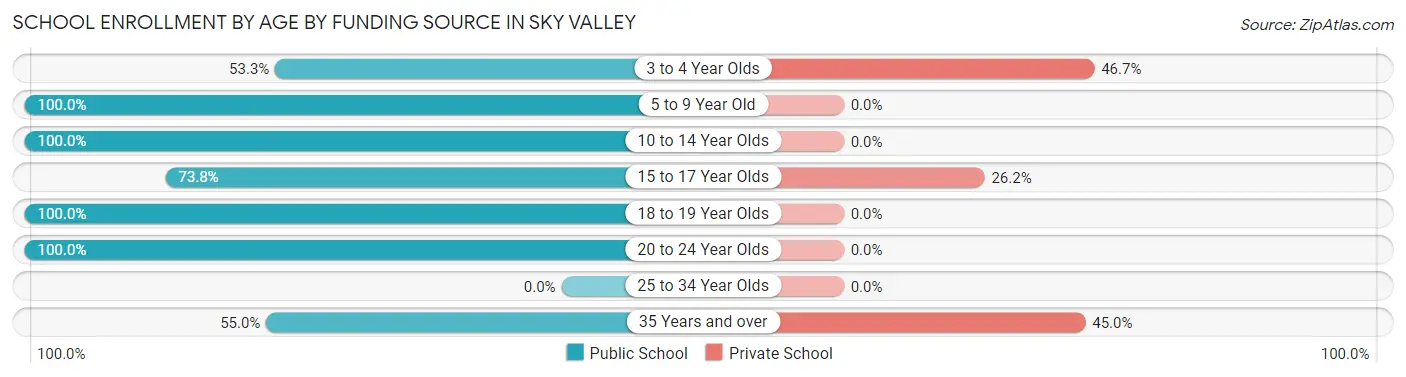
| Age Bracket | Public School | Private School |
| 3 to 4 Year Olds | 8 (53.3%) | 7 (46.7%) |
| 5 to 9 Year Old | 175 (100.0%) | 0 (0.0%) |
| 10 to 14 Year Olds | 62 (100.0%) | 0 (0.0%) |
| 15 to 17 Year Olds | 45 (73.8%) | 16 (26.2%) |
| 18 to 19 Year Olds | 40 (100.0%) | 0 (0.0%) |
| 20 to 24 Year Olds | 80 (100.0%) | 0 (0.0%) |
| 25 to 34 Year Olds | 0 (0.0%) | 0 (0.0%) |
| 35 Years and over | 22 (55.0%) | 18 (45.0%) |
| Total | 432 (91.3%) | 41 (8.7%) |
Educational Attainment by Field of Study in Sky Valley
Social sciences (70 | 14.8%), science & technology (69 | 14.6%), bio, nature & agricultural (66 | 14.0%), education (61 | 12.9%), and visual & performing arts (48 | 10.2%) are the most common fields of study among 473 individuals in Sky Valley who have obtained a bachelor's degree or higher.
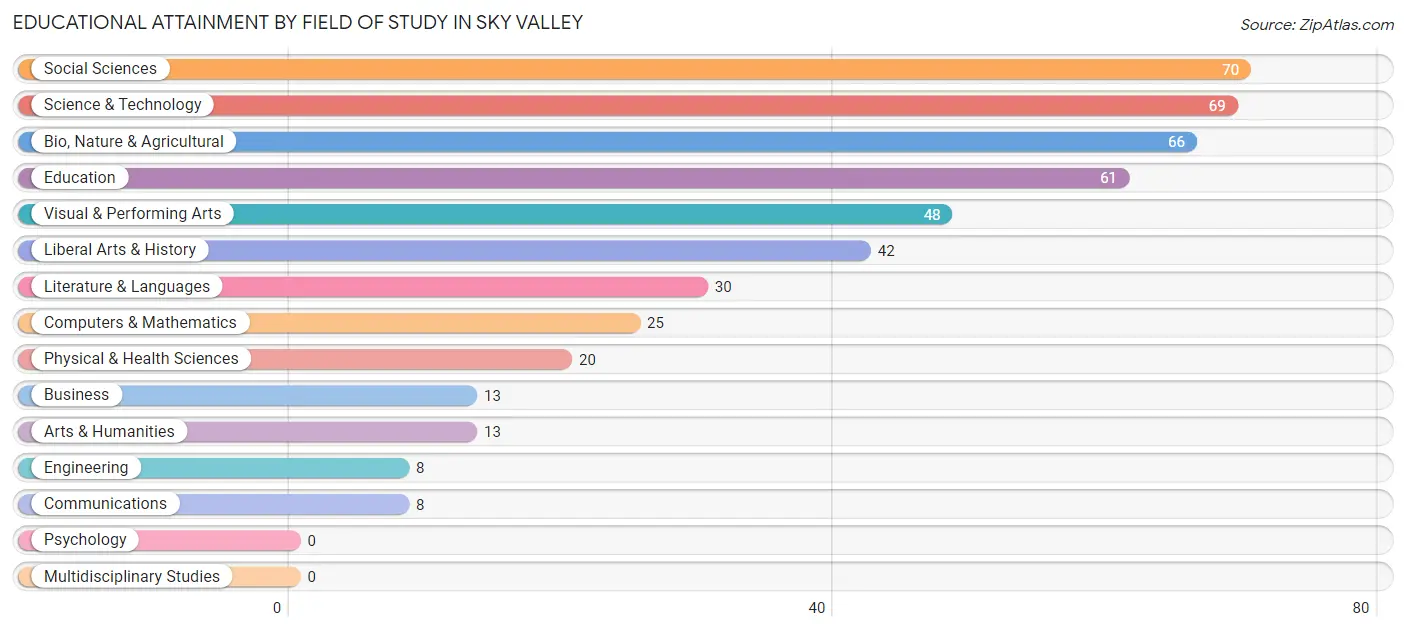
| Field of Study | # Graduates | % Graduates |
| Computers & Mathematics | 25 | 5.3% |
| Bio, Nature & Agricultural | 66 | 14.0% |
| Physical & Health Sciences | 20 | 4.2% |
| Psychology | 0 | 0.0% |
| Social Sciences | 70 | 14.8% |
| Engineering | 8 | 1.7% |
| Multidisciplinary Studies | 0 | 0.0% |
| Science & Technology | 69 | 14.6% |
| Business | 13 | 2.8% |
| Education | 61 | 12.9% |
| Literature & Languages | 30 | 6.3% |
| Liberal Arts & History | 42 | 8.9% |
| Visual & Performing Arts | 48 | 10.2% |
| Communications | 8 | 1.7% |
| Arts & Humanities | 13 | 2.8% |
| Total | 473 | 100.0% |
Transportation & Commute in Sky Valley
Vehicle Availability by Sex in Sky Valley
The most prevalent vehicle ownership categories in Sky Valley are males with 4 vehicles (129, accounting for 30.7%) and females with 4 vehicles (118, making up 39.8%).
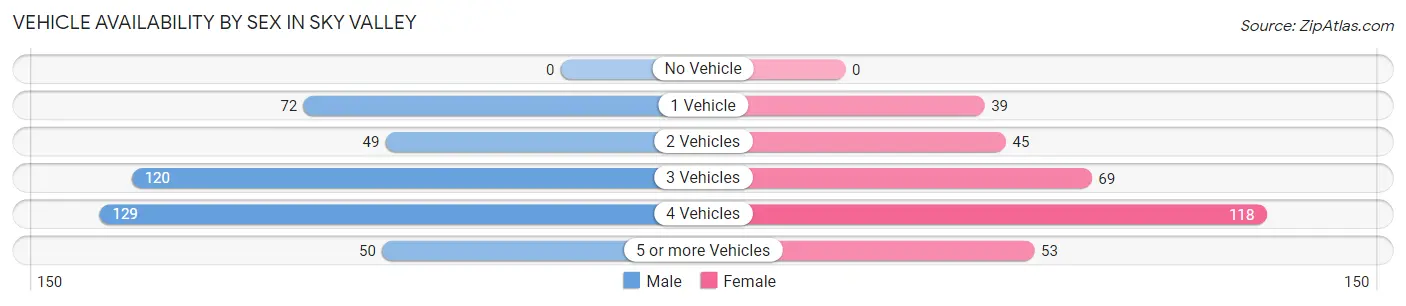
| Vehicles Available | Male | Female |
| No Vehicle | 0 (0.0%) | 0 (0.0%) |
| 1 Vehicle | 72 (17.1%) | 39 (12.0%) |
| 2 Vehicles | 49 (11.7%) | 45 (13.9%) |
| 3 Vehicles | 120 (28.6%) | 69 (21.3%) |
| 4 Vehicles | 129 (30.7%) | 118 (36.4%) |
| 5 or more Vehicles | 50 (11.9%) | 53 (16.4%) |
| Total | 420 (100.0%) | 324 (100.0%) |
Commute Time in Sky Valley
The most frequently occuring commute durations in Sky Valley are 30 to 34 minutes (273 commuters, 40.7%), 25 to 29 minutes (209 commuters, 31.1%), and 15 to 19 minutes (72 commuters, 10.7%).
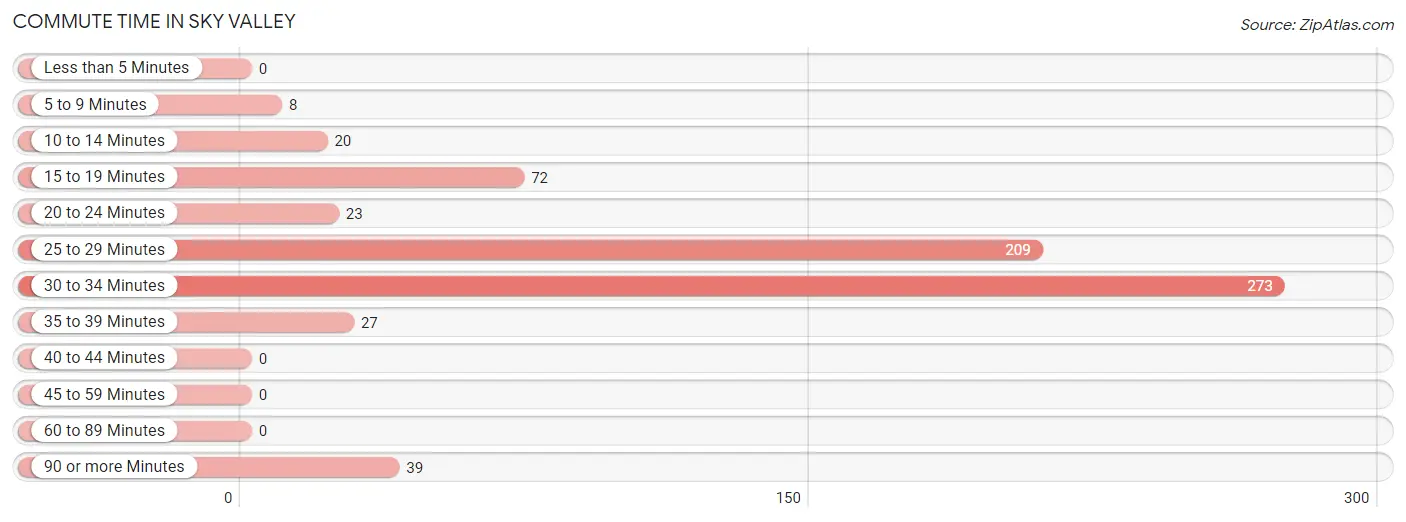
| Commute Time | # Commuters | % Commuters |
| Less than 5 Minutes | 0 | 0.0% |
| 5 to 9 Minutes | 8 | 1.2% |
| 10 to 14 Minutes | 20 | 3.0% |
| 15 to 19 Minutes | 72 | 10.7% |
| 20 to 24 Minutes | 23 | 3.4% |
| 25 to 29 Minutes | 209 | 31.1% |
| 30 to 34 Minutes | 273 | 40.7% |
| 35 to 39 Minutes | 27 | 4.0% |
| 40 to 44 Minutes | 0 | 0.0% |
| 45 to 59 Minutes | 0 | 0.0% |
| 60 to 89 Minutes | 0 | 0.0% |
| 90 or more Minutes | 39 | 5.8% |
Commute Time by Sex in Sky Valley
The most common commute times in Sky Valley are 30 to 34 minutes (120 commuters, 33.1%) for males and 30 to 34 minutes (153 commuters, 49.7%) for females.
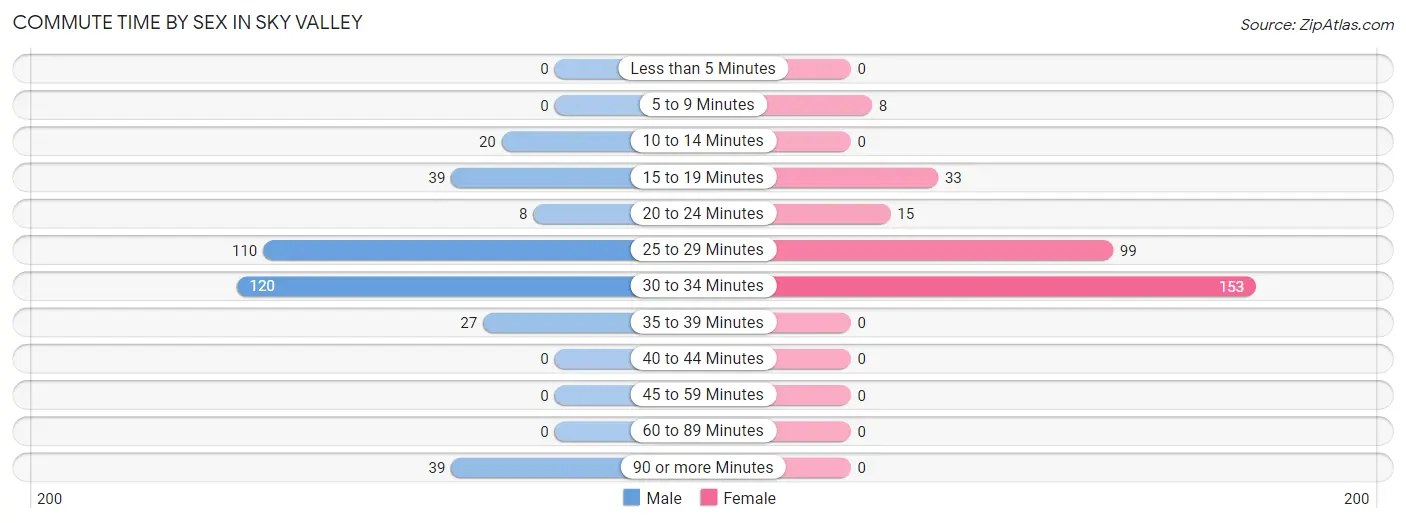
| Commute Time | Male | Female |
| Less than 5 Minutes | 0 (0.0%) | 0 (0.0%) |
| 5 to 9 Minutes | 0 (0.0%) | 8 (2.6%) |
| 10 to 14 Minutes | 20 (5.5%) | 0 (0.0%) |
| 15 to 19 Minutes | 39 (10.7%) | 33 (10.7%) |
| 20 to 24 Minutes | 8 (2.2%) | 15 (4.9%) |
| 25 to 29 Minutes | 110 (30.3%) | 99 (32.1%) |
| 30 to 34 Minutes | 120 (33.1%) | 153 (49.7%) |
| 35 to 39 Minutes | 27 (7.4%) | 0 (0.0%) |
| 40 to 44 Minutes | 0 (0.0%) | 0 (0.0%) |
| 45 to 59 Minutes | 0 (0.0%) | 0 (0.0%) |
| 60 to 89 Minutes | 0 (0.0%) | 0 (0.0%) |
| 90 or more Minutes | 39 (10.7%) | 0 (0.0%) |
Time of Departure to Work by Sex in Sky Valley
The most frequent times of departure to work in Sky Valley are 7:00 AM to 7:29 AM (92, 25.3%) for males and 6:30 AM to 6:59 AM (76, 24.7%) for females.
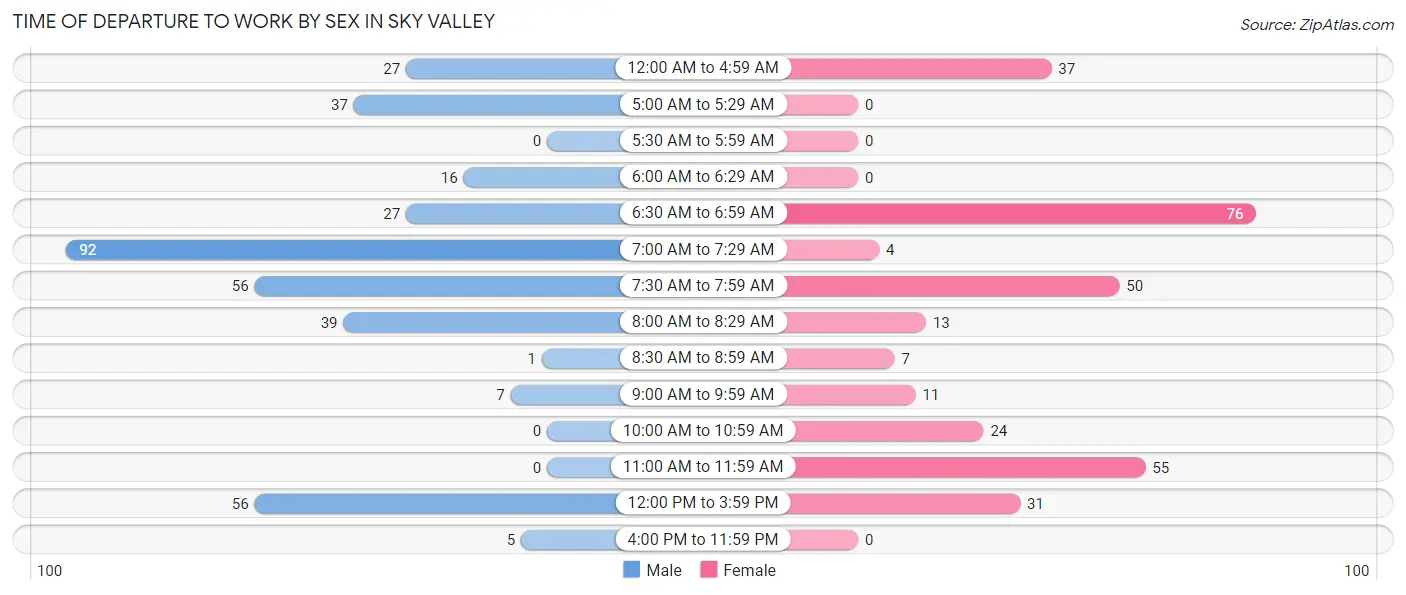
| Time of Departure | Male | Female |
| 12:00 AM to 4:59 AM | 27 (7.4%) | 37 (12.0%) |
| 5:00 AM to 5:29 AM | 37 (10.2%) | 0 (0.0%) |
| 5:30 AM to 5:59 AM | 0 (0.0%) | 0 (0.0%) |
| 6:00 AM to 6:29 AM | 16 (4.4%) | 0 (0.0%) |
| 6:30 AM to 6:59 AM | 27 (7.4%) | 76 (24.7%) |
| 7:00 AM to 7:29 AM | 92 (25.3%) | 4 (1.3%) |
| 7:30 AM to 7:59 AM | 56 (15.4%) | 50 (16.2%) |
| 8:00 AM to 8:29 AM | 39 (10.7%) | 13 (4.2%) |
| 8:30 AM to 8:59 AM | 1 (0.3%) | 7 (2.3%) |
| 9:00 AM to 9:59 AM | 7 (1.9%) | 11 (3.6%) |
| 10:00 AM to 10:59 AM | 0 (0.0%) | 24 (7.8%) |
| 11:00 AM to 11:59 AM | 0 (0.0%) | 55 (17.9%) |
| 12:00 PM to 3:59 PM | 56 (15.4%) | 31 (10.1%) |
| 4:00 PM to 11:59 PM | 5 (1.4%) | 0 (0.0%) |
| Total | 363 (100.0%) | 308 (100.0%) |
Housing Occupancy in Sky Valley
Occupancy by Ownership in Sky Valley
Of the total 994 dwellings in Sky Valley, owner-occupied units account for 848 (85.3%), while renter-occupied units make up 146 (14.7%).
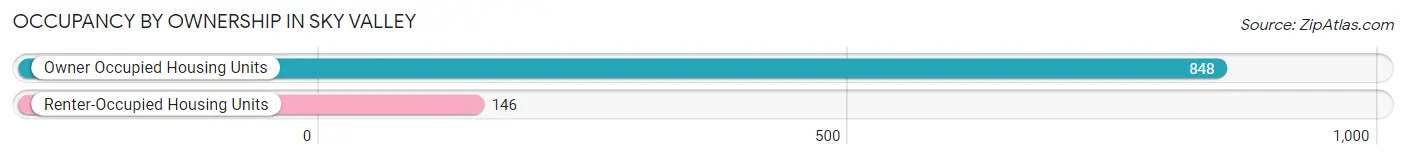
| Occupancy | # Housing Units | % Housing Units |
| Owner Occupied Housing Units | 848 | 85.3% |
| Renter-Occupied Housing Units | 146 | 14.7% |
| Total Occupied Housing Units | 994 | 100.0% |
Occupancy by Household Size in Sky Valley
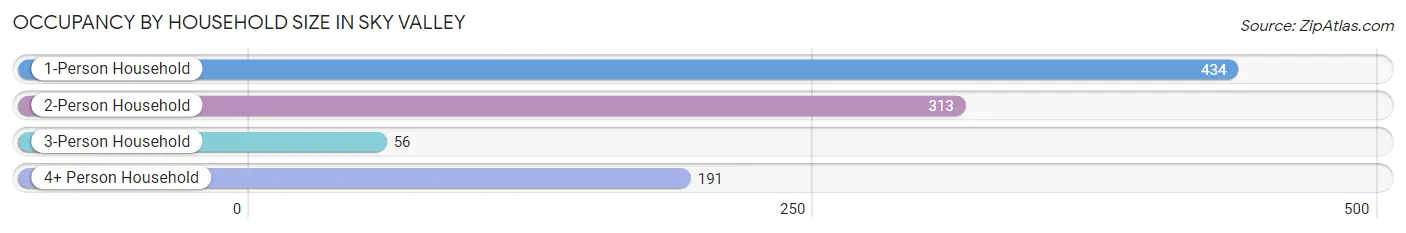
| Household Size | # Housing Units | % Housing Units |
| 1-Person Household | 434 | 43.7% |
| 2-Person Household | 313 | 31.5% |
| 3-Person Household | 56 | 5.6% |
| 4+ Person Household | 191 | 19.2% |
| Total Housing Units | 994 | 100.0% |
Occupancy by Ownership by Household Size in Sky Valley
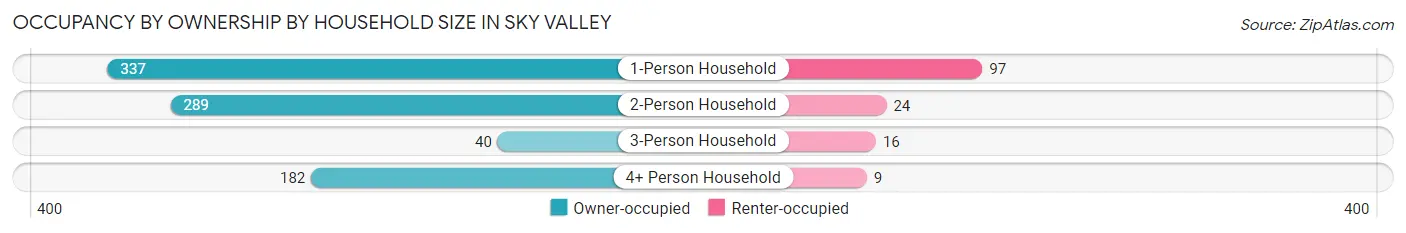
| Household Size | Owner-occupied | Renter-occupied |
| 1-Person Household | 337 (77.6%) | 97 (22.4%) |
| 2-Person Household | 289 (92.3%) | 24 (7.7%) |
| 3-Person Household | 40 (71.4%) | 16 (28.6%) |
| 4+ Person Household | 182 (95.3%) | 9 (4.7%) |
| Total Housing Units | 848 (85.3%) | 146 (14.7%) |
Occupancy by Educational Attainment in Sky Valley
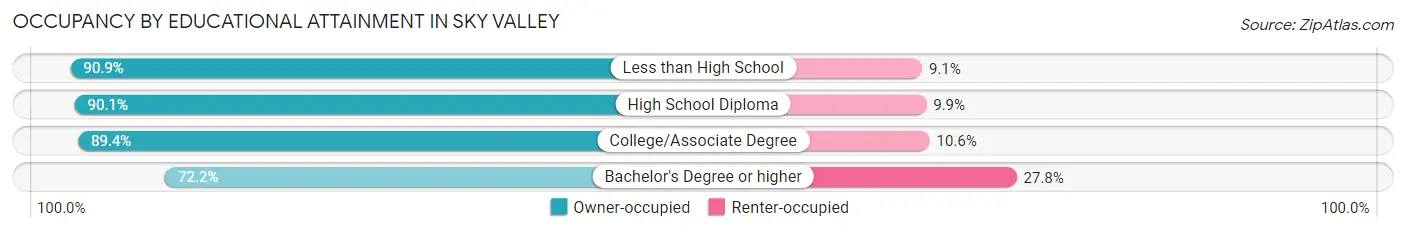
| Household Size | Owner-occupied | Renter-occupied |
| Less than High School | 80 (90.9%) | 8 (9.1%) |
| High School Diploma | 263 (90.1%) | 29 (9.9%) |
| College/Associate Degree | 321 (89.4%) | 38 (10.6%) |
| Bachelor's Degree or higher | 184 (72.2%) | 71 (27.8%) |
Occupancy by Age of Householder in Sky Valley
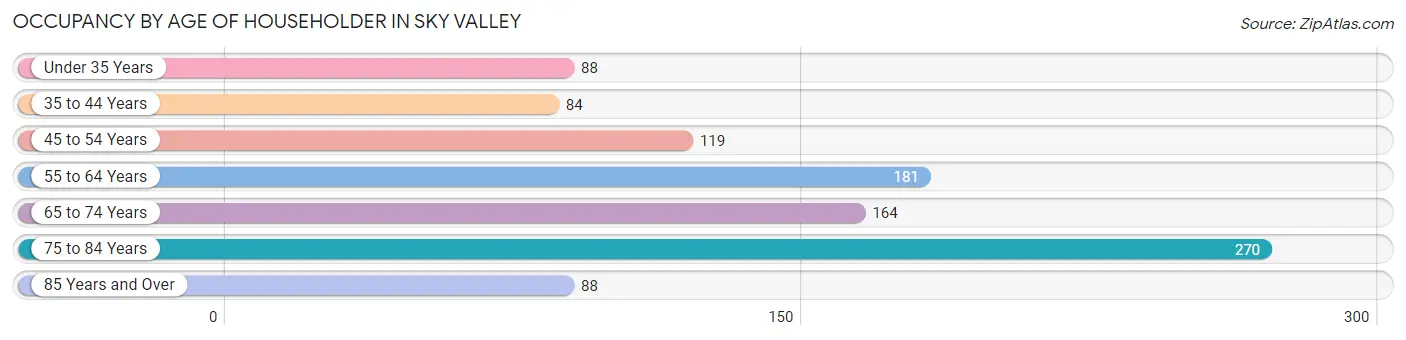
| Age Bracket | # Households | % Households |
| Under 35 Years | 88 | 8.8% |
| 35 to 44 Years | 84 | 8.5% |
| 45 to 54 Years | 119 | 12.0% |
| 55 to 64 Years | 181 | 18.2% |
| 65 to 74 Years | 164 | 16.5% |
| 75 to 84 Years | 270 | 27.2% |
| 85 Years and Over | 88 | 8.8% |
| Total | 994 | 100.0% |
Housing Finances in Sky Valley
Median Income by Occupancy in Sky Valley
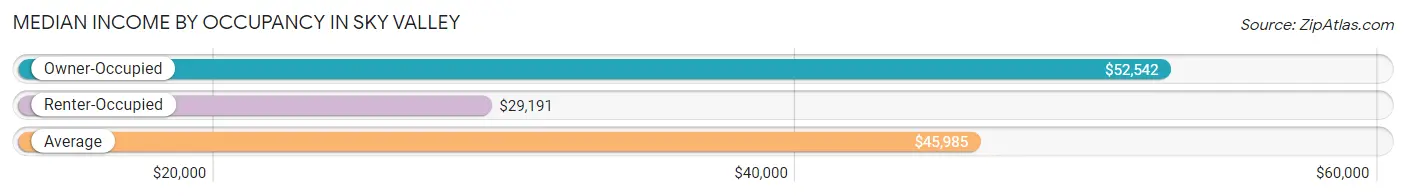
| Occupancy Type | # Households | Median Income |
| Owner-Occupied | 848 (85.3%) | $52,542 |
| Renter-Occupied | 146 (14.7%) | $29,191 |
| Average | 994 (100.0%) | $45,985 |
Occupancy by Householder Income Bracket in Sky Valley
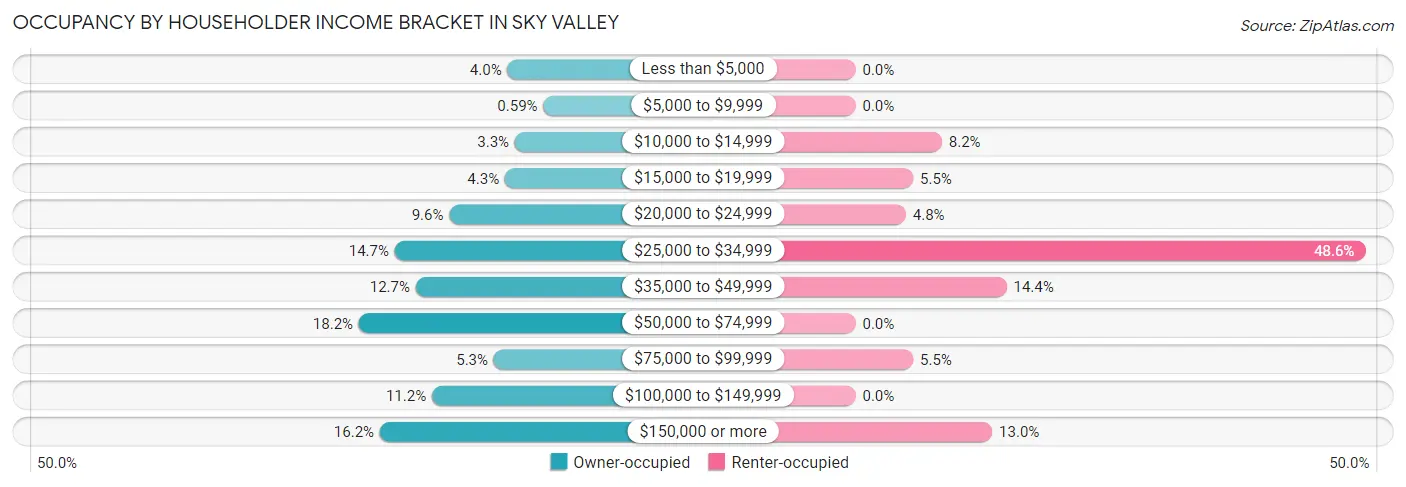
| Income Bracket | Owner-occupied | Renter-occupied |
| Less than $5,000 | 34 (4.0%) | 0 (0.0%) |
| $5,000 to $9,999 | 5 (0.6%) | 0 (0.0%) |
| $10,000 to $14,999 | 28 (3.3%) | 12 (8.2%) |
| $15,000 to $19,999 | 36 (4.3%) | 8 (5.5%) |
| $20,000 to $24,999 | 81 (9.6%) | 7 (4.8%) |
| $25,000 to $34,999 | 125 (14.7%) | 71 (48.6%) |
| $35,000 to $49,999 | 108 (12.7%) | 21 (14.4%) |
| $50,000 to $74,999 | 154 (18.2%) | 0 (0.0%) |
| $75,000 to $99,999 | 45 (5.3%) | 8 (5.5%) |
| $100,000 to $149,999 | 95 (11.2%) | 0 (0.0%) |
| $150,000 or more | 137 (16.2%) | 19 (13.0%) |
| Total | 848 (100.0%) | 146 (100.0%) |
Monthly Housing Cost Tiers in Sky Valley
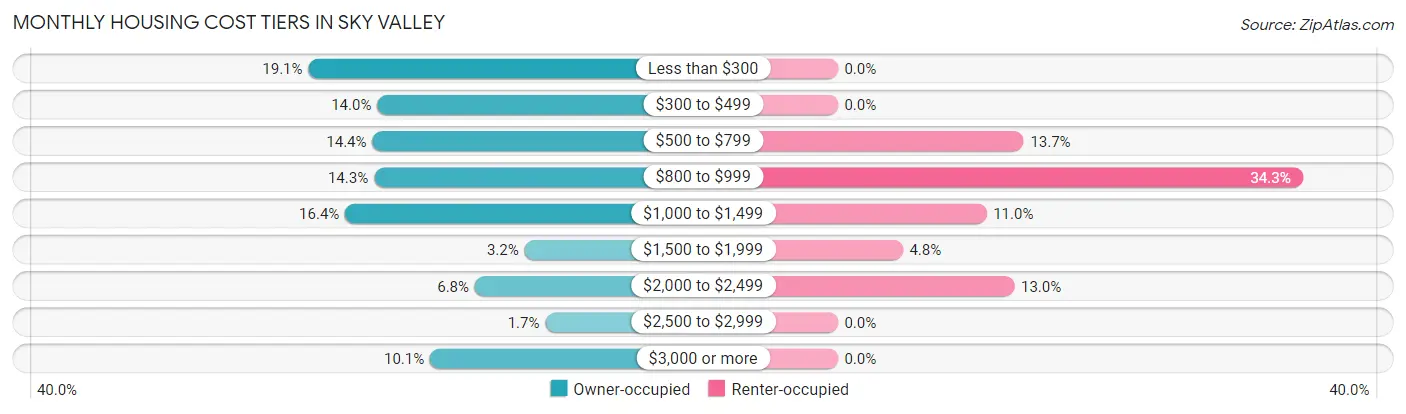
| Monthly Cost | Owner-occupied | Renter-occupied |
| Less than $300 | 162 (19.1%) | 0 (0.0%) |
| $300 to $499 | 119 (14.0%) | 0 (0.0%) |
| $500 to $799 | 122 (14.4%) | 20 (13.7%) |
| $800 to $999 | 121 (14.3%) | 50 (34.3%) |
| $1,000 to $1,499 | 139 (16.4%) | 16 (11.0%) |
| $1,500 to $1,999 | 27 (3.2%) | 7 (4.8%) |
| $2,000 to $2,499 | 58 (6.8%) | 19 (13.0%) |
| $2,500 to $2,999 | 14 (1.7%) | 0 (0.0%) |
| $3,000 or more | 86 (10.1%) | 0 (0.0%) |
| Total | 848 (100.0%) | 146 (100.0%) |
Physical Housing Characteristics in Sky Valley
Housing Structures in Sky Valley
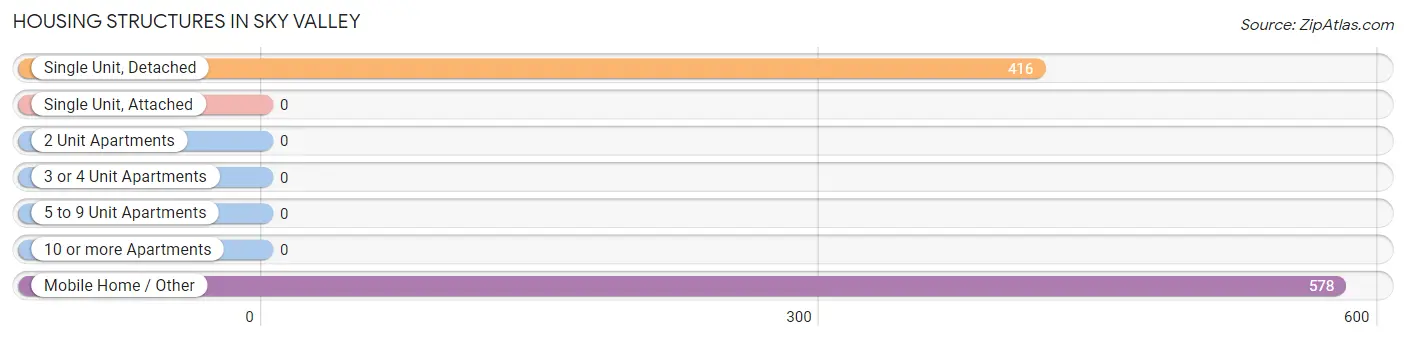
| Structure Type | # Housing Units | % Housing Units |
| Single Unit, Detached | 416 | 41.8% |
| Single Unit, Attached | 0 | 0.0% |
| 2 Unit Apartments | 0 | 0.0% |
| 3 or 4 Unit Apartments | 0 | 0.0% |
| 5 to 9 Unit Apartments | 0 | 0.0% |
| 10 or more Apartments | 0 | 0.0% |
| Mobile Home / Other | 578 | 58.2% |
| Total | 994 | 100.0% |
Housing Structures by Occupancy in Sky Valley
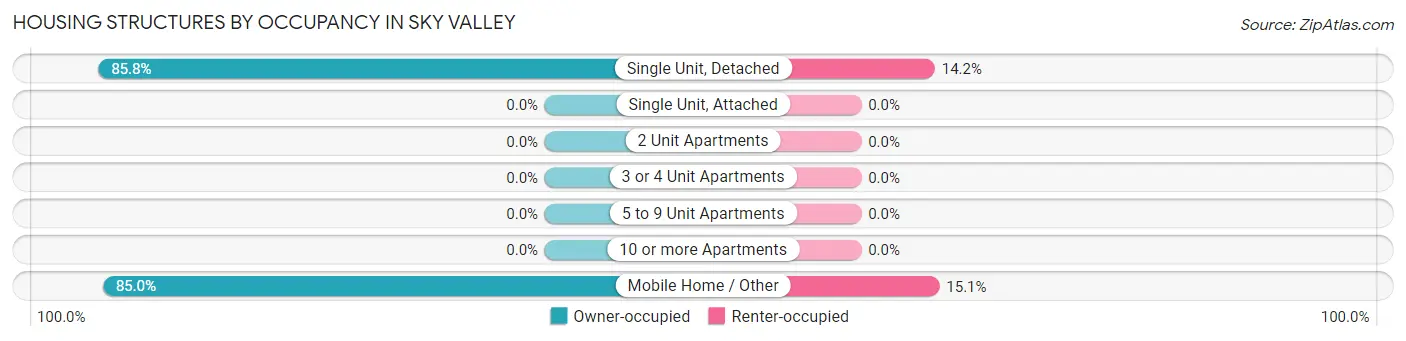
| Structure Type | Owner-occupied | Renter-occupied |
| Single Unit, Detached | 357 (85.8%) | 59 (14.2%) |
| Single Unit, Attached | 0 (0.0%) | 0 (0.0%) |
| 2 Unit Apartments | 0 (0.0%) | 0 (0.0%) |
| 3 or 4 Unit Apartments | 0 (0.0%) | 0 (0.0%) |
| 5 to 9 Unit Apartments | 0 (0.0%) | 0 (0.0%) |
| 10 or more Apartments | 0 (0.0%) | 0 (0.0%) |
| Mobile Home / Other | 491 (85.0%) | 87 (15.0%) |
| Total | 848 (85.3%) | 146 (14.7%) |
Housing Structures by Number of Rooms in Sky Valley
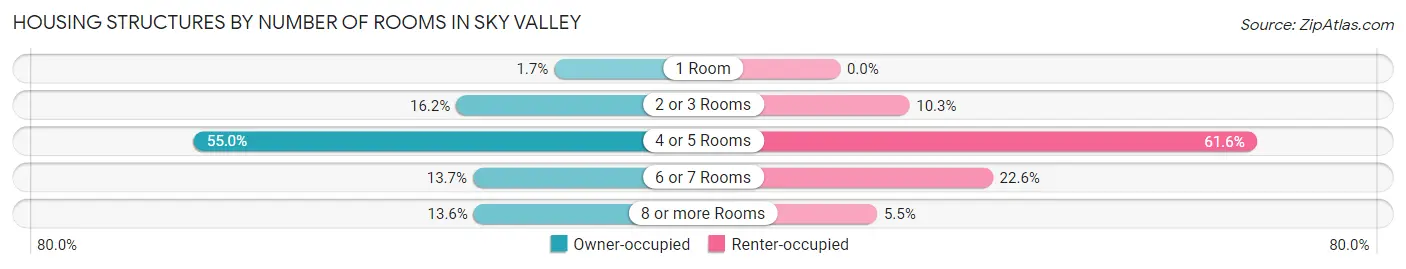
| Number of Rooms | Owner-occupied | Renter-occupied |
| 1 Room | 14 (1.7%) | 0 (0.0%) |
| 2 or 3 Rooms | 137 (16.2%) | 15 (10.3%) |
| 4 or 5 Rooms | 466 (54.9%) | 90 (61.6%) |
| 6 or 7 Rooms | 116 (13.7%) | 33 (22.6%) |
| 8 or more Rooms | 115 (13.6%) | 8 (5.5%) |
| Total | 848 (100.0%) | 146 (100.0%) |
Housing Structure by Heating Type in Sky Valley
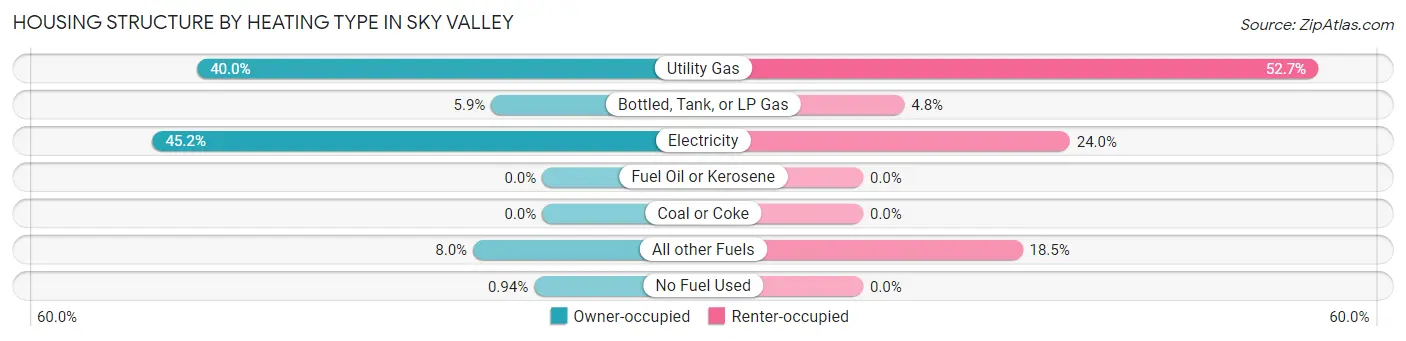
| Heating Type | Owner-occupied | Renter-occupied |
| Utility Gas | 339 (40.0%) | 77 (52.7%) |
| Bottled, Tank, or LP Gas | 50 (5.9%) | 7 (4.8%) |
| Electricity | 383 (45.2%) | 35 (24.0%) |
| Fuel Oil or Kerosene | 0 (0.0%) | 0 (0.0%) |
| Coal or Coke | 0 (0.0%) | 0 (0.0%) |
| All other Fuels | 68 (8.0%) | 27 (18.5%) |
| No Fuel Used | 8 (0.9%) | 0 (0.0%) |
| Total | 848 (100.0%) | 146 (100.0%) |
Household Vehicle Usage in Sky Valley
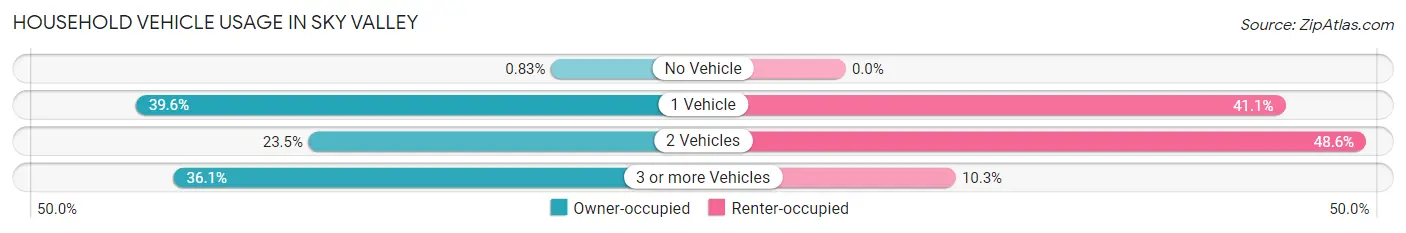
| Vehicles per Household | Owner-occupied | Renter-occupied |
| No Vehicle | 7 (0.8%) | 0 (0.0%) |
| 1 Vehicle | 336 (39.6%) | 60 (41.1%) |
| 2 Vehicles | 199 (23.5%) | 71 (48.6%) |
| 3 or more Vehicles | 306 (36.1%) | 15 (10.3%) |
| Total | 848 (100.0%) | 146 (100.0%) |
Real Estate & Mortgages in Sky Valley
Real Estate and Mortgage Overview in Sky Valley
| Characteristic | Without Mortgage | With Mortgage |
| Housing Units | 569 | 279 |
| Median Property Value | $78,900 | $354,600 |
| Median Household Income | $38,456 | $63 |
| Monthly Housing Costs | $513 | $80 |
| Real Estate Taxes | $406 | $17 |
Property Value by Mortgage Status in Sky Valley
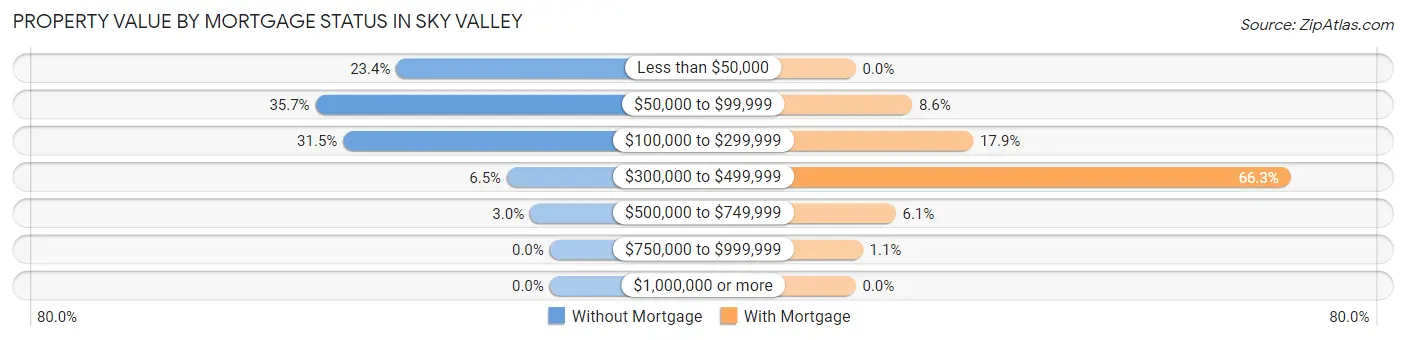
| Property Value | Without Mortgage | With Mortgage |
| Less than $50,000 | 133 (23.4%) | 0 (0.0%) |
| $50,000 to $99,999 | 203 (35.7%) | 24 (8.6%) |
| $100,000 to $299,999 | 179 (31.5%) | 50 (17.9%) |
| $300,000 to $499,999 | 37 (6.5%) | 185 (66.3%) |
| $500,000 to $749,999 | 17 (3.0%) | 17 (6.1%) |
| $750,000 to $999,999 | 0 (0.0%) | 3 (1.1%) |
| $1,000,000 or more | 0 (0.0%) | 0 (0.0%) |
| Total | 569 (100.0%) | 279 (100.0%) |
Household Income by Mortgage Status in Sky Valley
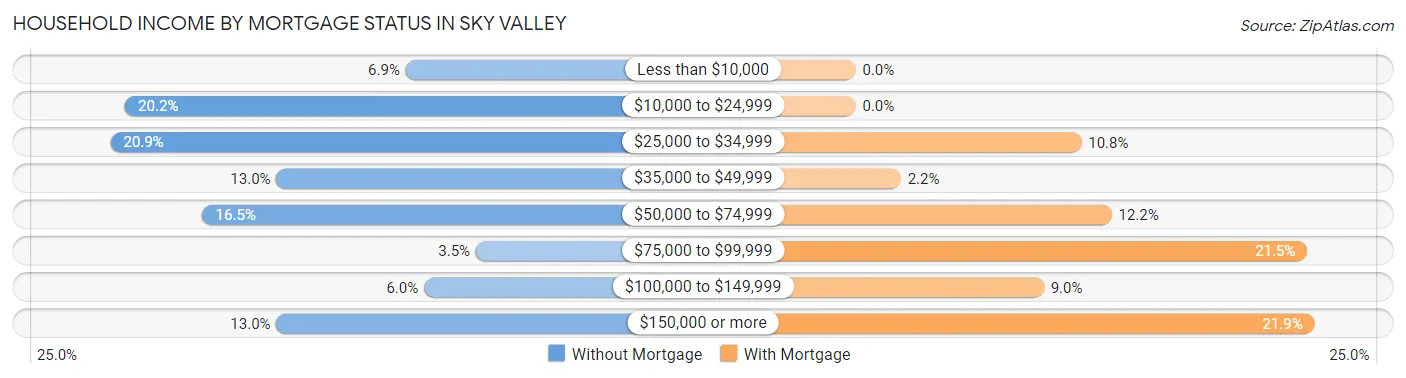
| Household Income | Without Mortgage | With Mortgage |
| Less than $10,000 | 39 (6.9%) | 0 (0.0%) |
| $10,000 to $24,999 | 115 (20.2%) | 0 (0.0%) |
| $25,000 to $34,999 | 119 (20.9%) | 30 (10.7%) |
| $35,000 to $49,999 | 74 (13.0%) | 6 (2.1%) |
| $50,000 to $74,999 | 94 (16.5%) | 34 (12.2%) |
| $75,000 to $99,999 | 20 (3.5%) | 60 (21.5%) |
| $100,000 to $149,999 | 34 (6.0%) | 25 (9.0%) |
| $150,000 or more | 74 (13.0%) | 61 (21.9%) |
| Total | 569 (100.0%) | 279 (100.0%) |
Property Value to Household Income Ratio in Sky Valley
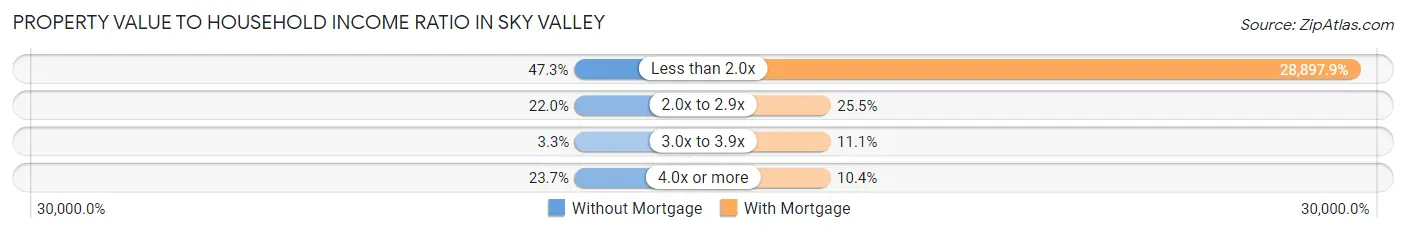
| Value-to-Income Ratio | Without Mortgage | With Mortgage |
| Less than 2.0x | 269 (47.3%) | 80,625 (28,897.8%) |
| 2.0x to 2.9x | 125 (22.0%) | 71 (25.5%) |
| 3.0x to 3.9x | 19 (3.3%) | 31 (11.1%) |
| 4.0x or more | 135 (23.7%) | 29 (10.4%) |
| Total | 569 (100.0%) | 279 (100.0%) |
Real Estate Taxes by Mortgage Status in Sky Valley
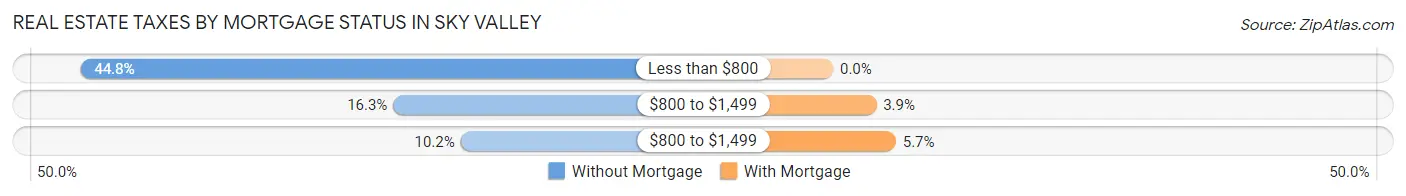
| Property Taxes | Without Mortgage | With Mortgage |
| Less than $800 | 255 (44.8%) | 0 (0.0%) |
| $800 to $1,499 | 93 (16.3%) | 11 (3.9%) |
| $800 to $1,499 | 58 (10.2%) | 16 (5.7%) |
| Total | 569 (100.0%) | 279 (100.0%) |
Health & Disability in Sky Valley
Health Insurance Coverage by Age in Sky Valley
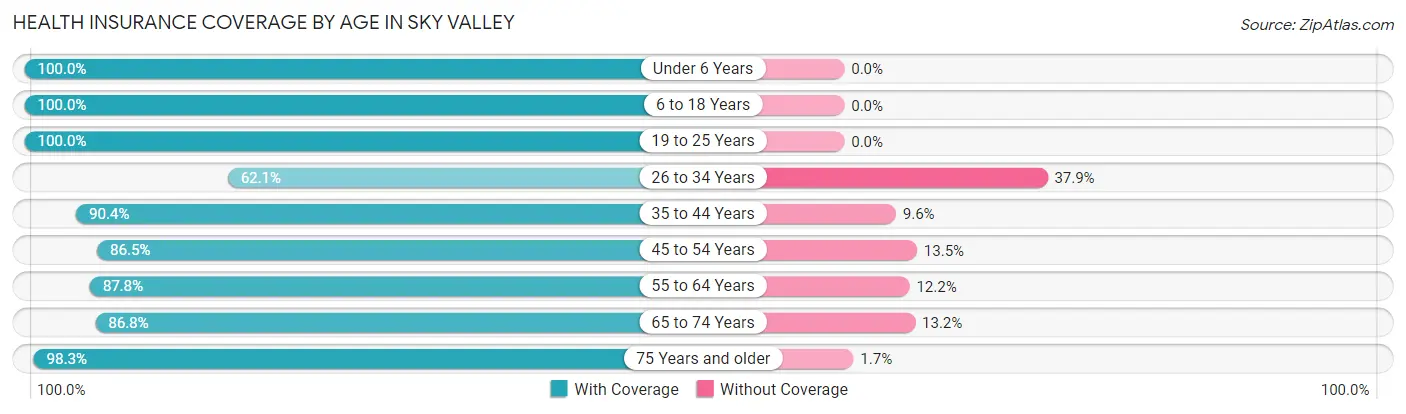
| Age Bracket | With Coverage | Without Coverage |
| Under 6 Years | 47 (100.0%) | 0 (0.0%) |
| 6 to 18 Years | 298 (100.0%) | 0 (0.0%) |
| 19 to 25 Years | 142 (100.0%) | 0 (0.0%) |
| 26 to 34 Years | 123 (62.1%) | 75 (37.9%) |
| 35 to 44 Years | 207 (90.4%) | 22 (9.6%) |
| 45 to 54 Years | 249 (86.5%) | 39 (13.5%) |
| 55 to 64 Years | 289 (87.8%) | 40 (12.2%) |
| 65 to 74 Years | 263 (86.8%) | 40 (13.2%) |
| 75 Years and older | 462 (98.3%) | 8 (1.7%) |
| Total | 2,080 (90.3%) | 224 (9.7%) |
Health Insurance Coverage by Citizenship Status in Sky Valley
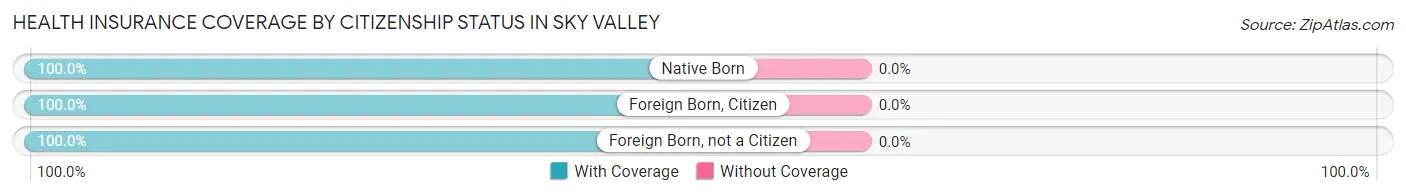
| Citizenship Status | With Coverage | Without Coverage |
| Native Born | 47 (100.0%) | 0 (0.0%) |
| Foreign Born, Citizen | 298 (100.0%) | 0 (0.0%) |
| Foreign Born, not a Citizen | 142 (100.0%) | 0 (0.0%) |
Health Insurance Coverage by Household Income in Sky Valley
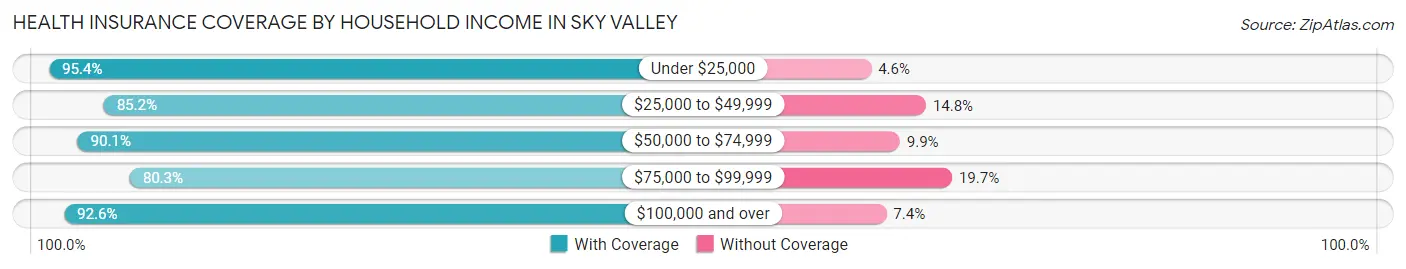
| Household Income | With Coverage | Without Coverage |
| Under $25,000 | 292 (95.4%) | 14 (4.6%) |
| $25,000 to $49,999 | 402 (85.2%) | 70 (14.8%) |
| $50,000 to $74,999 | 462 (90.1%) | 51 (9.9%) |
| $75,000 to $99,999 | 110 (80.3%) | 27 (19.7%) |
| $100,000 and over | 774 (92.6%) | 62 (7.4%) |
Public vs Private Health Insurance Coverage by Age in Sky Valley
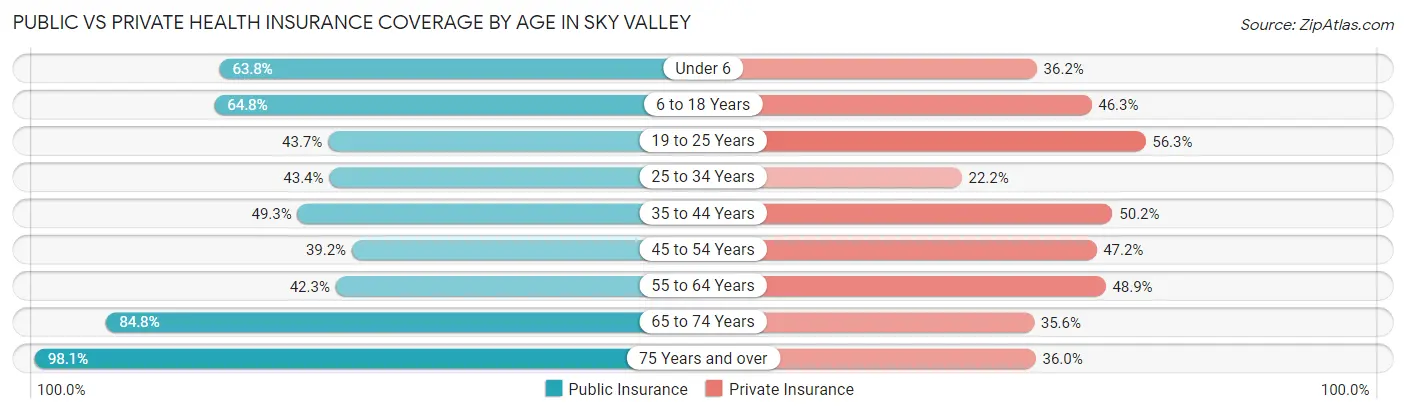
| Age Bracket | Public Insurance | Private Insurance |
| Under 6 | 30 (63.8%) | 17 (36.2%) |
| 6 to 18 Years | 193 (64.8%) | 138 (46.3%) |
| 19 to 25 Years | 62 (43.7%) | 80 (56.3%) |
| 25 to 34 Years | 86 (43.4%) | 44 (22.2%) |
| 35 to 44 Years | 113 (49.3%) | 115 (50.2%) |
| 45 to 54 Years | 113 (39.2%) | 136 (47.2%) |
| 55 to 64 Years | 139 (42.2%) | 161 (48.9%) |
| 65 to 74 Years | 257 (84.8%) | 108 (35.6%) |
| 75 Years and over | 461 (98.1%) | 169 (36.0%) |
| Total | 1,454 (63.1%) | 968 (42.0%) |
Disability Status by Sex by Age in Sky Valley
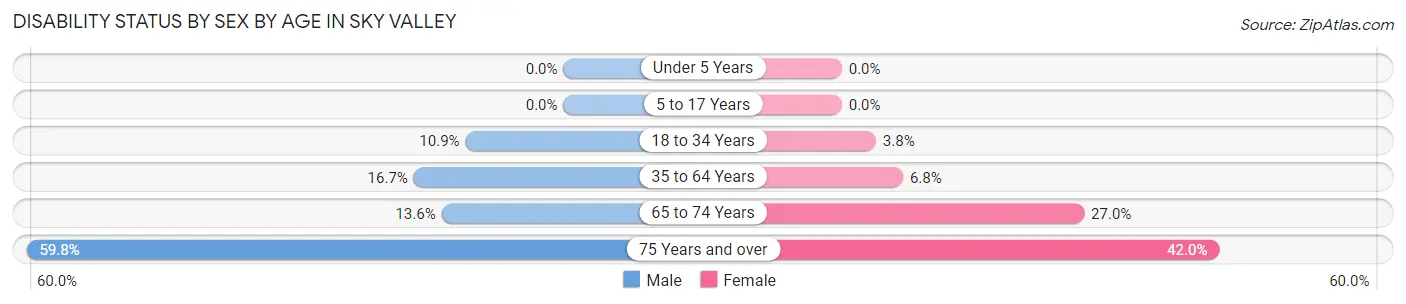
| Age Bracket | Male | Female |
| Under 5 Years | 0 (0.0%) | 0 (0.0%) |
| 5 to 17 Years | 0 (0.0%) | 0 (0.0%) |
| 18 to 34 Years | 18 (10.9%) | 7 (3.8%) |
| 35 to 64 Years | 75 (16.7%) | 27 (6.8%) |
| 65 to 74 Years | 19 (13.6%) | 44 (27.0%) |
| 75 Years and over | 116 (59.8%) | 116 (42.0%) |
Disability Class by Sex by Age in Sky Valley
Disability Class: Hearing Difficulty
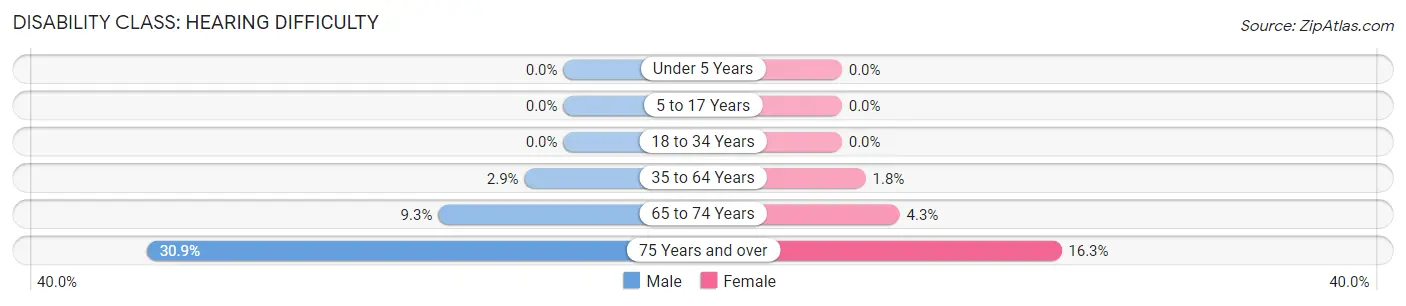
| Age Bracket | Male | Female |
| Under 5 Years | 0 (0.0%) | 0 (0.0%) |
| 5 to 17 Years | 0 (0.0%) | 0 (0.0%) |
| 18 to 34 Years | 0 (0.0%) | 0 (0.0%) |
| 35 to 64 Years | 13 (2.9%) | 7 (1.8%) |
| 65 to 74 Years | 13 (9.3%) | 7 (4.3%) |
| 75 Years and over | 60 (30.9%) | 45 (16.3%) |
Disability Class: Vision Difficulty
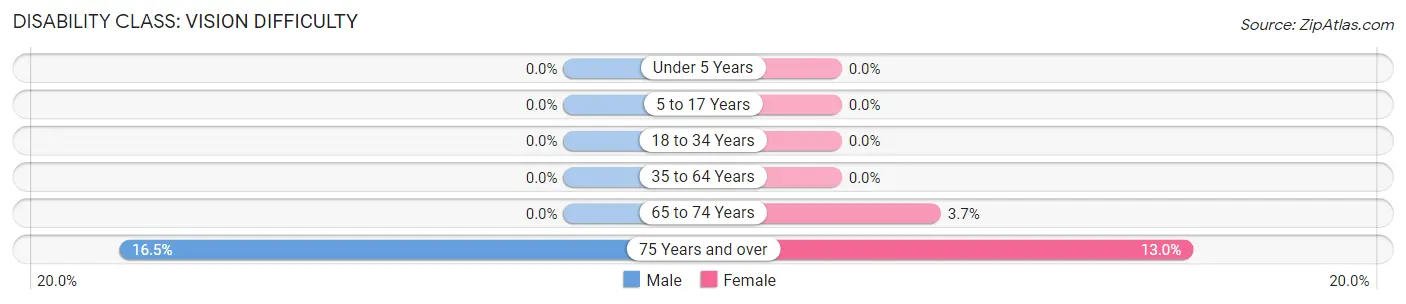
| Age Bracket | Male | Female |
| Under 5 Years | 0 (0.0%) | 0 (0.0%) |
| 5 to 17 Years | 0 (0.0%) | 0 (0.0%) |
| 18 to 34 Years | 0 (0.0%) | 0 (0.0%) |
| 35 to 64 Years | 0 (0.0%) | 0 (0.0%) |
| 65 to 74 Years | 0 (0.0%) | 6 (3.7%) |
| 75 Years and over | 32 (16.5%) | 36 (13.0%) |
Disability Class: Cognitive Difficulty
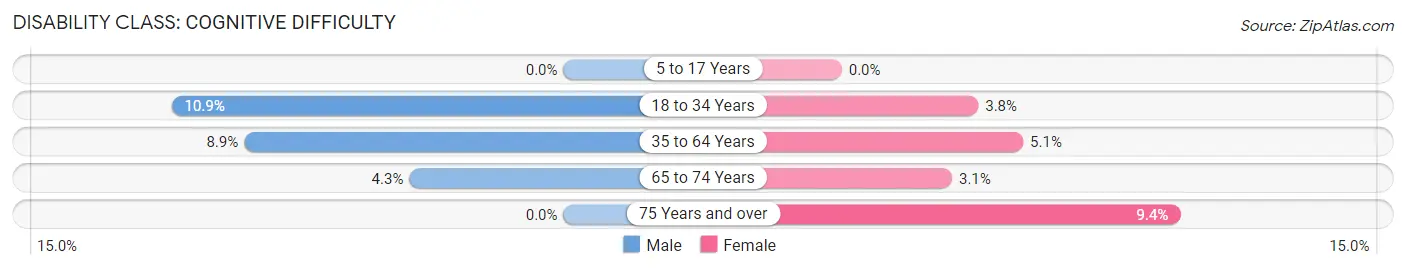
| Age Bracket | Male | Female |
| 5 to 17 Years | 0 (0.0%) | 0 (0.0%) |
| 18 to 34 Years | 18 (10.9%) | 7 (3.8%) |
| 35 to 64 Years | 40 (8.9%) | 20 (5.1%) |
| 65 to 74 Years | 6 (4.3%) | 5 (3.1%) |
| 75 Years and over | 0 (0.0%) | 26 (9.4%) |
Disability Class: Ambulatory Difficulty
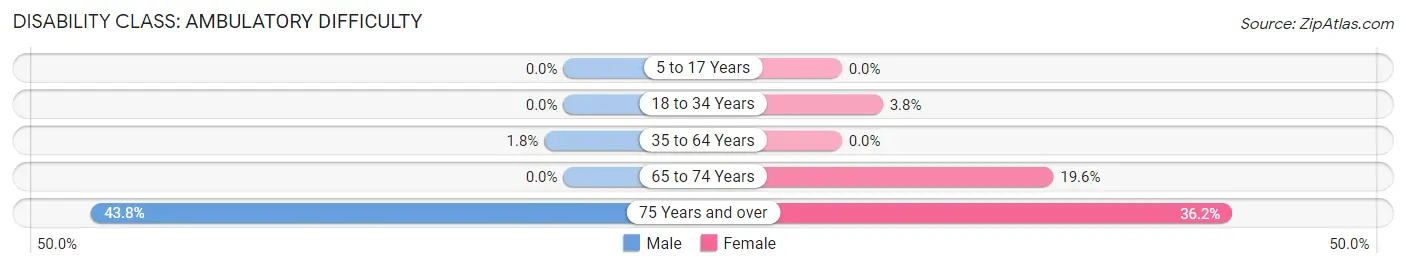
| Age Bracket | Male | Female |
| 5 to 17 Years | 0 (0.0%) | 0 (0.0%) |
| 18 to 34 Years | 0 (0.0%) | 7 (3.8%) |
| 35 to 64 Years | 8 (1.8%) | 0 (0.0%) |
| 65 to 74 Years | 0 (0.0%) | 32 (19.6%) |
| 75 Years and over | 85 (43.8%) | 100 (36.2%) |
Disability Class: Self-Care Difficulty
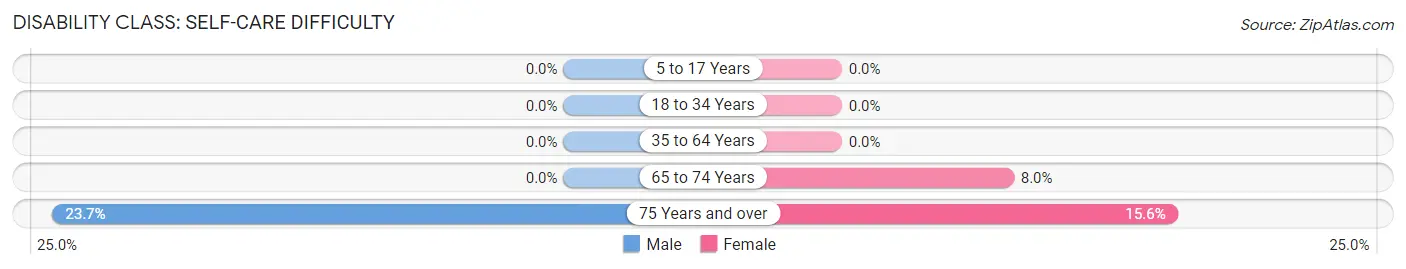
| Age Bracket | Male | Female |
| 5 to 17 Years | 0 (0.0%) | 0 (0.0%) |
| 18 to 34 Years | 0 (0.0%) | 0 (0.0%) |
| 35 to 64 Years | 0 (0.0%) | 0 (0.0%) |
| 65 to 74 Years | 0 (0.0%) | 13 (8.0%) |
| 75 Years and over | 46 (23.7%) | 43 (15.6%) |
Technology Access in Sky Valley
Computing Device Access in Sky Valley
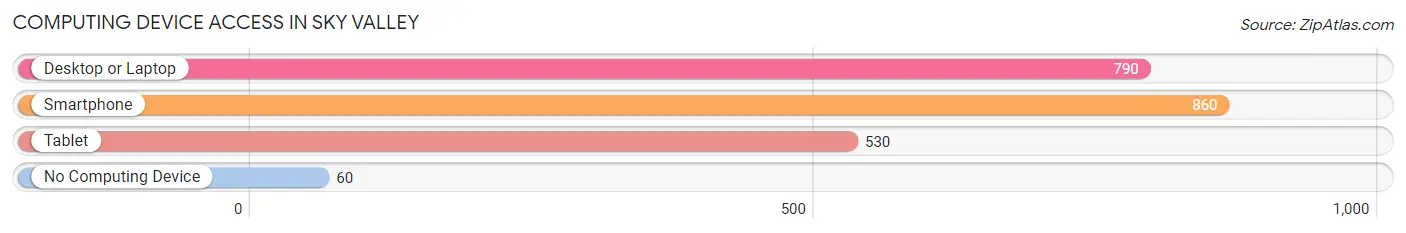
| Device Type | # Households | % Households |
| Desktop or Laptop | 790 | 79.5% |
| Smartphone | 860 | 86.5% |
| Tablet | 530 | 53.3% |
| No Computing Device | 60 | 6.0% |
| Total | 994 | 100.0% |
Internet Access in Sky Valley
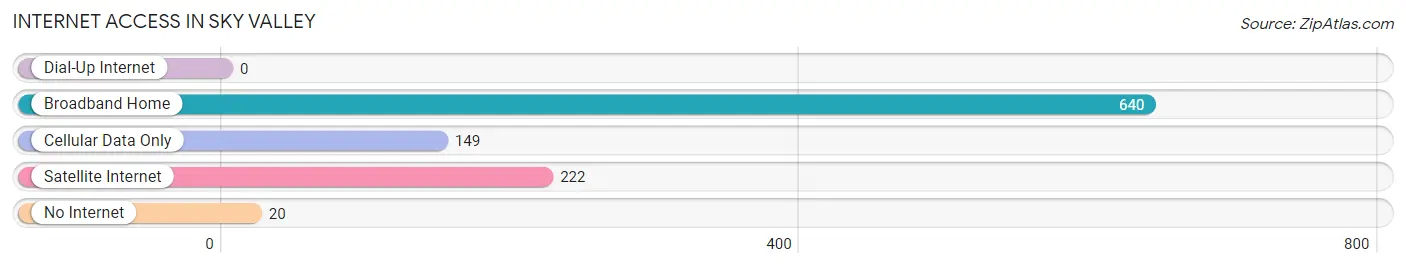
| Internet Type | # Households | % Households |
| Dial-Up Internet | 0 | 0.0% |
| Broadband Home | 640 | 64.4% |
| Cellular Data Only | 149 | 15.0% |
| Satellite Internet | 222 | 22.3% |
| No Internet | 20 | 2.0% |
| Total | 994 | 100.0% |
Sky Valley Summary
History
Sky Valley is a small unincorporated community located in Riverside County, California. It is situated in the Coachella Valley, about 10 miles east of Palm Springs. The area was originally inhabited by the Cahuilla Indians, who were the first to settle in the area. The Cahuilla Indians were known for their basket weaving and pottery making.
The first non-native settlers in the area were miners who arrived in the late 1800s. They were looking for gold and silver, but found little success. The area was later used for cattle ranching and farming. In the early 1900s, the area was known as Sky Valley Ranch.
In the 1950s, the area began to develop as a resort destination. The first resort was the Sky Valley Resort, which opened in 1954. The resort was a popular destination for celebrities and other wealthy visitors.
In the 1960s, the area began to attract more permanent residents. The population grew steadily throughout the 1970s and 1980s. In the 1990s, the area began to attract more retirees and second-home owners.
Geography
Sky Valley is located in the Coachella Valley, about 10 miles east of Palm Springs. The area is surrounded by the Santa Rosa Mountains to the north and the San Jacinto Mountains to the south. The area is known for its desert climate, with hot summers and mild winters.
The area is mostly flat, with some hills and canyons. The terrain is mostly desert scrub, with some areas of grassland. The area is home to a variety of wildlife, including coyotes, bobcats, and roadrunners.
Economy
The economy of Sky Valley is largely based on tourism. The area is home to several resorts, including the Sky Valley Resort, which opened in 1954. The resort is a popular destination for celebrities and other wealthy visitors.
The area is also home to several golf courses, including the Sky Valley Country Club. The area is also home to several wineries, including the Sky Valley Winery.
The area is also home to several small businesses, including restaurants, shops, and art galleries. The area is also home to several small farms, which produce a variety of fruits and vegetables.
Demographics
As of the 2010 census, the population of Sky Valley was 1,845. The population is mostly white (83.3%), with smaller percentages of Hispanic (7.3%), African American (3.2%), and Asian (2.2%) residents. The median household income is $45,000, and the median age is 44.
Sky Valley is a small, close-knit community. The area is known for its friendly atmosphere and welcoming attitude towards visitors. The area is also known for its outdoor activities, including hiking, biking, and golfing.
Common Questions
What is Per Capita Income in Sky Valley?
Per Capita income in Sky Valley is $31,326.
What is the Median Family Income in Sky Valley?
Median Family Income in Sky Valley is $74,821.
What is the Median Household income in Sky Valley?
Median Household Income in Sky Valley is $45,985.
What is Income or Wage Gap in Sky Valley?
Income or Wage Gap in Sky Valley is 22.6%.
Women in Sky Valley earn 77.4 cents for every dollar earned by a man.
What is Inequality or Gini Index in Sky Valley?
Inequality or Gini Index in Sky Valley is 0.48.
What is the Total Population of Sky Valley?
Total Population of Sky Valley is 2,307.
What is the Total Male Population of Sky Valley?
Total Male Population of Sky Valley is 1,104.
What is the Total Female Population of Sky Valley?
Total Female Population of Sky Valley is 1,203.
What is the Ratio of Males per 100 Females in Sky Valley?
There are 91.77 Males per 100 Females in Sky Valley.
What is the Ratio of Females per 100 Males in Sky Valley?
There are 108.97 Females per 100 Males in Sky Valley.
What is the Median Population Age in Sky Valley?
Median Population Age in Sky Valley is 52.7 Years.
What is the Average Family Size in Sky Valley
Average Family Size in Sky Valley is 3.1 People.
What is the Average Household Size in Sky Valley
Average Household Size in Sky Valley is 2.3 People.
How Large is the Labor Force in Sky Valley?
There are 875 People in the Labor Forcein in Sky Valley.
What is the Percentage of People in the Labor Force in Sky Valley?
43.3% of People are in the Labor Force in Sky Valley.
What is the Unemployment Rate in Sky Valley?
Unemployment Rate in Sky Valley is 10.6%.