Cities with the Most Immigrants from Ethiopia in California
RELATED REPORTS & OPTIONS
Ethiopia
California
Compare Cities
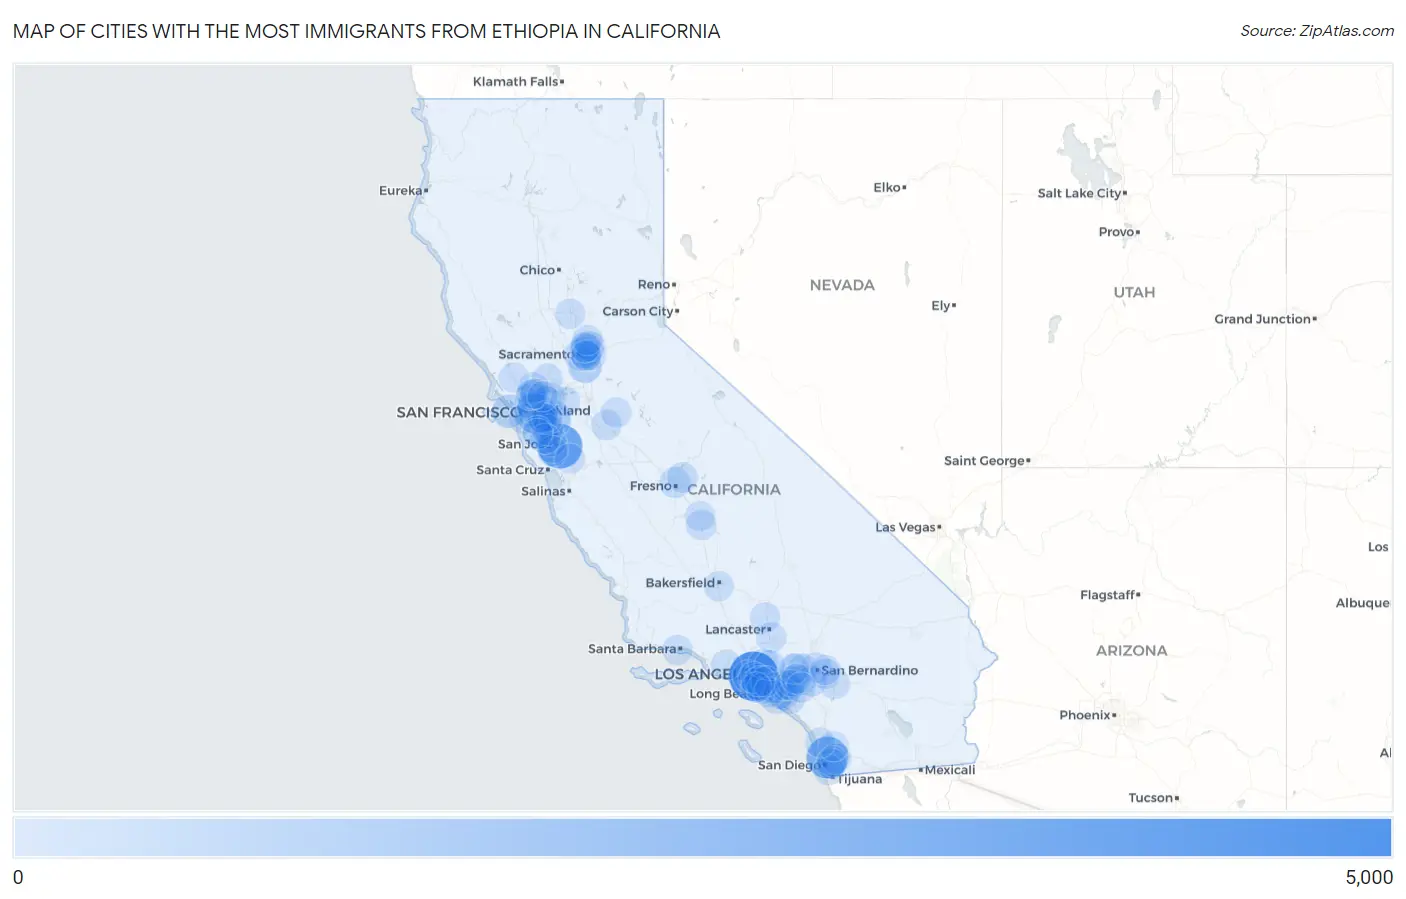
Map of Cities with the Most Immigrants from Ethiopia in California
0
5,000
Cities with the Most Immigrants from Ethiopia in California
| City | Ethiopia | vs State | vs National | |
| 1. | Los Angeles | 4,092 | 24,635(16.61%)#1 | 275,476(1.49%)#10 |
| 2. | San Jose | 3,031 | 24,635(12.30%)#2 | 275,476(1.10%)#13 |
| 3. | San Diego | 2,446 | 24,635(9.93%)#3 | 275,476(0.89%)#21 |
| 4. | Oakland | 2,061 | 24,635(8.37%)#4 | 275,476(0.75%)#26 |
| 5. | Elk Grove | 702 | 24,635(2.85%)#5 | 275,476(0.25%)#69 |
| 6. | San Francisco | 678 | 24,635(2.75%)#6 | 275,476(0.25%)#73 |
| 7. | Inglewood | 520 | 24,635(2.11%)#7 | 275,476(0.19%)#97 |
| 8. | Santa Monica | 431 | 24,635(1.75%)#8 | 275,476(0.16%)#114 |
| 9. | Hawthorne | 410 | 24,635(1.66%)#9 | 275,476(0.15%)#119 |
| 10. | Anaheim | 338 | 24,635(1.37%)#10 | 275,476(0.12%)#140 |
| 11. | Sacramento | 331 | 24,635(1.34%)#11 | 275,476(0.12%)#144 |
| 12. | Carmichael | 286 | 24,635(1.16%)#12 | 275,476(0.10%)#159 |
| 13. | Arden Arcade | 277 | 24,635(1.12%)#13 | 275,476(0.10%)#163 |
| 14. | Hayward | 270 | 24,635(1.10%)#14 | 275,476(0.10%)#170 |
| 15. | Fremont | 237 | 24,635(0.96%)#15 | 275,476(0.09%)#184 |
| 16. | Fresno | 232 | 24,635(0.94%)#16 | 275,476(0.08%)#187 |
| 17. | Richmond | 208 | 24,635(0.84%)#17 | 275,476(0.08%)#205 |
| 18. | Dublin | 185 | 24,635(0.75%)#18 | 275,476(0.07%)#226 |
| 19. | Upland | 181 | 24,635(0.73%)#19 | 275,476(0.07%)#234 |
| 20. | Campbell | 168 | 24,635(0.68%)#20 | 275,476(0.06%)#245 |
| 21. | Alameda | 166 | 24,635(0.67%)#21 | 275,476(0.06%)#251 |
| 22. | Huntington Beach | 161 | 24,635(0.65%)#22 | 275,476(0.06%)#257 |
| 23. | Culver City | 160 | 24,635(0.65%)#23 | 275,476(0.06%)#259 |
| 24. | Berkeley | 156 | 24,635(0.63%)#24 | 275,476(0.06%)#263 |
| 25. | Clovis | 156 | 24,635(0.63%)#25 | 275,476(0.06%)#264 |
| 26. | Buena Park | 148 | 24,635(0.60%)#26 | 275,476(0.05%)#278 |
| 27. | Modesto | 143 | 24,635(0.58%)#27 | 275,476(0.05%)#286 |
| 28. | Riverside | 137 | 24,635(0.56%)#28 | 275,476(0.05%)#294 |
| 29. | Santa Ana | 128 | 24,635(0.52%)#29 | 275,476(0.05%)#308 |
| 30. | Lakewood | 124 | 24,635(0.50%)#30 | 275,476(0.05%)#316 |
| 31. | El Cajon | 123 | 24,635(0.50%)#31 | 275,476(0.04%)#317 |
| 32. | Garden Grove | 121 | 24,635(0.49%)#32 | 275,476(0.04%)#320 |
| 33. | National City | 120 | 24,635(0.49%)#33 | 275,476(0.04%)#324 |
| 34. | Concord | 117 | 24,635(0.47%)#34 | 275,476(0.04%)#333 |
| 35. | Fullerton | 116 | 24,635(0.47%)#35 | 275,476(0.04%)#336 |
| 36. | Carson | 114 | 24,635(0.46%)#36 | 275,476(0.04%)#342 |
| 37. | Irvine | 112 | 24,635(0.45%)#37 | 275,476(0.04%)#346 |
| 38. | Fairfield | 112 | 24,635(0.45%)#38 | 275,476(0.04%)#348 |
| 39. | Foothill Farms | 111 | 24,635(0.45%)#39 | 275,476(0.04%)#351 |
| 40. | Contra Costa Centre | 110 | 24,635(0.45%)#40 | 275,476(0.04%)#356 |
| 41. | Placentia | 108 | 24,635(0.44%)#41 | 275,476(0.04%)#363 |
| 42. | Emeryville | 103 | 24,635(0.42%)#42 | 275,476(0.04%)#373 |
| 43. | San Leandro | 101 | 24,635(0.41%)#43 | 275,476(0.04%)#375 |
| 44. | Santa Barbara | 101 | 24,635(0.41%)#44 | 275,476(0.04%)#376 |
| 45. | Pleasanton | 100 | 24,635(0.41%)#45 | 275,476(0.04%)#380 |
| 46. | Chino Hills | 99 | 24,635(0.40%)#46 | 275,476(0.04%)#383 |
| 47. | Tulare | 98 | 24,635(0.40%)#47 | 275,476(0.04%)#388 |
| 48. | Santa Clara | 92 | 24,635(0.37%)#48 | 275,476(0.03%)#408 |
| 49. | Eastvale | 90 | 24,635(0.37%)#49 | 275,476(0.03%)#414 |
| 50. | Vallejo | 83 | 24,635(0.34%)#50 | 275,476(0.03%)#425 |
| 51. | San Bernardino | 81 | 24,635(0.33%)#51 | 275,476(0.03%)#433 |
| 52. | Rancho Cordova | 81 | 24,635(0.33%)#52 | 275,476(0.03%)#434 |
| 53. | Palmdale | 80 | 24,635(0.32%)#53 | 275,476(0.03%)#437 |
| 54. | La Mesa | 80 | 24,635(0.32%)#54 | 275,476(0.03%)#438 |
| 55. | Visalia | 78 | 24,635(0.32%)#55 | 275,476(0.03%)#444 |
| 56. | Glendale | 76 | 24,635(0.31%)#56 | 275,476(0.03%)#450 |
| 57. | Oakdale | 76 | 24,635(0.31%)#57 | 275,476(0.03%)#454 |
| 58. | Rancho Cucamonga | 72 | 24,635(0.29%)#58 | 275,476(0.03%)#468 |
| 59. | Newark | 70 | 24,635(0.28%)#59 | 275,476(0.03%)#480 |
| 60. | Cherryland | 70 | 24,635(0.28%)#60 | 275,476(0.03%)#482 |
| 61. | Pasadena | 69 | 24,635(0.28%)#61 | 275,476(0.03%)#484 |
| 62. | South Gate | 64 | 24,635(0.26%)#62 | 275,476(0.02%)#503 |
| 63. | Citrus Heights | 63 | 24,635(0.26%)#63 | 275,476(0.02%)#508 |
| 64. | Daly City | 59 | 24,635(0.24%)#64 | 275,476(0.02%)#529 |
| 65. | Yuba City | 59 | 24,635(0.24%)#65 | 275,476(0.02%)#530 |
| 66. | Castro Valley | 59 | 24,635(0.24%)#66 | 275,476(0.02%)#531 |
| 67. | Los Gatos | 58 | 24,635(0.24%)#67 | 275,476(0.02%)#540 |
| 68. | Long Beach | 57 | 24,635(0.23%)#68 | 275,476(0.02%)#544 |
| 69. | Lemon Grove | 57 | 24,635(0.23%)#69 | 275,476(0.02%)#548 |
| 70. | Redlands | 56 | 24,635(0.23%)#70 | 275,476(0.02%)#554 |
| 71. | Eastern Goleta Valley | 56 | 24,635(0.23%)#71 | 275,476(0.02%)#559 |
| 72. | Morgan Hill | 54 | 24,635(0.22%)#72 | 275,476(0.02%)#567 |
| 73. | Rosemont | 54 | 24,635(0.22%)#73 | 275,476(0.02%)#568 |
| 74. | Beaumont | 53 | 24,635(0.22%)#74 | 275,476(0.02%)#572 |
| 75. | Brentwood | 52 | 24,635(0.21%)#75 | 275,476(0.02%)#576 |
| 76. | Westmont | 52 | 24,635(0.21%)#76 | 275,476(0.02%)#577 |
| 77. | La Riviera | 52 | 24,635(0.21%)#77 | 275,476(0.02%)#580 |
| 78. | Fairview | 52 | 24,635(0.21%)#78 | 275,476(0.02%)#582 |
| 79. | Roseville | 51 | 24,635(0.21%)#79 | 275,476(0.02%)#587 |
| 80. | Ashland | 50 | 24,635(0.20%)#80 | 275,476(0.02%)#596 |
| 81. | Hercules | 49 | 24,635(0.20%)#81 | 275,476(0.02%)#603 |
| 82. | Redwood City | 48 | 24,635(0.19%)#82 | 275,476(0.02%)#606 |
| 83. | Redondo Beach | 48 | 24,635(0.19%)#83 | 275,476(0.02%)#607 |
| 84. | Yorba Linda | 48 | 24,635(0.19%)#84 | 275,476(0.02%)#608 |
| 85. | Bakersfield | 47 | 24,635(0.19%)#85 | 275,476(0.02%)#615 |
| 86. | Petaluma | 46 | 24,635(0.19%)#86 | 275,476(0.02%)#623 |
| 87. | Rosamond | 46 | 24,635(0.19%)#87 | 275,476(0.02%)#626 |
| 88. | Pinole | 45 | 24,635(0.18%)#88 | 275,476(0.02%)#634 |
| 89. | Thousand Oaks | 43 | 24,635(0.17%)#89 | 275,476(0.02%)#642 |
| 90. | Mountain View | 43 | 24,635(0.17%)#90 | 275,476(0.02%)#647 |
| 91. | Highland | 43 | 24,635(0.17%)#91 | 275,476(0.02%)#648 |
| 92. | Claremont | 42 | 24,635(0.17%)#92 | 275,476(0.02%)#655 |
| 93. | Rodeo | 41 | 24,635(0.17%)#93 | 275,476(0.01%)#669 |
| 94. | Chino | 40 | 24,635(0.16%)#94 | 275,476(0.01%)#672 |
| 95. | North Highlands | 37 | 24,635(0.15%)#95 | 275,476(0.01%)#699 |
| 96. | Martinez | 36 | 24,635(0.15%)#96 | 275,476(0.01%)#717 |
| 97. | North Fair Oaks | 35 | 24,635(0.14%)#97 | 275,476(0.01%)#733 |
| 98. | Corona | 34 | 24,635(0.14%)#98 | 275,476(0.01%)#737 |
| 99. | Poway | 34 | 24,635(0.14%)#99 | 275,476(0.01%)#739 |
| 100. | Encinitas | 33 | 24,635(0.13%)#100 | 275,476(0.01%)#752 |
Common Questions
What are the Top 10 Cities with the Most Immigrants from Ethiopia in California?
Top 10 Cities with the Most Immigrants from Ethiopia in California are:
#1
4,092
#2
3,031
#3
2,446
#4
2,061
#5
702
#6
678
#7
520
#8
431
#9
410
#10
338
What city has the Most Immigrants from Ethiopia in California?
Los Angeles has the Most Immigrants from Ethiopia in California with 4,092.
What is the Total Immigrants from Ethiopia in the State of California?
Total Immigrants from Ethiopia in California is 24,635.
What is the Total Immigrants from Ethiopia in the United States?
Total Immigrants from Ethiopia in the United States is 275,476.