Cities with the Highest Percentage of Ukrainian Population in California
RELATED REPORTS & OPTIONS
Ukrainian
California
Compare Cities
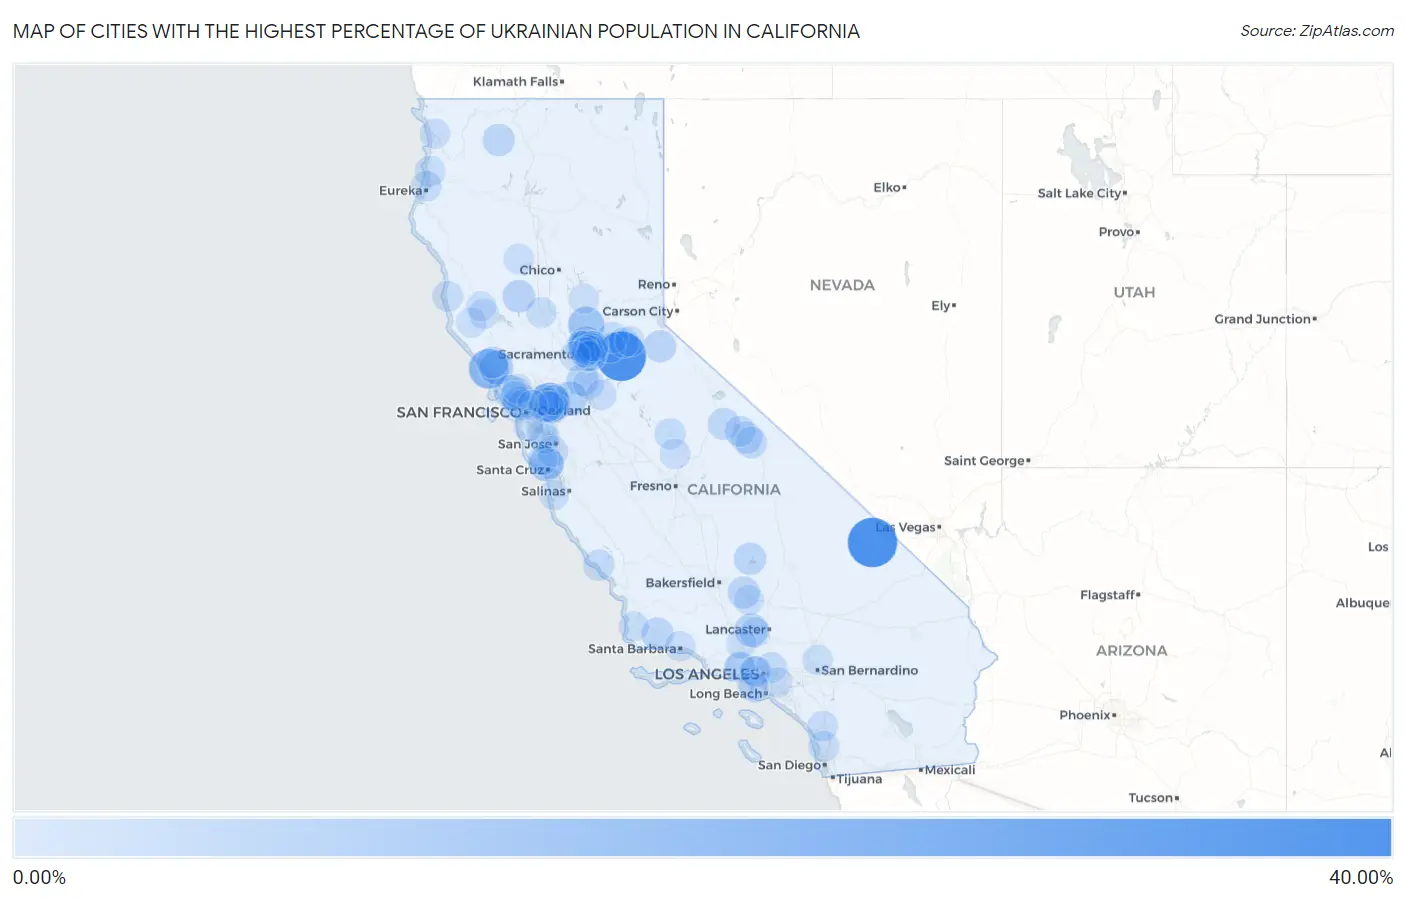
Map of Cities with the Highest Percentage of Ukrainian Population in California
0.00%
40.00%
Cities with the Highest Percentage of Ukrainian Population in California
| City | Ukrainian | vs State | vs National | |
| 1. | River Pines | 30.60% | 0.30%(+30.3)#1 | 0.31%(+30.3)#16 |
| 2. | Shoshone | 30.43% | 0.30%(+30.1)#2 | 0.31%(+30.1)#17 |
| 3. | North Gate | 15.56% | 0.30%(+15.3)#3 | 0.31%(+15.2)#34 |
| 4. | Sereno Del Mar | 15.31% | 0.30%(+15.0)#4 | 0.31%(+15.0)#36 |
| 5. | Sheridan | 10.24% | 0.30%(+9.94)#5 | 0.31%(+9.92)#59 |
| 6. | Antelope | 8.49% | 0.30%(+8.20)#6 | 0.31%(+8.18)#70 |
| 7. | Mount Hermon | 8.26% | 0.30%(+7.96)#7 | 0.31%(+7.95)#74 |
| 8. | Castle Hill | 7.33% | 0.30%(+7.03)#8 | 0.31%(+7.01)#96 |
| 9. | Knightsen | 7.11% | 0.30%(+6.81)#9 | 0.31%(+6.79)#100 |
| 10. | Occidental | 6.88% | 0.30%(+6.58)#10 | 0.31%(+6.57)#102 |
| 11. | Foothill Farms | 5.97% | 0.30%(+5.67)#11 | 0.31%(+5.66)#120 |
| 12. | Lake Hughes | 5.88% | 0.30%(+5.58)#12 | 0.31%(+5.57)#121 |
| 13. | North Highlands | 5.71% | 0.30%(+5.41)#13 | 0.31%(+5.40)#132 |
| 14. | Bear Valley Cdp Alpine County | 5.56% | 0.30%(+5.26)#14 | 0.31%(+5.24)#140 |
| 15. | Stonyford | 4.88% | 0.30%(+4.58)#15 | 0.31%(+4.56)#172 |
| 16. | Nicasio | 4.82% | 0.30%(+4.52)#16 | 0.31%(+4.50)#178 |
| 17. | Ballard | 4.44% | 0.30%(+4.14)#17 | 0.31%(+4.12)#199 |
| 18. | Elfin Forest | 4.37% | 0.30%(+4.07)#18 | 0.31%(+4.05)#211 |
| 19. | Wofford Heights | 4.28% | 0.30%(+3.98)#19 | 0.31%(+3.96)#221 |
| 20. | Keene | 4.21% | 0.30%(+3.91)#20 | 0.31%(+3.89)#226 |
| 21. | Etna | 4.04% | 0.30%(+3.75)#21 | 0.31%(+3.73)#242 |
| 22. | Kirkwood | 4.02% | 0.30%(+3.72)#22 | 0.31%(+3.70)#245 |
| 23. | Diablo | 4.02% | 0.30%(+3.72)#23 | 0.31%(+3.70)#246 |
| 24. | Thornton | 4.01% | 0.30%(+3.71)#24 | 0.31%(+3.69)#248 |
| 25. | Mammoth Lakes | 3.70% | 0.30%(+3.40)#25 | 0.31%(+3.38)#275 |
| 26. | Mesa | 3.48% | 0.30%(+3.18)#26 | 0.31%(+3.16)#304 |
| 27. | Jones Valley | 3.41% | 0.30%(+3.11)#27 | 0.31%(+3.09)#315 |
| 28. | West Bishop | 3.29% | 0.30%(+2.99)#28 | 0.31%(+2.98)#335 |
| 29. | Monte Rio | 3.24% | 0.30%(+2.94)#29 | 0.31%(+2.93)#345 |
| 30. | San Simeon | 2.93% | 0.30%(+2.63)#30 | 0.31%(+2.62)#410 |
| 31. | Rancho Cordova | 2.65% | 0.30%(+2.35)#31 | 0.31%(+2.33)#474 |
| 32. | East Palo Alto | 2.57% | 0.30%(+2.27)#32 | 0.31%(+2.26)#495 |
| 33. | Citrus Heights | 2.54% | 0.30%(+2.24)#33 | 0.31%(+2.23)#507 |
| 34. | Reliez Valley | 2.54% | 0.30%(+2.24)#34 | 0.31%(+2.22)#508 |
| 35. | San Pasqual | 2.53% | 0.30%(+2.24)#35 | 0.31%(+2.22)#510 |
| 36. | Coloma | 2.51% | 0.30%(+2.21)#36 | 0.31%(+2.19)#518 |
| 37. | Swall Meadows | 2.47% | 0.30%(+2.17)#37 | 0.31%(+2.15)#534 |
| 38. | Muir Beach | 2.46% | 0.30%(+2.16)#38 | 0.31%(+2.14)#536 |
| 39. | Woodbridge | 2.45% | 0.30%(+2.16)#39 | 0.31%(+2.14)#537 |
| 40. | Mill Valley | 2.42% | 0.30%(+2.12)#40 | 0.31%(+2.10)#551 |
| 41. | Bootjack | 2.37% | 0.30%(+2.08)#41 | 0.31%(+2.06)#567 |
| 42. | West Hollywood | 2.26% | 0.30%(+1.96)#42 | 0.31%(+1.94)#607 |
| 43. | Los Gatos | 2.26% | 0.30%(+1.96)#43 | 0.31%(+1.94)#608 |
| 44. | Spring Valley Cdp Lake County | 2.25% | 0.30%(+1.95)#44 | 0.31%(+1.93)#614 |
| 45. | Rio Linda | 2.25% | 0.30%(+1.95)#45 | 0.31%(+1.93)#616 |
| 46. | Caspar | 2.22% | 0.30%(+1.92)#46 | 0.31%(+1.91)#626 |
| 47. | Fairbanks Ranch | 2.19% | 0.30%(+1.89)#47 | 0.31%(+1.87)#640 |
| 48. | Westhaven Moonstone | 2.00% | 0.30%(+1.71)#48 | 0.31%(+1.69)#717 |
| 49. | Manila | 1.96% | 0.30%(+1.66)#49 | 0.31%(+1.65)#739 |
| 50. | Green Valley Cdp Los Angeles County | 1.92% | 0.30%(+1.63)#50 | 0.31%(+1.61)#762 |
| 51. | Rosemont | 1.85% | 0.30%(+1.55)#51 | 0.31%(+1.53)#821 |
| 52. | Williams | 1.84% | 0.30%(+1.54)#52 | 0.31%(+1.53)#826 |
| 53. | Fair Oaks | 1.80% | 0.30%(+1.50)#53 | 0.31%(+1.49)#845 |
| 54. | Bonsall | 1.77% | 0.30%(+1.47)#54 | 0.31%(+1.45)#863 |
| 55. | Gold River | 1.73% | 0.30%(+1.43)#55 | 0.31%(+1.42)#888 |
| 56. | Rancho Mission Viejo | 1.73% | 0.30%(+1.43)#56 | 0.31%(+1.41)#889 |
| 57. | Shingle Springs | 1.67% | 0.30%(+1.38)#57 | 0.31%(+1.36)#938 |
| 58. | Sonoma State University | 1.64% | 0.30%(+1.34)#58 | 0.31%(+1.33)#972 |
| 59. | Paskenta | 1.59% | 0.30%(+1.29)#59 | 0.31%(+1.27)#1,013 |
| 60. | Talmage | 1.55% | 0.30%(+1.25)#60 | 0.31%(+1.24)#1,043 |
| 61. | Baywood Park | 1.54% | 0.30%(+1.24)#61 | 0.31%(+1.23)#1,054 |
| 62. | Linden | 1.52% | 0.30%(+1.22)#62 | 0.31%(+1.20)#1,071 |
| 63. | Klamath | 1.52% | 0.30%(+1.22)#63 | 0.31%(+1.20)#1,073 |
| 64. | Belvedere | 1.50% | 0.30%(+1.21)#64 | 0.31%(+1.19)#1,085 |
| 65. | Camino | 1.50% | 0.30%(+1.20)#65 | 0.31%(+1.18)#1,093 |
| 66. | Carmichael | 1.49% | 0.30%(+1.19)#66 | 0.31%(+1.18)#1,104 |
| 67. | Mather | 1.49% | 0.30%(+1.19)#67 | 0.31%(+1.17)#1,112 |
| 68. | Yosemite Lakes | 1.47% | 0.30%(+1.17)#68 | 0.31%(+1.16)#1,125 |
| 69. | Crestline | 1.47% | 0.30%(+1.17)#69 | 0.31%(+1.15)#1,129 |
| 70. | Calabasas | 1.41% | 0.30%(+1.11)#70 | 0.31%(+1.10)#1,180 |
| 71. | Tehachapi | 1.38% | 0.30%(+1.08)#71 | 0.31%(+1.06)#1,205 |
| 72. | Mission Canyon | 1.36% | 0.30%(+1.06)#72 | 0.31%(+1.05)#1,225 |
| 73. | Hidden Hills | 1.33% | 0.30%(+1.03)#73 | 0.31%(+1.01)#1,264 |
| 74. | Las Flores Cdp Orange County | 1.30% | 0.30%(+1.01)#74 | 0.31%(+0.988)#1,286 |
| 75. | Vandenberg Afb | 1.28% | 0.30%(+0.979)#75 | 0.31%(+0.962)#1,326 |
| 76. | East Whittier | 1.27% | 0.30%(+0.971)#76 | 0.31%(+0.954)#1,337 |
| 77. | Elizabeth Lake | 1.25% | 0.30%(+0.950)#77 | 0.31%(+0.932)#1,369 |
| 78. | Orangevale | 1.23% | 0.30%(+0.930)#78 | 0.31%(+0.912)#1,397 |
| 79. | West Sacramento | 1.22% | 0.30%(+0.925)#79 | 0.31%(+0.907)#1,405 |
| 80. | Boonville | 1.21% | 0.30%(+0.908)#80 | 0.31%(+0.891)#1,422 |
| 81. | Mountain View | 1.17% | 0.30%(+0.876)#81 | 0.31%(+0.859)#1,464 |
| 82. | Castaic | 1.17% | 0.30%(+0.872)#82 | 0.31%(+0.854)#1,477 |
| 83. | Lucas Valley Marinwood | 1.15% | 0.30%(+0.855)#83 | 0.31%(+0.838)#1,497 |
| 84. | Pacific Grove | 1.13% | 0.30%(+0.835)#84 | 0.31%(+0.818)#1,526 |
| 85. | Beverly Hills | 1.13% | 0.30%(+0.835)#85 | 0.31%(+0.818)#1,527 |
| 86. | Pollock Pines | 1.13% | 0.30%(+0.835)#86 | 0.31%(+0.817)#1,529 |
| 87. | Arden Arcade | 1.13% | 0.30%(+0.830)#87 | 0.31%(+0.812)#1,540 |
| 88. | Strawberry Cdp Marin County | 1.12% | 0.30%(+0.821)#88 | 0.31%(+0.804)#1,553 |
| 89. | Novato | 1.11% | 0.30%(+0.813)#89 | 0.31%(+0.795)#1,569 |
| 90. | Fairfax | 1.08% | 0.30%(+0.786)#90 | 0.31%(+0.769)#1,609 |
| 91. | Scotts Valley | 1.07% | 0.30%(+0.773)#91 | 0.31%(+0.755)#1,633 |
| 92. | Brookdale | 1.06% | 0.30%(+0.766)#92 | 0.31%(+0.749)#1,653 |
| 93. | Manhattan Beach | 1.04% | 0.30%(+0.747)#93 | 0.31%(+0.730)#1,691 |
| 94. | Hermosa Beach | 1.04% | 0.30%(+0.746)#94 | 0.31%(+0.728)#1,693 |
| 95. | Clayton | 1.04% | 0.30%(+0.741)#95 | 0.31%(+0.724)#1,703 |
| 96. | Calpella | 1.04% | 0.30%(+0.741)#96 | 0.31%(+0.724)#1,704 |
| 97. | Alamo | 1.04% | 0.30%(+0.740)#97 | 0.31%(+0.723)#1,707 |
| 98. | Loma Rica | 1.04% | 0.30%(+0.739)#98 | 0.31%(+0.721)#1,709 |
| 99. | Berkeley | 1.02% | 0.30%(+0.721)#99 | 0.31%(+0.704)#1,739 |
| 100. | Burlingame | 1.02% | 0.30%(+0.719)#100 | 0.31%(+0.701)#1,748 |
Common Questions
What are the Top 10 Cities with the Highest Percentage of Ukrainian Population in California?
Top 10 Cities with the Highest Percentage of Ukrainian Population in California are:
#1
30.60%
#2
30.43%
#3
15.56%
#4
15.31%
#5
10.24%
#6
8.49%
#7
8.26%
#8
7.33%
#9
7.11%
#10
6.88%
What city has the Highest Percentage of Ukrainian Population in California?
River Pines has the Highest Percentage of Ukrainian Population in California with 30.60%.
What is the Percentage of Ukrainian Population in the State of California?
Percentage of Ukrainian Population in California is 0.30%.
What is the Percentage of Ukrainian Population in the United States?
Percentage of Ukrainian Population in the United States is 0.31%.