Cities with the Highest Poverty Level Among Single Mothers in California
RELATED REPORTS & OPTIONS
Highest Poverty | Single Mother
California
Compare Cities
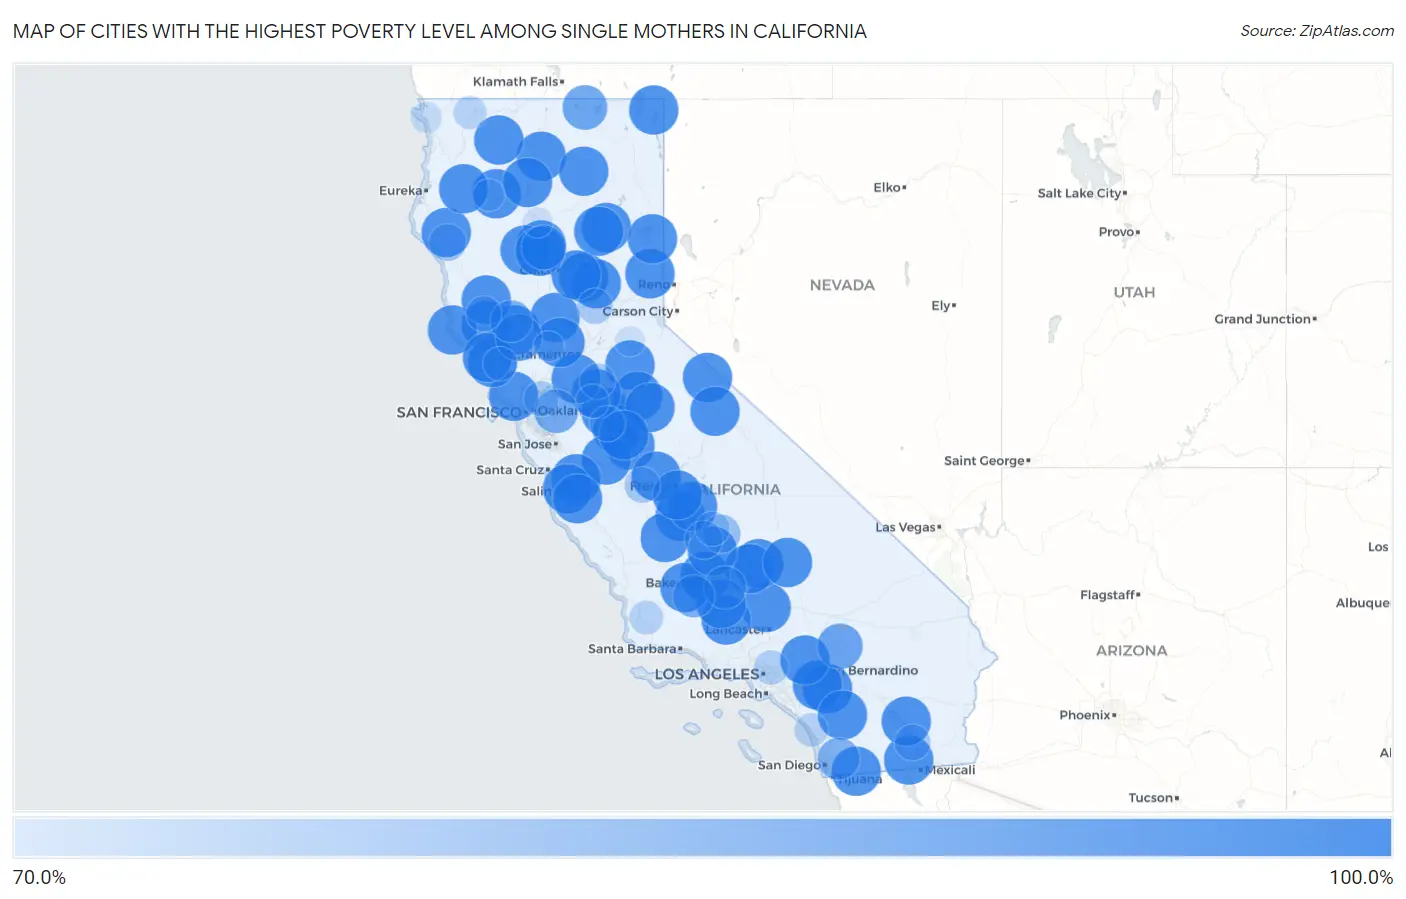
Map of Cities with the Highest Poverty Level Among Single Mothers in California
0.0%
100.0%
Cities with the Highest Poverty Level Among Single Mothers in California
| City | Single Mother Poverty | vs State | vs National | |
| 1. | Camp Pendleton Mainside | 100.0% | 29.2%(+70.8)#1 | 33.1%(+66.9)#3 |
| 2. | Escalon | 100.0% | 29.2%(+70.8)#2 | 33.1%(+66.9)#6 |
| 3. | Mcswain | 100.0% | 29.2%(+70.8)#3 | 33.1%(+66.9)#21 |
| 4. | Armona | 100.0% | 29.2%(+70.8)#4 | 33.1%(+66.9)#30 |
| 5. | Denair | 100.0% | 29.2%(+70.8)#5 | 33.1%(+66.9)#33 |
| 6. | Mojave | 100.0% | 29.2%(+70.8)#6 | 33.1%(+66.9)#39 |
| 7. | Weaverville | 100.0% | 29.2%(+70.8)#7 | 33.1%(+66.9)#50 |
| 8. | Weldon | 100.0% | 29.2%(+70.8)#8 | 33.1%(+66.9)#110 |
| 9. | Lakeview | 100.0% | 29.2%(+70.8)#9 | 33.1%(+66.9)#132 |
| 10. | Bodfish | 100.0% | 29.2%(+70.8)#10 | 33.1%(+66.9)#134 |
| 11. | Santa Nella | 100.0% | 29.2%(+70.8)#11 | 33.1%(+66.9)#153 |
| 12. | San Juan Bautista | 100.0% | 29.2%(+70.8)#12 | 33.1%(+66.9)#159 |
| 13. | Boronda | 100.0% | 29.2%(+70.8)#13 | 33.1%(+66.9)#167 |
| 14. | Seeley | 100.0% | 29.2%(+70.8)#14 | 33.1%(+66.9)#183 |
| 15. | Woodacre | 100.0% | 29.2%(+70.8)#15 | 33.1%(+66.9)#257 |
| 16. | Lower Lake | 100.0% | 29.2%(+70.8)#16 | 33.1%(+66.9)#273 |
| 17. | Pioneer | 100.0% | 29.2%(+70.8)#17 | 33.1%(+66.9)#274 |
| 18. | Trabuco Canyon | 100.0% | 29.2%(+70.8)#18 | 33.1%(+66.9)#294 |
| 19. | March Arb | 100.0% | 29.2%(+70.8)#19 | 33.1%(+66.9)#332 |
| 20. | Westwood | 100.0% | 29.2%(+70.8)#20 | 33.1%(+66.9)#347 |
| 21. | Gerber | 100.0% | 29.2%(+70.8)#21 | 33.1%(+66.9)#358 |
| 22. | Hopland | 100.0% | 29.2%(+70.8)#22 | 33.1%(+66.9)#387 |
| 23. | Berry Creek | 100.0% | 29.2%(+70.8)#23 | 33.1%(+66.9)#397 |
| 24. | Loyalton | 100.0% | 29.2%(+70.8)#24 | 33.1%(+66.9)#401 |
| 25. | Chualar | 100.0% | 29.2%(+70.8)#26 | 33.1%(+66.9)#424 |
| 26. | Mccloud | 100.0% | 29.2%(+70.8)#27 | 33.1%(+66.9)#425 |
| 27. | Kettleman City | 100.0% | 29.2%(+70.8)#28 | 33.1%(+66.9)#430 |
| 28. | Tuttletown | 100.0% | 29.2%(+70.8)#29 | 33.1%(+66.9)#436 |
| 29. | Inyokern | 100.0% | 29.2%(+70.8)#30 | 33.1%(+66.9)#451 |
| 30. | Lebec | 100.0% | 29.2%(+70.8)#31 | 33.1%(+66.9)#462 |
| 31. | La Vina | 100.0% | 29.2%(+70.8)#32 | 33.1%(+66.9)#463 |
| 32. | Waterloo | 100.0% | 29.2%(+70.8)#33 | 33.1%(+66.9)#502 |
| 33. | Walnut Grove | 100.0% | 29.2%(+70.8)#34 | 33.1%(+66.9)#520 |
| 34. | Rancho Tehama Reserve | 100.0% | 29.2%(+70.8)#35 | 33.1%(+66.9)#533 |
| 35. | Patton Village | 100.0% | 29.2%(+70.8)#36 | 33.1%(+66.9)#534 |
| 36. | Monte Rio | 100.0% | 29.2%(+70.8)#37 | 33.1%(+66.9)#546 |
| 37. | Etna | 100.0% | 29.2%(+70.8)#38 | 33.1%(+66.9)#585 |
| 38. | Point Arena | 100.0% | 29.2%(+70.8)#39 | 33.1%(+66.9)#630 |
| 39. | Miranda | 100.0% | 29.2%(+70.8)#40 | 33.1%(+66.9)#637 |
| 40. | Aguanga | 100.0% | 29.2%(+70.8)#41 | 33.1%(+66.9)#696 |
| 41. | Groveland | 100.0% | 29.2%(+70.8)#42 | 33.1%(+66.9)#706 |
| 42. | Lakehead | 100.0% | 29.2%(+70.8)#43 | 33.1%(+66.9)#728 |
| 43. | Potter Valley | 100.0% | 29.2%(+70.8)#44 | 33.1%(+66.9)#764 |
| 44. | Ballico | 100.0% | 29.2%(+70.8)#45 | 33.1%(+66.9)#767 |
| 45. | Lake Almanor Country Club | 100.0% | 29.2%(+70.8)#46 | 33.1%(+66.9)#775 |
| 46. | Lytle Creek | 100.0% | 29.2%(+70.8)#47 | 33.1%(+66.9)#779 |
| 47. | Potrero | 100.0% | 29.2%(+70.8)#48 | 33.1%(+66.9)#799 |
| 48. | Traver | 100.0% | 29.2%(+70.8)#49 | 33.1%(+66.9)#904 |
| 49. | Mcarthur | 100.0% | 29.2%(+70.8)#50 | 33.1%(+66.9)#909 |
| 50. | Cazadero | 100.0% | 29.2%(+70.8)#51 | 33.1%(+66.9)#918 |
| 51. | Bridgeport | 100.0% | 29.2%(+70.8)#52 | 33.1%(+66.9)#937 |
| 52. | Grimes | 100.0% | 29.2%(+70.8)#53 | 33.1%(+66.9)#1,035 |
| 53. | Clipper Mills | 100.0% | 29.2%(+70.8)#54 | 33.1%(+66.9)#1,109 |
| 54. | June Lake | 100.0% | 29.2%(+70.8)#55 | 33.1%(+66.9)#1,126 |
| 55. | Yolo | 100.0% | 29.2%(+70.8)#56 | 33.1%(+66.9)#1,176 |
| 56. | Bombay Beach | 100.0% | 29.2%(+70.8)#57 | 33.1%(+66.9)#1,296 |
| 57. | Burnt Ranch | 100.0% | 29.2%(+70.8)#58 | 33.1%(+66.9)#1,340 |
| 58. | Bowles | 100.0% | 29.2%(+70.8)#59 | 33.1%(+66.9)#1,347 |
| 59. | Cherokee | 100.0% | 29.2%(+70.8)#60 | 33.1%(+66.9)#1,404 |
| 60. | Cherokee Strip | 100.0% | 29.2%(+70.8)#61 | 33.1%(+66.9)#1,508 |
| 61. | Fort Bidwell | 100.0% | 29.2%(+70.8)#62 | 33.1%(+66.9)#1,524 |
| 62. | La Grange | 100.0% | 29.2%(+70.8)#63 | 33.1%(+66.9)#1,606 |
| 63. | Richfield | 100.0% | 29.2%(+70.8)#64 | 33.1%(+66.9)#1,609 |
| 64. | Mettler | 100.0% | 29.2%(+70.8)#65 | 33.1%(+66.9)#1,682 |
| 65. | Mckittrick | 100.0% | 29.2%(+70.8)#66 | 33.1%(+66.9)#1,779 |
| 66. | Rodriguez Camp | 100.0% | 29.2%(+70.8)#67 | 33.1%(+66.9)#1,899 |
| 67. | Wautec | 100.0% | 29.2%(+70.8)#68 | 33.1%(+66.9)#1,967 |
| 68. | Hidden Valley Lake | 96.2% | 29.2%(+67.0)#69 | 33.1%(+63.0)#1,994 |
| 69. | Lucerne Valley | 94.1% | 29.2%(+64.9)#70 | 33.1%(+61.0)#2,019 |
| 70. | Newell | 93.1% | 29.2%(+63.9)#71 | 33.1%(+60.0)#2,065 |
| 71. | Los Molinos | 93.0% | 29.2%(+63.8)#72 | 33.1%(+59.8)#2,068 |
| 72. | Camino Tassajara | 91.7% | 29.2%(+62.5)#73 | 33.1%(+58.5)#2,100 |
| 73. | Fuller Acres | 90.4% | 29.2%(+61.2)#74 | 33.1%(+57.2)#2,152 |
| 74. | Ford City | 89.6% | 29.2%(+60.4)#75 | 33.1%(+56.5)#2,178 |
| 75. | Clearlake Oaks | 89.4% | 29.2%(+60.2)#76 | 33.1%(+56.3)#2,190 |
| 76. | Granite Hills | 89.2% | 29.2%(+60.0)#77 | 33.1%(+56.1)#2,198 |
| 77. | East Porterville | 84.0% | 29.2%(+54.8)#78 | 33.1%(+50.9)#2,486 |
| 78. | Pixley | 83.9% | 29.2%(+54.7)#79 | 33.1%(+50.7)#2,497 |
| 79. | Garberville | 82.2% | 29.2%(+53.1)#80 | 33.1%(+49.1)#2,611 |
| 80. | Mendota | 80.5% | 29.2%(+51.3)#81 | 33.1%(+47.4)#2,719 |
| 81. | Westmorland | 80.5% | 29.2%(+51.3)#82 | 33.1%(+47.4)#2,721 |
| 82. | Bystrom | 80.2% | 29.2%(+51.0)#83 | 33.1%(+47.1)#2,730 |
| 83. | Lake Wildwood | 80.0% | 29.2%(+50.8)#84 | 33.1%(+46.9)#2,735 |
| 84. | Dogtown | 80.0% | 29.2%(+50.8)#85 | 33.1%(+46.9)#2,737 |
| 85. | Talmage | 80.0% | 29.2%(+50.8)#86 | 33.1%(+46.9)#2,743 |
| 86. | Alhambra Valley | 79.7% | 29.2%(+50.5)#87 | 33.1%(+46.6)#2,807 |
| 87. | San Pasqual | 78.6% | 29.2%(+49.4)#88 | 33.1%(+45.4)#2,875 |
| 88. | Plainview | 78.6% | 29.2%(+49.4)#89 | 33.1%(+45.4)#2,886 |
| 89. | Graton | 77.9% | 29.2%(+48.7)#90 | 33.1%(+44.7)#2,921 |
| 90. | Sisquoc | 77.8% | 29.2%(+48.6)#91 | 33.1%(+44.6)#2,954 |
| 91. | Kennedy | 77.4% | 29.2%(+48.2)#92 | 33.1%(+44.2)#2,981 |
| 92. | Camp Pendleton South | 77.3% | 29.2%(+48.1)#93 | 33.1%(+44.1)#2,985 |
| 93. | Happy Camp | 76.9% | 29.2%(+47.7)#94 | 33.1%(+43.8)#3,015 |
| 94. | University Of California-Santa Barbara | 75.0% | 29.2%(+45.8)#95 | 33.1%(+41.9)#3,146 |
| 95. | Junction City | 75.0% | 29.2%(+45.8)#96 | 33.1%(+41.9)#3,165 |
| 96. | Bertsch Oceanview | 74.0% | 29.2%(+44.8)#97 | 33.1%(+40.9)#3,296 |
| 97. | Franklin Cdp Merced County | 73.6% | 29.2%(+44.4)#98 | 33.1%(+40.4)#3,343 |
| 98. | Lake California | 72.9% | 29.2%(+43.7)#99 | 33.1%(+39.8)#3,396 |
| 99. | Pollock Pines | 72.7% | 29.2%(+43.5)#100 | 33.1%(+39.6)#3,404 |
| 100. | Esparto | 72.7% | 29.2%(+43.5)#101 | 33.1%(+39.6)#3,405 |
Common Questions
What are the Top 10 Cities with the Highest Poverty Level Among Single Mothers in California?
Top 10 Cities with the Highest Poverty Level Among Single Mothers in California are:
#1
100.0%
#2
100.0%
#3
100.0%
#4
100.0%
#5
100.0%
#6
100.0%
#7
100.0%
#8
100.0%
#9
100.0%
#10
100.0%
What city has the Highest Poverty Level Among Single Mothers in California?
Escalon has the Highest Poverty Level Among Single Mothers in California with 100.0%.
What is the Poverty Level Among Single Mothers in the State of California?
Poverty Level Among Single Mothers in California is 29.2%.
What is the Poverty Level Among Single Mothers in the United States?
Poverty Level Among Single Mothers in the United States is 33.1%.