Cities with the Highest Percentage of Population Employed in Installation, Maintenance & Repair in Massachusetts
RELATED REPORTS & OPTIONS
Installation, Maintenance & Repair
Massachusetts
Compare Cities
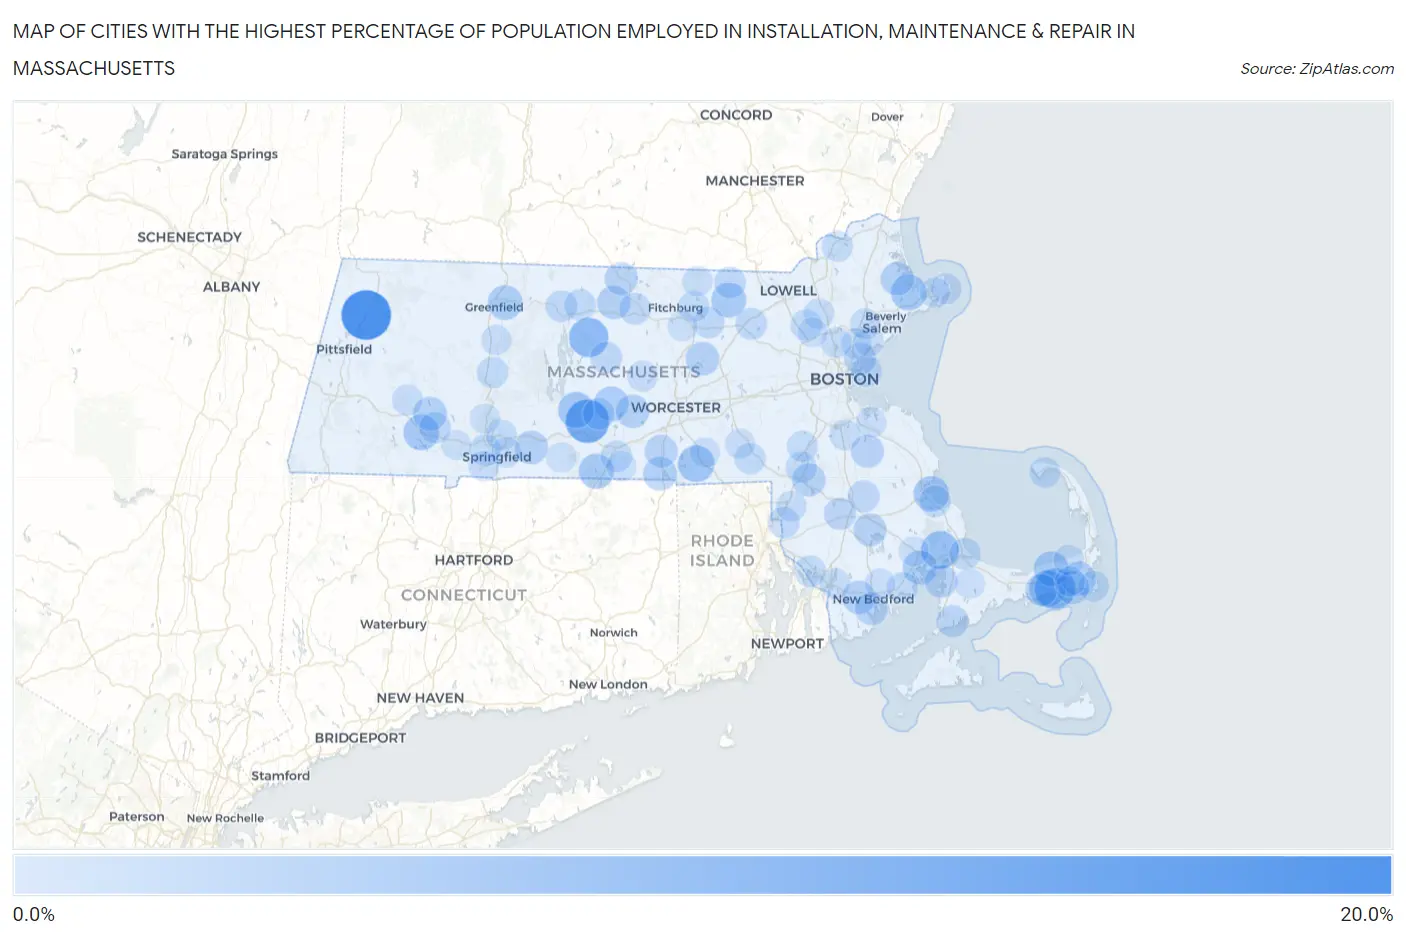
Map of Cities with the Highest Percentage of Population Employed in Installation, Maintenance & Repair in Massachusetts
0.0%
20.0%
Cities with the Highest Percentage of Population Employed in Installation, Maintenance & Repair in Massachusetts
| City | % Employed | vs State | vs National | |
| 1. | Cheshire | 17.8% | 2.2%(+15.6)#1 | 3.1%(+14.7)#838 |
| 2. | Warren | 13.0% | 2.2%(+10.8)#2 | 3.1%(+9.92)#1,572 |
| 3. | West Warren | 10.6% | 2.2%(+8.41)#3 | 3.1%(+7.54)#2,282 |
| 4. | Dennis Port | 10.5% | 2.2%(+8.29)#4 | 3.1%(+7.42)#2,340 |
| 5. | Petersham | 9.7% | 2.2%(+7.46)#5 | 3.1%(+6.59)#2,765 |
| 6. | White Island Shores | 8.5% | 2.2%(+6.29)#6 | 3.1%(+5.42)#3,513 |
| 7. | West Dennis | 7.6% | 2.2%(+5.38)#7 | 3.1%(+4.51)#4,340 |
| 8. | East Douglas | 7.6% | 2.2%(+5.36)#8 | 3.1%(+4.49)#4,366 |
| 9. | Ware | 7.3% | 2.2%(+5.09)#9 | 3.1%(+4.21)#4,664 |
| 10. | Oak Bluffs | 7.0% | 2.2%(+4.84)#10 | 3.1%(+3.97)#4,968 |
| 11. | Essex | 6.9% | 2.2%(+4.67)#11 | 3.1%(+3.80)#5,148 |
| 12. | Blandford | 6.7% | 2.2%(+4.55)#12 | 3.1%(+3.67)#5,330 |
| 13. | North Plymouth | 6.7% | 2.2%(+4.47)#13 | 3.1%(+3.60)#5,425 |
| 14. | Holland | 6.4% | 2.2%(+4.23)#14 | 3.1%(+3.36)#5,801 |
| 15. | East Dennis | 6.4% | 2.2%(+4.18)#15 | 3.1%(+3.30)#5,861 |
| 16. | Groton | 6.3% | 2.2%(+4.12)#16 | 3.1%(+3.25)#5,952 |
| 17. | Turners Falls | 6.0% | 2.2%(+3.83)#17 | 3.1%(+2.96)#6,415 |
| 18. | North Brookfield | 6.0% | 2.2%(+3.83)#18 | 3.1%(+2.96)#6,417 |
| 19. | Weweantic | 5.9% | 2.2%(+3.66)#19 | 3.1%(+2.78)#6,722 |
| 20. | East Harwich | 5.8% | 2.2%(+3.59)#20 | 3.1%(+2.72)#6,835 |
| 21. | Huntington | 5.4% | 2.2%(+3.23)#21 | 3.1%(+2.36)#7,534 |
| 22. | Webster | 5.4% | 2.2%(+3.18)#22 | 3.1%(+2.30)#7,664 |
| 23. | Clinton | 5.3% | 2.2%(+3.08)#23 | 3.1%(+2.21)#7,850 |
| 24. | Harwich Port | 5.3% | 2.2%(+3.06)#24 | 3.1%(+2.19)#7,908 |
| 25. | Wilbraham | 5.2% | 2.2%(+3.02)#25 | 3.1%(+2.15)#7,970 |
| 26. | Spencer | 5.1% | 2.2%(+2.91)#26 | 3.1%(+2.04)#8,199 |
| 27. | Baldwinville | 5.1% | 2.2%(+2.90)#27 | 3.1%(+2.02)#8,226 |
| 28. | Ipswich | 5.1% | 2.2%(+2.87)#28 | 3.1%(+2.00)#8,282 |
| 29. | Smith Mills | 5.1% | 2.2%(+2.87)#29 | 3.1%(+2.00)#8,284 |
| 30. | Mansfield Center | 4.9% | 2.2%(+2.74)#30 | 3.1%(+1.87)#8,617 |
| 31. | North Lakeville | 4.9% | 2.2%(+2.68)#31 | 3.1%(+1.81)#8,754 |
| 32. | Winchendon | 4.8% | 2.2%(+2.58)#32 | 3.1%(+1.70)#9,013 |
| 33. | Pocasset | 4.7% | 2.2%(+2.54)#33 | 3.1%(+1.67)#9,104 |
| 34. | Abington | 4.7% | 2.2%(+2.52)#34 | 3.1%(+1.65)#9,138 |
| 35. | Oxford | 4.7% | 2.2%(+2.52)#35 | 3.1%(+1.65)#9,157 |
| 36. | Bliss Corner | 4.6% | 2.2%(+2.40)#36 | 3.1%(+1.53)#9,455 |
| 37. | North Attleborough | 4.5% | 2.2%(+2.32)#37 | 3.1%(+1.45)#9,713 |
| 38. | Revere | 4.2% | 2.2%(+1.99)#38 | 3.1%(+1.11)#10,639 |
| 39. | South Yarmouth | 4.2% | 2.2%(+1.95)#39 | 3.1%(+1.08)#10,737 |
| 40. | Taunton | 4.1% | 2.2%(+1.95)#40 | 3.1%(+1.07)#10,760 |
| 41. | Greenfield | 4.1% | 2.2%(+1.89)#41 | 3.1%(+1.02)#10,919 |
| 42. | Teaticket | 4.0% | 2.2%(+1.85)#42 | 3.1%(+0.977)#11,072 |
| 43. | Barre | 4.0% | 2.2%(+1.83)#43 | 3.1%(+0.954)#11,139 |
| 44. | Bridgewater Town | 4.0% | 2.2%(+1.81)#44 | 3.1%(+0.935)#11,175 |
| 45. | Gardner | 3.9% | 2.2%(+1.72)#45 | 3.1%(+0.848)#11,447 |
| 46. | Littleton Common | 3.9% | 2.2%(+1.70)#46 | 3.1%(+0.832)#11,501 |
| 47. | Russell | 3.9% | 2.2%(+1.69)#47 | 3.1%(+0.819)#11,547 |
| 48. | West Brookfield | 3.9% | 2.2%(+1.69)#48 | 3.1%(+0.818)#11,553 |
| 49. | Orange | 3.8% | 2.2%(+1.64)#49 | 3.1%(+0.764)#11,742 |
| 50. | East Pepperell | 3.8% | 2.2%(+1.61)#50 | 3.1%(+0.743)#11,801 |
| 51. | Sagamore | 3.8% | 2.2%(+1.61)#51 | 3.1%(+0.735)#11,828 |
| 52. | North Seekonk | 3.8% | 2.2%(+1.60)#52 | 3.1%(+0.731)#11,843 |
| 53. | Shirley | 3.8% | 2.2%(+1.60)#53 | 3.1%(+0.727)#11,855 |
| 54. | Athol | 3.8% | 2.2%(+1.59)#54 | 3.1%(+0.714)#11,891 |
| 55. | Hatfield | 3.8% | 2.2%(+1.58)#55 | 3.1%(+0.706)#11,920 |
| 56. | West Springfield Town | 3.8% | 2.2%(+1.57)#56 | 3.1%(+0.702)#11,949 |
| 57. | Plymouth | 3.8% | 2.2%(+1.56)#57 | 3.1%(+0.691)#11,988 |
| 58. | Ocean Grove | 3.7% | 2.2%(+1.55)#58 | 3.1%(+0.681)#12,015 |
| 59. | Sturbridge | 3.7% | 2.2%(+1.55)#59 | 3.1%(+0.674)#12,042 |
| 60. | Foxborough | 3.6% | 2.2%(+1.39)#60 | 3.1%(+0.515)#12,576 |
| 61. | Bellingham | 3.6% | 2.2%(+1.38)#61 | 3.1%(+0.513)#12,588 |
| 62. | Pinehurst | 3.6% | 2.2%(+1.37)#62 | 3.1%(+0.500)#12,642 |
| 63. | Winthrop Town | 3.5% | 2.2%(+1.34)#63 | 3.1%(+0.472)#12,724 |
| 64. | Lunenburg | 3.5% | 2.2%(+1.28)#64 | 3.1%(+0.409)#12,942 |
| 65. | Haverhill | 3.4% | 2.2%(+1.23)#65 | 3.1%(+0.358)#13,125 |
| 66. | Chicopee | 3.4% | 2.2%(+1.22)#66 | 3.1%(+0.346)#13,173 |
| 67. | Mattapoisett Center | 3.4% | 2.2%(+1.20)#67 | 3.1%(+0.324)#13,266 |
| 68. | Provincetown | 3.3% | 2.2%(+1.11)#68 | 3.1%(+0.240)#13,590 |
| 69. | Walpole | 3.3% | 2.2%(+1.11)#69 | 3.1%(+0.239)#13,594 |
| 70. | Chatham | 3.3% | 2.2%(+1.10)#70 | 3.1%(+0.225)#13,639 |
| 71. | Saugus | 3.2% | 2.2%(+1.05)#71 | 3.1%(+0.178)#13,808 |
| 72. | Randolph Town | 3.2% | 2.2%(+0.990)#72 | 3.1%(+0.119)#14,009 |
| 73. | Rockport | 3.2% | 2.2%(+0.979)#73 | 3.1%(+0.108)#14,052 |
| 74. | Stoneham | 3.1% | 2.2%(+0.943)#74 | 3.1%(+0.071)#14,217 |
| 75. | Wilmington | 3.1% | 2.2%(+0.929)#75 | 3.1%(+0.058)#14,257 |
| 76. | Peabody | 3.1% | 2.2%(+0.919)#76 | 3.1%(+0.047)#14,308 |
| 77. | Rutland | 3.1% | 2.2%(+0.911)#77 | 3.1%(+0.039)#14,332 |
| 78. | Chester | 3.1% | 2.2%(+0.877)#78 | 3.1%(+0.005)#14,455 |
| 79. | Fall River | 3.1% | 2.2%(+0.873)#79 | 3.1%(+0.001)#14,469 |
| 80. | Attleboro | 3.0% | 2.2%(+0.850)#80 | 3.1%(-0.022)#14,564 |
| 81. | Brewster | 3.0% | 2.2%(+0.844)#81 | 3.1%(-0.028)#14,582 |
| 82. | Springfield | 3.0% | 2.2%(+0.819)#82 | 3.1%(-0.053)#14,682 |
| 83. | Weymouth Town | 3.0% | 2.2%(+0.812)#83 | 3.1%(-0.060)#14,715 |
| 84. | Milford | 3.0% | 2.2%(+0.784)#84 | 3.1%(-0.088)#14,822 |
| 85. | South Deerfield | 3.0% | 2.2%(+0.773)#85 | 3.1%(-0.099)#14,876 |
| 86. | Harwich Center | 2.9% | 2.2%(+0.695)#86 | 3.1%(-0.176)#15,167 |
| 87. | Agawam Town | 2.8% | 2.2%(+0.651)#87 | 3.1%(-0.221)#15,342 |
| 88. | Acushnet Center | 2.8% | 2.2%(+0.616)#88 | 3.1%(-0.256)#15,480 |
| 89. | Townsend | 2.8% | 2.2%(+0.608)#89 | 3.1%(-0.264)#15,503 |
| 90. | Gloucester | 2.8% | 2.2%(+0.598)#90 | 3.1%(-0.273)#15,545 |
| 91. | Westfield | 2.8% | 2.2%(+0.571)#91 | 3.1%(-0.301)#15,659 |
| 92. | Monson Center | 2.7% | 2.2%(+0.540)#92 | 3.1%(-0.332)#15,780 |
| 93. | Holyoke | 2.7% | 2.2%(+0.537)#93 | 3.1%(-0.335)#15,789 |
| 94. | West Wareham | 2.7% | 2.2%(+0.536)#94 | 3.1%(-0.335)#15,791 |
| 95. | Southbridge Town | 2.7% | 2.2%(+0.522)#95 | 3.1%(-0.350)#15,855 |
| 96. | Forestdale | 2.7% | 2.2%(+0.504)#96 | 3.1%(-0.368)#15,936 |
| 97. | Leominster | 2.7% | 2.2%(+0.501)#97 | 3.1%(-0.371)#15,940 |
| 98. | Whitinsville | 2.7% | 2.2%(+0.479)#98 | 3.1%(-0.393)#16,025 |
| 99. | Lynn | 2.7% | 2.2%(+0.457)#99 | 3.1%(-0.415)#16,123 |
| 100. | Burlington | 2.6% | 2.2%(+0.449)#100 | 3.1%(-0.423)#16,155 |
Common Questions
What are the Top 10 Cities with the Highest Percentage of Population Employed in Installation, Maintenance & Repair in Massachusetts?
Top 10 Cities with the Highest Percentage of Population Employed in Installation, Maintenance & Repair in Massachusetts are:
#1
17.8%
#2
13.0%
#3
10.5%
#4
9.7%
#5
8.5%
#6
7.6%
#7
7.6%
#8
7.3%
#9
6.9%
#10
6.7%
What city has the Highest Percentage of Population Employed in Installation, Maintenance & Repair in Massachusetts?
Cheshire has the Highest Percentage of Population Employed in Installation, Maintenance & Repair in Massachusetts with 17.8%.
What is the Percentage of Population Employed in Installation, Maintenance & Repair in the State of Massachusetts?
Percentage of Population Employed in Installation, Maintenance & Repair in Massachusetts is 2.2%.
What is the Percentage of Population Employed in Installation, Maintenance & Repair in the United States?
Percentage of Population Employed in Installation, Maintenance & Repair in the United States is 3.1%.