Michigan Map & Demographics
Michigan Map

Michigan Overview
Jan 26, 1837
INCORPORATED
96,713
TOTAL AREA [ SQ MI ]
56,528
LAND AREA [ SQ MI ]
40,185
WATER AREA [ SQ MI ]
900
ELEVATION AVG [ FT ]
1,979
ELEVATION HIGH [ FT ]
572
ELEVATION LOW [ FT ]
177.9
POP DENSITY [ PPL / SQ MI ]
$37,929
PER CAPITA INCOME
$87,221
AVG FAMILY INCOME
$68,505
AVG HOUSEHOLD INCOME
31.6%
WAGE / INCOME GAP [ % ]
68.4¢/ $1
WAGE / INCOME GAP [ $ ]
$11,099
FAMILY INCOME DEFICIT
0.46
INEQUALITY / GINI INDEX
48197
LARGEST ZIP CODE
Detroit
LARGEST CITY
Wayne County
LARGEST COUNTY
10,057,921
TOTAL POPULATION
4,993,696
MALE POPULATION
5,064,225
FEMALE POPULATION
98.61
MALES / 100 FEMALES
101.41
FEMALES / 100 MALES
39.9
MEDIAN AGE
3.1
AVG FAMILY SIZE
2.5
AVG HOUSEHOLD SIZE
5,022,353
LABOR FORCE [ PEOPLE ]
61.5%
PERCENT IN LABOR FORCE
6.0%
UNEMPLOYMENT RATE
Income in Michigan
Income Overview in Michigan
Per Capita Income in Michigan is $37,929, while median incomes of families and households are $87,221 and $68,505 respectively.
| Characteristic | Number | Measure |
| Per Capita Income | 10,057,921 | $37,929 |
| Median Family Income | 2,527,912 | $87,221 |
| Mean Family Income | 2,527,912 | $111,997 |
| Median Household Income | 4,009,253 | $68,505 |
| Mean Household Income | 4,009,253 | $92,835 |
| Income Deficit | 2,527,912 | $11,099 |
| Wage / Income Gap (%) | 10,057,921 | 31.63% |
| Wage / Income Gap ($) | 10,057,921 | 68.37¢ per $1 |
| Gini / Inequality Index | 10,057,921 | 0.46 |
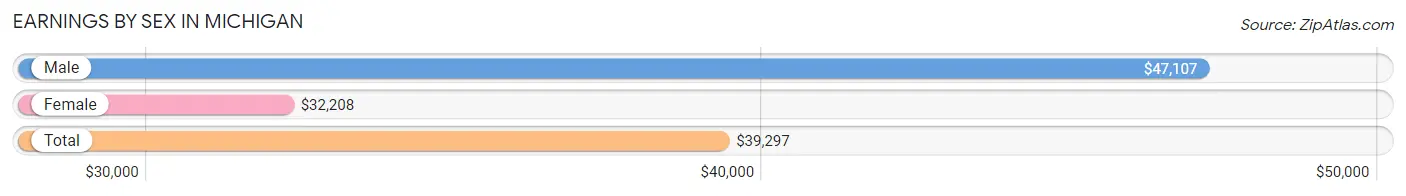
Earnings by Sex in Michigan
Average Earnings in Michigan are $39,297, $47,107 for men and $32,208 for women, a difference of 31.6%.
| Sex | Number | Average Earnings |
| Male | 2,776,182 (52.6%) | $47,107 |
| Female | 2,499,950 (47.4%) | $32,208 |
| Total | 5,276,132 (100.0%) | $39,297 |
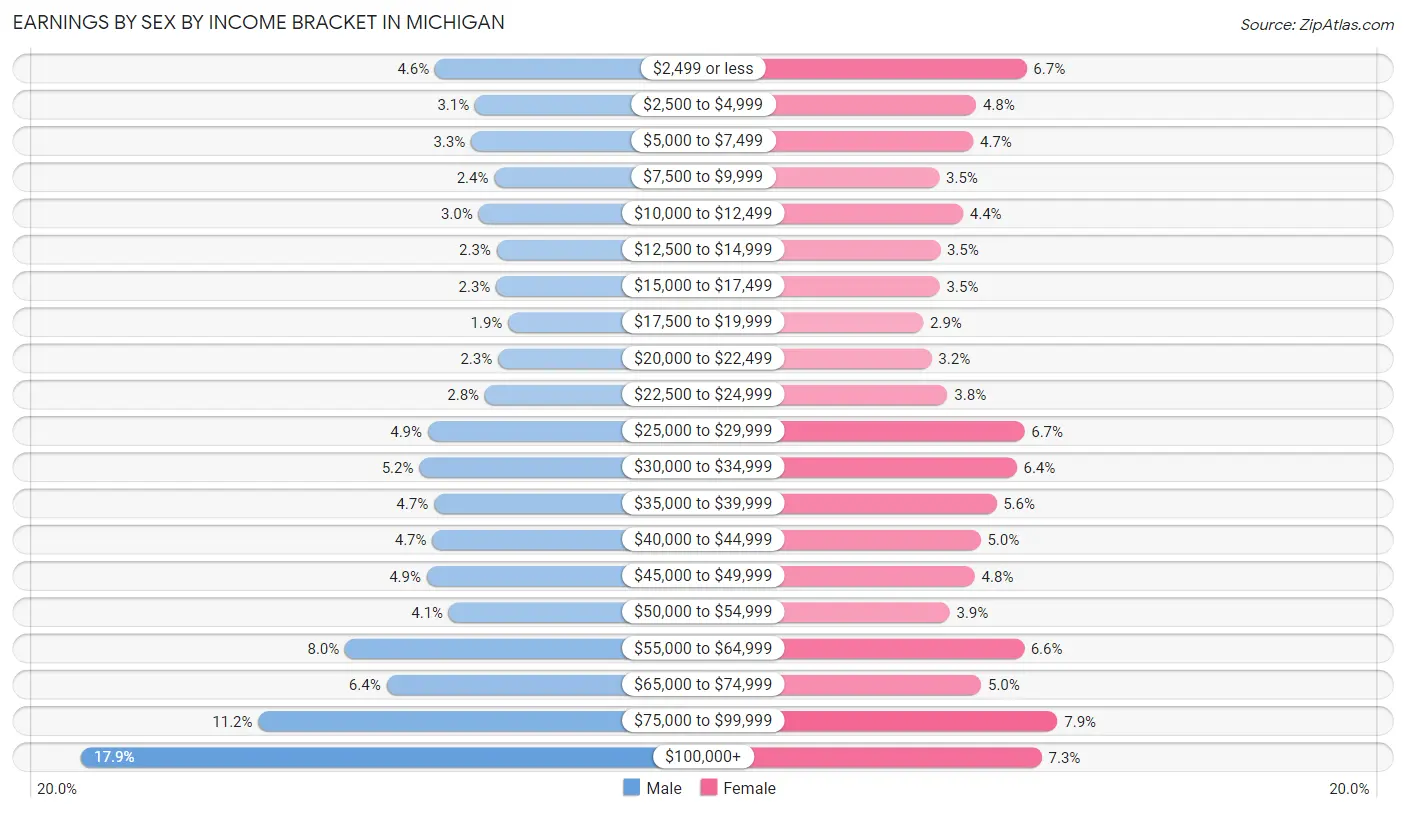
Earnings by Sex by Income Bracket in Michigan
The most common earnings brackets in Michigan are $100,000+ for men (496,365 | 17.9%) and $75,000 to $99,999 for women (197,130 | 7.9%).
| Income | Male | Female |
| $2,499 or less | 128,387 (4.6%) | 168,254 (6.7%) |
| $2,500 to $4,999 | 86,523 (3.1%) | 120,891 (4.8%) |
| $5,000 to $7,499 | 90,792 (3.3%) | 118,371 (4.7%) |
| $7,500 to $9,999 | 66,712 (2.4%) | 86,604 (3.5%) |
| $10,000 to $12,499 | 82,968 (3.0%) | 108,682 (4.3%) |
| $12,500 to $14,999 | 64,223 (2.3%) | 87,283 (3.5%) |
| $15,000 to $17,499 | 64,741 (2.3%) | 87,098 (3.5%) |
| $17,500 to $19,999 | 52,114 (1.9%) | 71,415 (2.9%) |
| $20,000 to $22,499 | 62,614 (2.3%) | 79,256 (3.2%) |
| $22,500 to $24,999 | 76,396 (2.8%) | 94,147 (3.8%) |
| $25,000 to $29,999 | 135,635 (4.9%) | 166,260 (6.7%) |
| $30,000 to $34,999 | 144,522 (5.2%) | 159,112 (6.4%) |
| $35,000 to $39,999 | 129,443 (4.7%) | 139,957 (5.6%) |
| $40,000 to $44,999 | 131,132 (4.7%) | 125,343 (5.0%) |
| $45,000 to $49,999 | 136,790 (4.9%) | 119,739 (4.8%) |
| $50,000 to $54,999 | 113,898 (4.1%) | 96,224 (3.8%) |
| $55,000 to $64,999 | 221,936 (8.0%) | 165,779 (6.6%) |
| $65,000 to $74,999 | 178,874 (6.4%) | 125,795 (5.0%) |
| $75,000 to $99,999 | 312,117 (11.2%) | 197,130 (7.9%) |
| $100,000+ | 496,365 (17.9%) | 182,610 (7.3%) |
| Total | 2,776,182 (100.0%) | 2,499,950 (100.0%) |
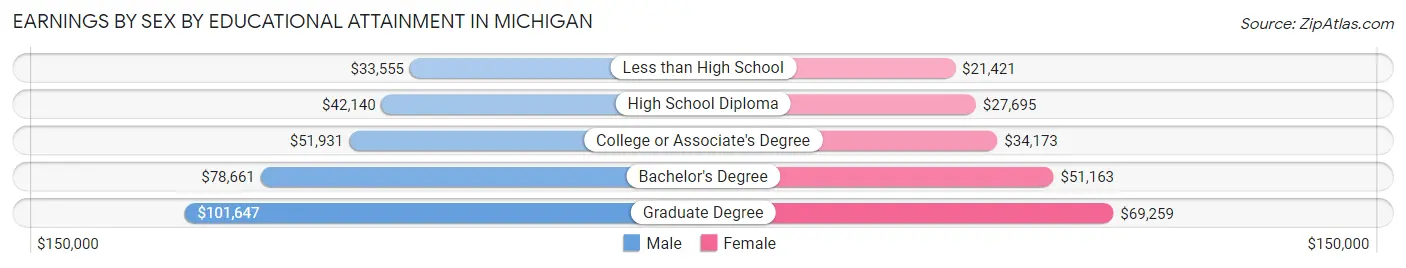
Earnings by Sex by Educational Attainment in Michigan
Average earnings in Michigan are $55,658 for men and $38,027 for women, a difference of 31.7%. Men with an educational attainment of graduate degree enjoy the highest average annual earnings of $101,647, while those with less than high school education earn the least with $33,555. Women with an educational attainment of graduate degree earn the most with the average annual earnings of $69,259, while those with less than high school education have the smallest earnings of $21,421.
| Educational Attainment | Male Income | Female Income |
| Less than High School | $33,555 | $21,421 |
| High School Diploma | $42,140 | $27,695 |
| College or Associate's Degree | $51,931 | $34,173 |
| Bachelor's Degree | $78,661 | $51,163 |
| Graduate Degree | $101,647 | $69,259 |
| Total | $55,658 | $38,027 |
Family Income in Michigan
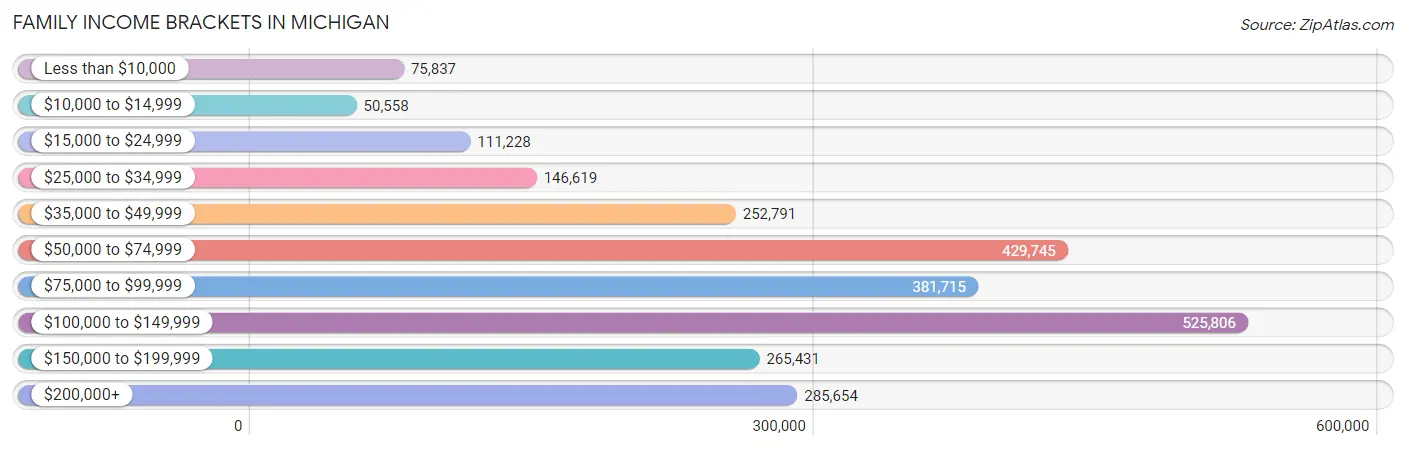
Family Income Brackets in Michigan
According to the Michigan family income data, there are 525,806 families falling into the $100,000 to $149,999 income range, which is the most common income bracket and makes up 20.8% of all families. Conversely, the $10,000 to $14,999 income bracket is the least frequent group with only 50,558 families (2.0%) belonging to this category.
| Income Bracket | # Families | % Families |
| Less than $10,000 | 75,837 | 3.0% |
| $10,000 to $14,999 | 50,558 | 2.0% |
| $15,000 to $24,999 | 111,228 | 4.4% |
| $25,000 to $34,999 | 146,619 | 5.8% |
| $35,000 to $49,999 | 252,791 | 10.0% |
| $50,000 to $74,999 | 429,745 | 17.0% |
| $75,000 to $99,999 | 381,715 | 15.1% |
| $100,000 to $149,999 | 525,806 | 20.8% |
| $150,000 to $199,999 | 265,431 | 10.5% |
| $200,000+ | 285,654 | 11.3% |
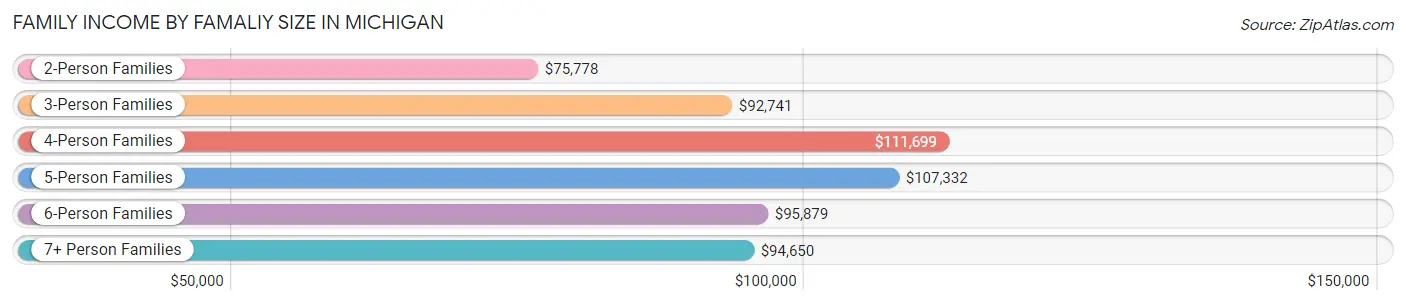
Family Income by Famaliy Size in Michigan
4-person families (430,834 | 17.0%) account for the highest median family income in Michigan with $111,699 per family, while 2-person families (1,257,160 | 49.7%) have the highest median income of $37,889 per family member.
| Income Bracket | # Families | Median Income |
| 2-Person Families | 1,257,160 (49.7%) | $75,778 |
| 3-Person Families | 544,249 (21.5%) | $92,741 |
| 4-Person Families | 430,834 (17.0%) | $111,699 |
| 5-Person Families | 188,678 (7.5%) | $107,332 |
| 6-Person Families | 68,382 (2.7%) | $95,879 |
| 7+ Person Families | 38,609 (1.5%) | $94,650 |
| Total | 2,527,912 (100.0%) | $87,221 |
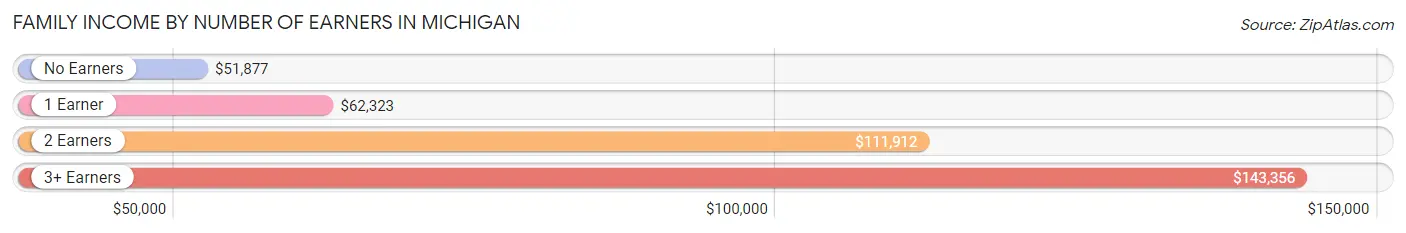
Family Income by Number of Earners in Michigan
The median family income in Michigan is $87,221, with families comprising 3+ earners (296,308) having the highest median family income of $143,356, while families with no earners (436,710) have the lowest median family income of $51,877, accounting for 11.7% and 17.3% of families, respectively.
| Number of Earners | # Families | Median Income |
| No Earners | 436,710 (17.3%) | $51,877 |
| 1 Earner | 801,403 (31.7%) | $62,323 |
| 2 Earners | 993,491 (39.3%) | $111,912 |
| 3+ Earners | 296,308 (11.7%) | $143,356 |
| Total | 2,527,912 (100.0%) | $87,221 |
Household Income in Michigan
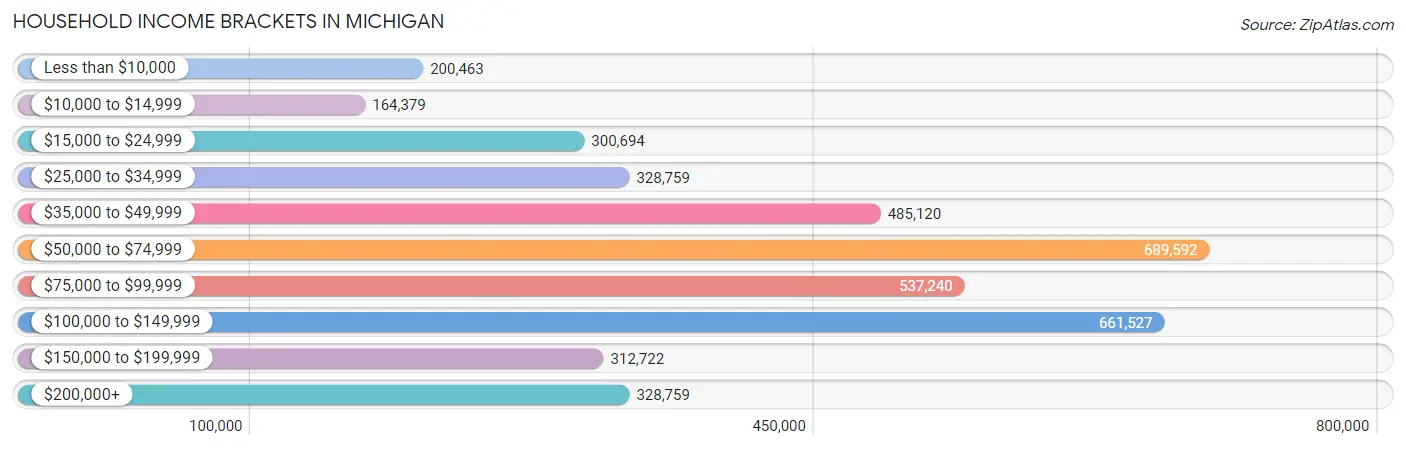
Household Income Brackets in Michigan
With 689,592 households falling in the category, the $50,000 to $74,999 income range is the most frequent in Michigan, accounting for 17.2% of all households. In contrast, only 164,379 households (4.1%) fall into the $10,000 to $14,999 income bracket, making it the least populous group.
| Income Bracket | # Households | % Households |
| Less than $10,000 | 200,463 | 5.0% |
| $10,000 to $14,999 | 164,379 | 4.1% |
| $15,000 to $24,999 | 300,694 | 7.5% |
| $25,000 to $34,999 | 328,759 | 8.2% |
| $35,000 to $49,999 | 485,120 | 12.1% |
| $50,000 to $74,999 | 689,592 | 17.2% |
| $75,000 to $99,999 | 537,240 | 13.4% |
| $100,000 to $149,999 | 661,527 | 16.5% |
| $150,000 to $199,999 | 312,722 | 7.8% |
| $200,000+ | 328,759 | 8.2% |
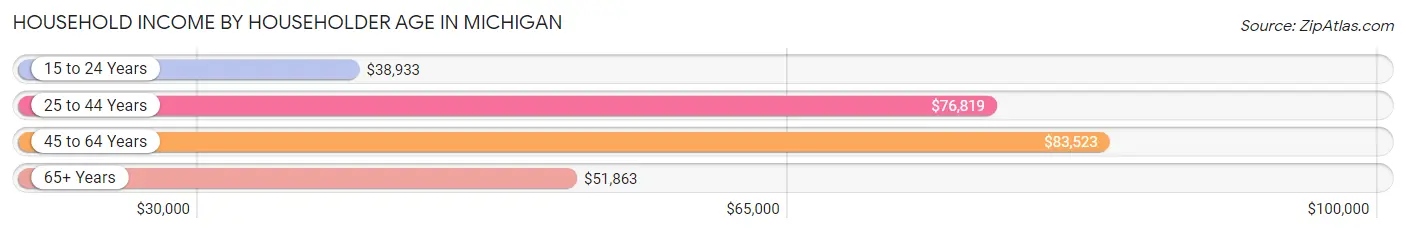
Household Income by Householder Age in Michigan
The median household income in Michigan is $68,505, with the highest median household income of $83,523 found in the 45 to 64 years age bracket for the primary householder. A total of 1,506,327 households (37.6%) fall into this category. Meanwhile, the 15 to 24 years age bracket for the primary householder has the lowest median household income of $38,933, with 160,861 households (4.0%) in this group.
| Income Bracket | # Households | Median Income |
| 15 to 24 Years | 160,861 (4.0%) | $38,933 |
| 25 to 44 Years | 1,202,405 (30.0%) | $76,819 |
| 45 to 64 Years | 1,506,327 (37.6%) | $83,523 |
| 65+ Years | 1,139,660 (28.4%) | $51,863 |
| Total | 4,009,253 (100.0%) | $68,505 |
Poverty in Michigan
Income Below Poverty by Sex and Age in Michigan
With 12.0% poverty level for males and 14.3% for females among the residents of Michigan, under 5 year old males and 18 to 24 year old females are the most vulnerable to poverty, with 56,545 males (20.3%) and 100,644 females (23.3%) in their respective age groups living below the poverty level.
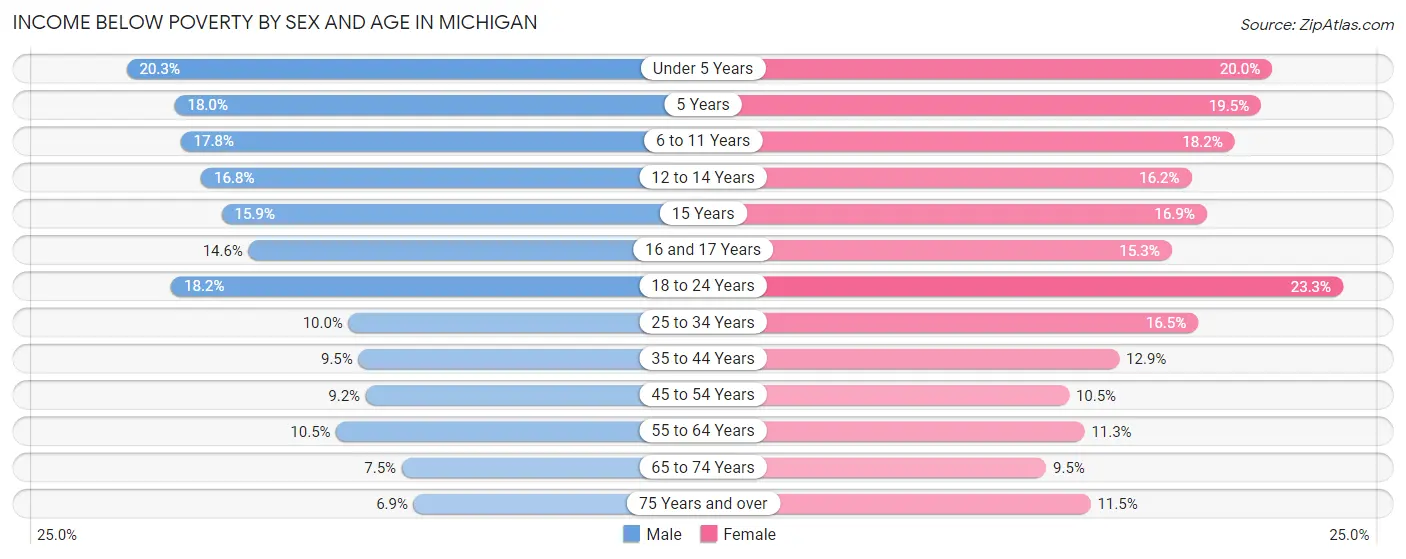
| Age Bracket | Male | Female |
| Under 5 Years | 56,545 (20.3%) | 52,977 (20.0%) |
| 5 Years | 10,680 (18.0%) | 10,819 (19.5%) |
| 6 to 11 Years | 63,595 (17.8%) | 62,007 (18.2%) |
| 12 to 14 Years | 32,070 (16.8%) | 29,295 (16.2%) |
| 15 Years | 10,808 (15.9%) | 10,559 (16.9%) |
| 16 and 17 Years | 19,008 (14.6%) | 19,221 (15.3%) |
| 18 to 24 Years | 83,195 (18.2%) | 100,644 (23.3%) |
| 25 to 34 Years | 64,790 (10.0%) | 105,106 (16.5%) |
| 35 to 44 Years | 56,091 (9.5%) | 76,046 (12.9%) |
| 45 to 54 Years | 56,396 (9.2%) | 65,645 (10.5%) |
| 55 to 64 Years | 71,686 (10.5%) | 79,359 (11.3%) |
| 65 to 74 Years | 37,690 (7.5%) | 52,620 (9.5%) |
| 75 Years and over | 19,993 (6.9%) | 46,319 (11.5%) |
| Total | 582,547 (12.0%) | 710,617 (14.3%) |
Income Above Poverty by Sex and Age in Michigan
According to the poverty statistics in Michigan, males aged 75 years and over and females aged 65 to 74 years are the age groups that are most secure financially, with 93.1% of males and 90.5% of females in these age groups living above the poverty line.
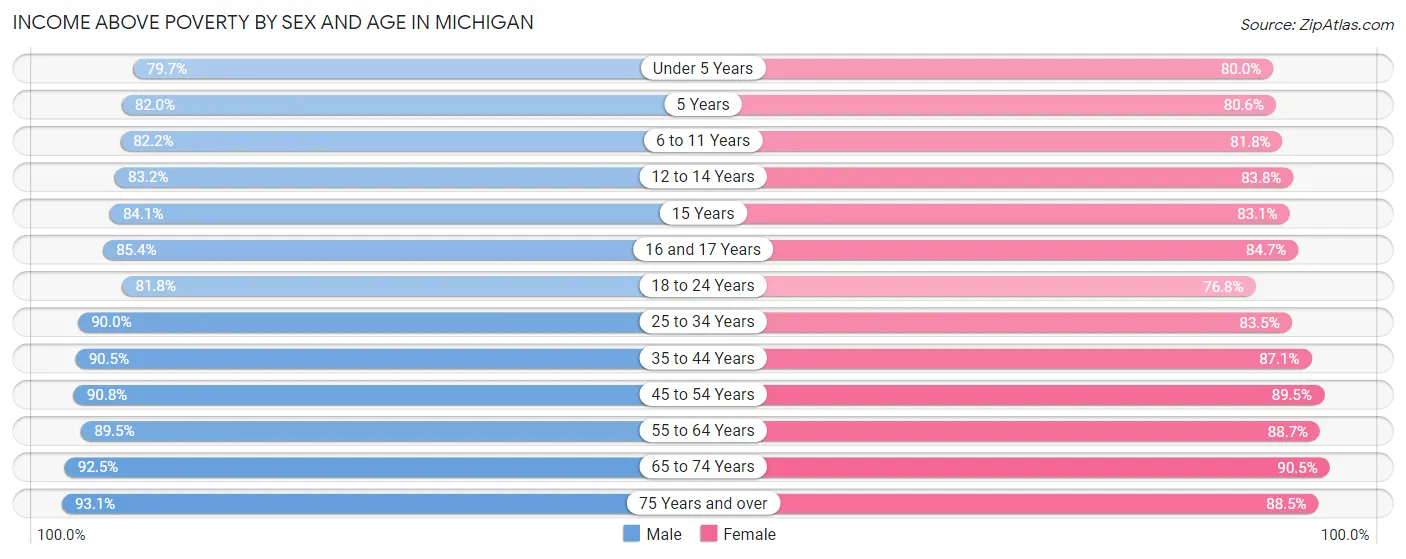
| Age Bracket | Male | Female |
| Under 5 Years | 222,421 (79.7%) | 212,416 (80.0%) |
| 5 Years | 48,506 (82.0%) | 44,797 (80.5%) |
| 6 to 11 Years | 294,483 (82.2%) | 278,304 (81.8%) |
| 12 to 14 Years | 158,754 (83.2%) | 151,284 (83.8%) |
| 15 Years | 57,348 (84.1%) | 51,813 (83.1%) |
| 16 and 17 Years | 111,228 (85.4%) | 106,397 (84.7%) |
| 18 to 24 Years | 373,823 (81.8%) | 332,184 (76.7%) |
| 25 to 34 Years | 586,008 (90.0%) | 530,830 (83.5%) |
| 35 to 44 Years | 534,139 (90.5%) | 514,970 (87.1%) |
| 45 to 54 Years | 559,378 (90.8%) | 557,298 (89.5%) |
| 55 to 64 Years | 609,310 (89.5%) | 625,586 (88.7%) |
| 65 to 74 Years | 465,497 (92.5%) | 502,340 (90.5%) |
| 75 Years and over | 268,030 (93.1%) | 354,934 (88.5%) |
| Total | 4,288,925 (88.0%) | 4,263,153 (85.7%) |
Income Below Poverty Among Married-Couple Families in Michigan
The poverty statistics for married-couple families in Michigan show that 4.2% or 77,626 of the total 1,864,083 families live below the poverty line. Families with 5 or more children have the highest poverty rate of 24.8%, comprising of 3,720 families. On the other hand, families with no children have the lowest poverty rate of 3.1%, which includes 35,498 families.
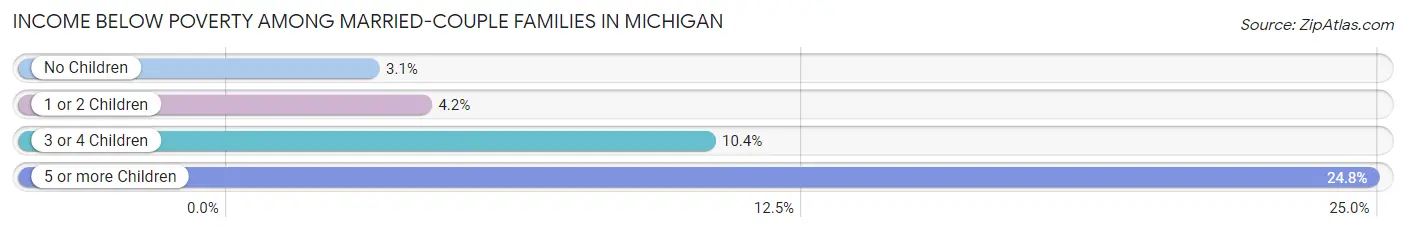
| Children | Above Poverty | Below Poverty |
| No Children | 1,119,324 (96.9%) | 35,498 (3.1%) |
| 1 or 2 Children | 522,564 (95.8%) | 22,965 (4.2%) |
| 3 or 4 Children | 133,305 (89.6%) | 15,443 (10.4%) |
| 5 or more Children | 11,264 (75.2%) | 3,720 (24.8%) |
| Total | 1,786,457 (95.8%) | 77,626 (4.2%) |
Income Below Poverty Among Single-Parent Households in Michigan
According to the poverty data in Michigan, 13.1% or 25,707 single-father households and 25.4% or 118,699 single-mother households are living below the poverty line. Among single-father households, those with 5 or more children have the highest poverty rate, with 523 households (42.1%) experiencing poverty. Likewise, among single-mother households, those with 5 or more children have the highest poverty rate, with 4,174 households (74.2%) falling below the poverty line.
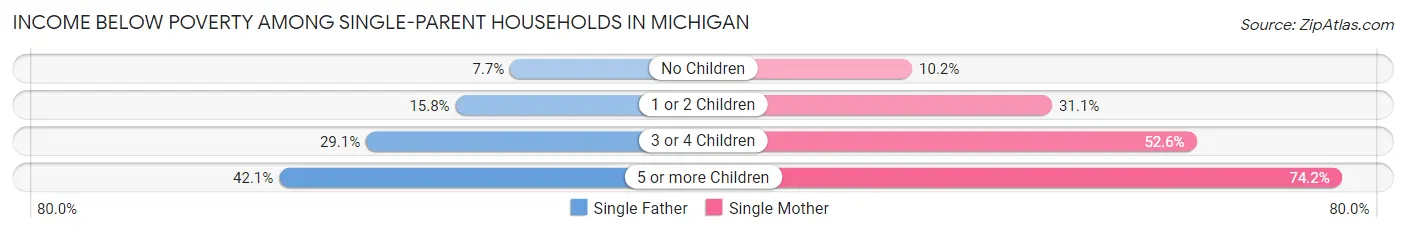
| Children | Single Father | Single Mother |
| No Children | 6,965 (7.6%) | 19,119 (10.2%) |
| 1 or 2 Children | 14,294 (15.8%) | 70,713 (31.1%) |
| 3 or 4 Children | 3,925 (29.1%) | 24,693 (52.6%) |
| 5 or more Children | 523 (42.1%) | 4,174 (74.2%) |
| Total | 25,707 (13.1%) | 118,699 (25.4%) |
Income Below Poverty Among Married-Couple vs Single-Parent Households in Michigan
The poverty data for Michigan shows that 77,626 of the married-couple family households (4.2%) and 144,406 of the single-parent households (21.7%) are living below the poverty level. Within the married-couple family households, those with 5 or more children have the highest poverty rate, with 3,720 households (24.8%) falling below the poverty line. Among the single-parent households, those with 5 or more children have the highest poverty rate, with 4,697 household (68.4%) living below poverty.
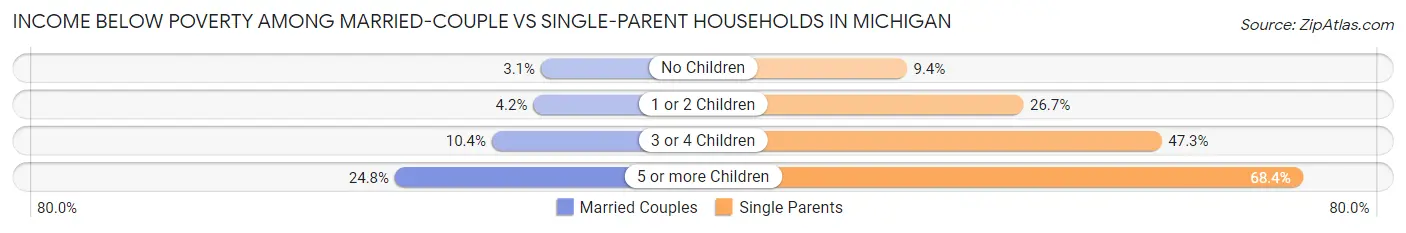
| Children | Married-Couple Families | Single-Parent Households |
| No Children | 35,498 (3.1%) | 26,084 (9.4%) |
| 1 or 2 Children | 22,965 (4.2%) | 85,007 (26.7%) |
| 3 or 4 Children | 15,443 (10.4%) | 28,618 (47.3%) |
| 5 or more Children | 3,720 (24.8%) | 4,697 (68.4%) |
| Total | 77,626 (4.2%) | 144,406 (21.7%) |
Largest Zip Codes by Population in Michigan
The largest zip codes in Michigan by population are 48197 (66,422), 48180 (62,937), 48044 (59,225), 48228 (54,670), and 48103 (54,563).
1.48197
66,422 (0.66%)
2.48180
62,937 (0.63%)
3.48044
59,225 (0.59%)
4.48228
54,670 (0.54%)
5.48103
54,563 (0.54%)
6.48126
53,044 (0.53%)
7.48187
52,861 (0.53%)
8.48439
52,012 (0.52%)
9.48823
49,713 (0.49%)
10.49201
49,509 (0.49%)
11.48185
48,622 (0.48%)
12.49424
48,493 (0.48%)
13.48066
47,476 (0.47%)
14.49009
47,139 (0.47%)
15.48843
46,734 (0.46%)
16.49423
46,467 (0.46%)
17.48235
45,529 (0.45%)
18.48188
45,390 (0.45%)
19.48104
45,161 (0.45%)
20.49442
45,137 (0.45%)
21.48219
44,595 (0.44%)
22.48038
44,255 (0.44%)
23.48111
44,169 (0.44%)
24.48307
43,799 (0.44%)
25.48310
43,232 (0.43%)
26.48212
43,213 (0.43%)
27.48858
43,036 (0.43%)
28.49508
42,515 (0.42%)
29.48183
42,467 (0.42%)
30.48221
41,570 (0.41%)
Largest Cities by Population in Michigan
The largest cities in Michigan by population are Detroit (636,787), Grand Rapids (198,096), Warren (138,588), Sterling Heights (133,744), and Ann Arbor (122,216).
1.Detroit
636,787 (6.33%)
198,096 (1.97%)
3.Warren
138,588 (1.38%)
133,744 (1.33%)
122,216 (1.22%)
6.Lansing
112,986 (1.12%)
7.Dearborn
108,414 (1.08%)
8.Livonia
94,928 (0.94%)
9.Troy
87,170 (0.87%)
10.Westland
84,806 (0.84%)
83,562 (0.83%)
12.Flint
81,863 (0.81%)
13.Wyoming
76,732 (0.76%)
14.Southfield
76,107 (0.76%)
76,041 (0.76%)
16.Kalamazoo
73,342 (0.73%)
17.Novi
65,870 (0.65%)
18.Taylor
62,937 (0.63%)
62,474 (0.62%)
20.Pontiac
61,965 (0.62%)
58,656 (0.58%)
22.Royal Oak
58,053 (0.58%)
23.Kentwood
54,042 (0.54%)
24.Battle Creek
52,469 (0.52%)
25.Portage
48,936 (0.49%)
26.Roseville
47,476 (0.47%)
27.East Lansing
45,403 (0.45%)
28.Saginaw
44,316 (0.44%)
29.Midland
42,404 (0.42%)
30.Lincoln Park
39,807 (0.40%)
Largest Counties by Population in Michigan
The largest counties in Michigan by population are Wayne County (1,781,641), Oakland County (1,272,264), Macomb County (878,453), Kent County (657,321), and Genesee County (405,280).
1,781,641 (17.71%)
1,272,264 (12.65%)
878,453 (8.73%)
657,321 (6.54%)
405,280 (4.03%)
370,231 (3.68%)
296,183 (2.94%)
282,540 (2.81%)
261,426 (2.60%)
194,302 (1.93%)
189,821 (1.89%)
175,947 (1.75%)
160,637 (1.60%)
160,257 (1.59%)
154,823 (1.54%)
153,938 (1.53%)
134,011 (1.33%)
120,189 (1.19%)
19.Eaton County
109,072 (1.08%)
20.Bay County
103,752 (1.03%)
99,263 (0.99%)
95,315 (0.95%)
88,687 (0.88%)
83,503 (0.83%)
79,249 (0.79%)
75,636 (0.75%)
68,124 (0.68%)
66,901 (0.67%)
29.Ionia County
66,663 (0.66%)
66,376 (0.66%)
Race in Michigan
The most populous races in Michigan are White / Caucasian (7,617,085 | 75.7%), Black / African American (1,363,539 | 13.6%), and Hispanic or Latino (550,427 | 5.5%).
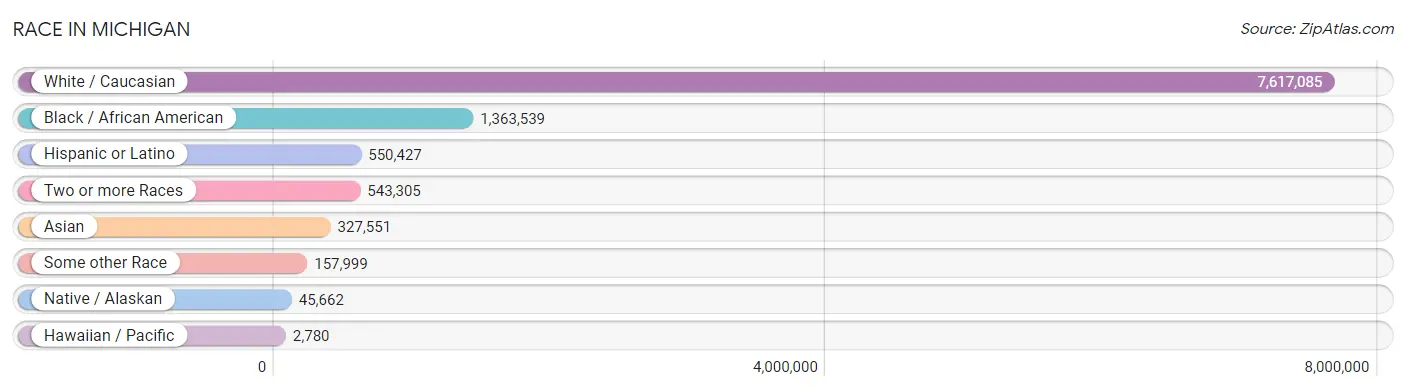
| Race | # Population | % Population |
| Asian | 327,551 | 3.3% |
| Black / African American | 1,363,539 | 13.6% |
| Hawaiian / Pacific | 2,780 | 0.0% |
| Hispanic or Latino | 550,427 | 5.5% |
| Native / Alaskan | 45,662 | 0.4% |
| White / Caucasian | 7,617,085 | 75.7% |
| Two or more Races | 543,305 | 5.4% |
| Some other Race | 157,999 | 1.6% |
| Total | 10,057,921 | 100.0% |
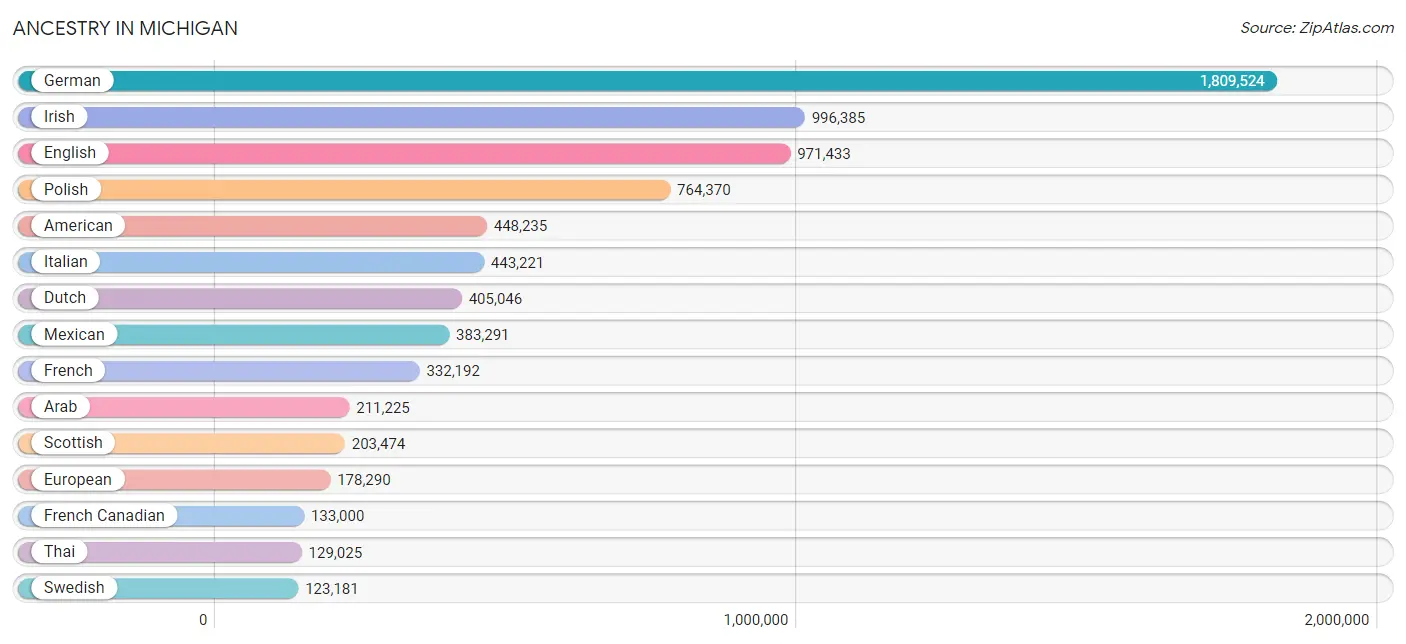
Ancestry in Michigan
The most populous ancestries reported in Michigan are German (1,809,524 | 18.0%), Irish (996,385 | 9.9%), English (971,433 | 9.7%), Polish (764,370 | 7.6%), and American (448,235 | 4.5%), together accounting for 49.6% of all Michigan residents.
| Ancestry | # Population | % Population |
| Afghan | 1,513 | 0.0% |
| African | 48,730 | 0.5% |
| Alaska Native | 156 | 0.0% |
| Alaskan Athabascan | 87 | 0.0% |
| Albanian | 26,197 | 0.3% |
| Aleut | 46 | 0.0% |
| Alsatian | 178 | 0.0% |
| American | 448,235 | 4.5% |
| Apache | 2,331 | 0.0% |
| Arab | 211,225 | 2.1% |
| Arapaho | 58 | 0.0% |
| Argentinean | 2,634 | 0.0% |
| Armenian | 12,740 | 0.1% |
| Assyrian / Chaldean / Syriac | 42,050 | 0.4% |
| Australian | 2,727 | 0.0% |
| Austrian | 19,267 | 0.2% |
| Bahamian | 709 | 0.0% |
| Bangladeshi | 7,768 | 0.1% |
| Barbadian | 247 | 0.0% |
| Basque | 248 | 0.0% |
| Belgian | 41,126 | 0.4% |
| Belizean | 356 | 0.0% |
| Bermudan | 72 | 0.0% |
| Bhutanese | 24,186 | 0.2% |
| Blackfeet | 7,922 | 0.1% |
| Bolivian | 450 | 0.0% |
| Brazilian | 5,469 | 0.1% |
| British | 45,986 | 0.5% |
| British West Indian | 433 | 0.0% |
| Bulgarian | 3,044 | 0.0% |
| Burmese | 39,176 | 0.4% |
| Cajun | 347 | 0.0% |
| Cambodian | 282 | 0.0% |
| Canadian | 37,188 | 0.4% |
| Cape Verdean | 130 | 0.0% |
| Carpatho Rusyn | 380 | 0.0% |
| Celtic | 1,581 | 0.0% |
| Central American | 29,570 | 0.3% |
| Central American Indian | 3,231 | 0.0% |
| Cherokee | 24,171 | 0.2% |
| Cheyenne | 146 | 0.0% |
| Chickasaw | 494 | 0.0% |
| Chilean | 1,669 | 0.0% |
| Chinese | 67 | 0.0% |
| Chippewa | 35,959 | 0.4% |
| Choctaw | 1,878 | 0.0% |
| Colombian | 7,435 | 0.1% |
| Colville | 80 | 0.0% |
| Comanche | 324 | 0.0% |
| Costa Rican | 1,834 | 0.0% |
| Cree | 360 | 0.0% |
| Creek | 996 | 0.0% |
| Croatian | 17,324 | 0.2% |
| Crow | 134 | 0.0% |
| Cuban | 17,038 | 0.2% |
| Cypriot | 512 | 0.0% |
| Czech | 40,340 | 0.4% |
| Czechoslovakian | 12,650 | 0.1% |
| Danish | 33,960 | 0.3% |
| Delaware | 188 | 0.0% |
| Dominican | 8,070 | 0.1% |
| Dutch | 405,046 | 4.0% |
| Dutch West Indian | 302 | 0.0% |
| Eastern European | 28,976 | 0.3% |
| Ecuadorian | 2,252 | 0.0% |
| Egyptian | 5,525 | 0.1% |
| English | 971,433 | 9.7% |
| Estonian | 565 | 0.0% |
| Ethiopian | 2,910 | 0.0% |
| European | 178,290 | 1.8% |
| Fijian | 30 | 0.0% |
| Filipino | 3,863 | 0.0% |
| Finnish | 87,968 | 0.9% |
| French | 332,192 | 3.3% |
| French American Indian | 2,861 | 0.0% |
| French Canadian | 133,000 | 1.3% |
| German | 1,809,524 | 18.0% |
| German Russian | 495 | 0.0% |
| Ghanaian | 1,502 | 0.0% |
| Greek | 42,706 | 0.4% |
| Guamanian / Chamorro | 1,469 | 0.0% |
| Guatemalan | 12,949 | 0.1% |
| Guyanese | 444 | 0.0% |
| Haitian | 3,888 | 0.0% |
| Hmong | 110 | 0.0% |
| Honduran | 5,756 | 0.1% |
| Hopi | 303 | 0.0% |
| Houma | 32 | 0.0% |
| Hungarian | 80,919 | 0.8% |
| Icelander | 920 | 0.0% |
| Indian (Asian) | 68,398 | 0.7% |
| Indonesian | 5,230 | 0.1% |
| Inupiat | 146 | 0.0% |
| Iranian | 4,716 | 0.1% |
| Iraqi | 37,036 | 0.4% |
| Irish | 996,385 | 9.9% |
| Iroquois | 2,780 | 0.0% |
| Israeli | 2,636 | 0.0% |
| Italian | 443,221 | 4.4% |
| Jamaican | 9,825 | 0.1% |
| Japanese | 3,254 | 0.0% |
| Jordanian | 5,144 | 0.1% |
| Kenyan | 1,271 | 0.0% |
| Kiowa | 73 | 0.0% |
| Korean | 44,148 | 0.4% |
| Laotian | 2,238 | 0.0% |
| Latvian | 3,594 | 0.0% |
| Lebanese | 69,798 | 0.7% |
| Liberian | 2,448 | 0.0% |
| Lithuanian | 28,794 | 0.3% |
| Lumbee | 921 | 0.0% |
| Luxembourger | 781 | 0.0% |
| Macedonian | 12,825 | 0.1% |
| Malaysian | 4,496 | 0.0% |
| Maltese | 12,843 | 0.1% |
| Menominee | 253 | 0.0% |
| Mexican | 383,291 | 3.8% |
| Mexican American Indian | 5,967 | 0.1% |
| Mongolian | 687 | 0.0% |
| Moroccan | 3,093 | 0.0% |
| Native Hawaiian | 3,965 | 0.0% |
| Navajo | 1,443 | 0.0% |
| Nepalese | 8 | 0.0% |
| New Zealander | 277 | 0.0% |
| Nicaraguan | 1,397 | 0.0% |
| Nigerian | 10,457 | 0.1% |
| Northern European | 12,269 | 0.1% |
| Norwegian | 76,130 | 0.8% |
| Okinawan | 169 | 0.0% |
| Osage | 105 | 0.0% |
| Ottawa | 6,930 | 0.1% |
| Paiute | 40 | 0.0% |
| Pakistani | 5,035 | 0.1% |
| Palestinian | 6,176 | 0.1% |
| Panamanian | 2,480 | 0.0% |
| Paraguayan | 241 | 0.0% |
| Pennsylvania German | 6,085 | 0.1% |
| Peruvian | 3,711 | 0.0% |
| Pima | 133 | 0.0% |
| Polish | 764,370 | 7.6% |
| Portuguese | 6,363 | 0.1% |
| Potawatomi | 5,843 | 0.1% |
| Pueblo | 314 | 0.0% |
| Puerto Rican | 50,912 | 0.5% |
| Puget Sound Salish | 60 | 0.0% |
| Romanian | 25,458 | 0.3% |
| Russian | 57,039 | 0.6% |
| Salvadoran | 5,095 | 0.1% |
| Samoan | 1,750 | 0.0% |
| Scandinavian | 25,976 | 0.3% |
| Scotch-Irish | 65,172 | 0.6% |
| Scottish | 203,474 | 2.0% |
| Seminole | 511 | 0.0% |
| Senegalese | 571 | 0.0% |
| Serbian | 9,236 | 0.1% |
| Shoshone | 153 | 0.0% |
| Sierra Leonean | 403 | 0.0% |
| Sioux | 2,308 | 0.0% |
| Slavic | 5,354 | 0.1% |
| Slovak | 21,248 | 0.2% |
| Slovene | 4,079 | 0.0% |
| Somali | 1,385 | 0.0% |
| South African | 1,290 | 0.0% |
| South American | 22,072 | 0.2% |
| South American Indian | 700 | 0.0% |
| Soviet Union | 265 | 0.0% |
| Spaniard | 9,222 | 0.1% |
| Spanish | 10,704 | 0.1% |
| Spanish American | 450 | 0.0% |
| Spanish American Indian | 35 | 0.0% |
| Sri Lankan | 24,230 | 0.2% |
| Subsaharan African | 82,845 | 0.8% |
| Sudanese | 2,848 | 0.0% |
| Swedish | 123,181 | 1.2% |
| Swiss | 22,799 | 0.2% |
| Syrian | 12,157 | 0.1% |
| Thai | 129,025 | 1.3% |
| Tlingit-Haida | 95 | 0.0% |
| Tohono O'Odham | 67 | 0.0% |
| Tongan | 32 | 0.0% |
| Trinidadian and Tobagonian | 1,075 | 0.0% |
| Tsimshian | 11 | 0.0% |
| Turkish | 2,936 | 0.0% |
| U.S. Virgin Islander | 69 | 0.0% |
| Ugandan | 458 | 0.0% |
| Ukrainian | 37,992 | 0.4% |
| Uruguayan | 235 | 0.0% |
| Ute | 10 | 0.0% |
| Venezuelan | 3,107 | 0.0% |
| Vietnamese | 15,306 | 0.2% |
| Welsh | 43,684 | 0.4% |
| West Indian | 1,415 | 0.0% |
| Yakama | 32 | 0.0% |
| Yaqui | 236 | 0.0% |
| Yugoslavian | 14,489 | 0.1% |
| Yuman | 4 | 0.0% |
| Yup'ik | 63 | 0.0% |
| Zimbabwean | 291 | 0.0% | View All 198 Rows |
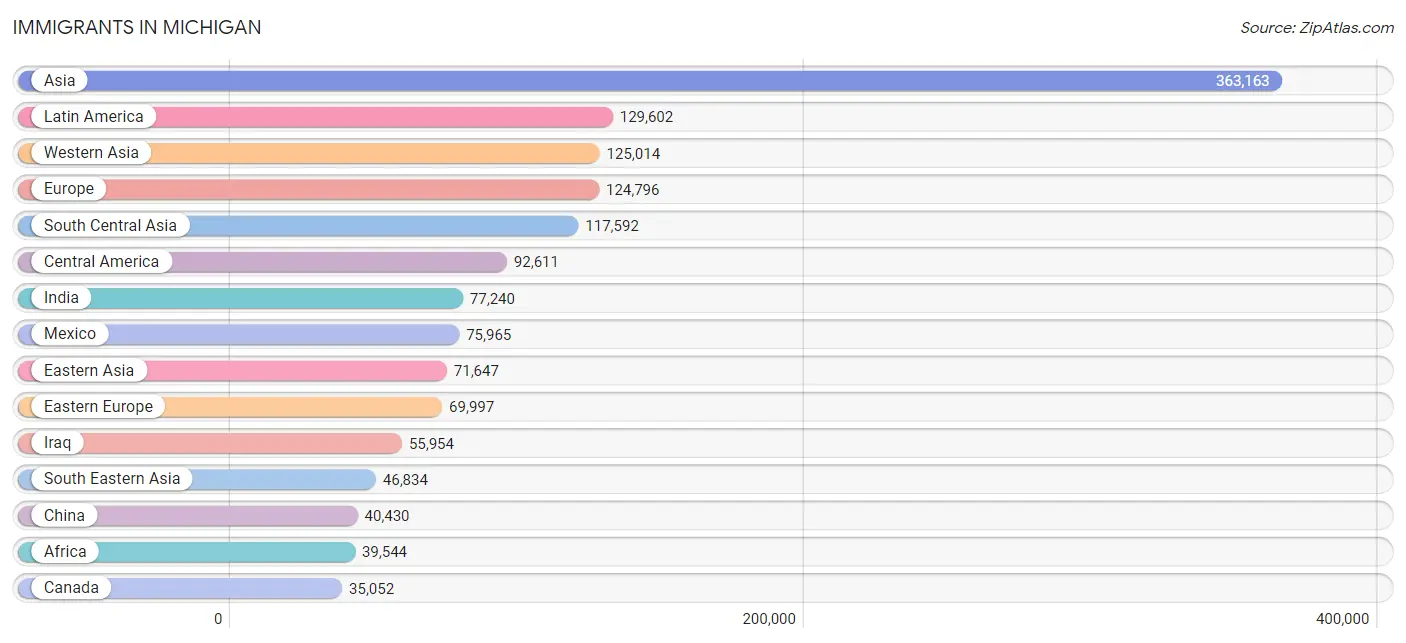
Immigrants in Michigan
The most numerous immigrant groups reported in Michigan came from Asia (363,163 | 3.6%), Latin America (129,602 | 1.3%), Western Asia (125,014 | 1.2%), Europe (124,796 | 1.2%), and South Central Asia (117,592 | 1.2%), together accounting for 8.6% of all Michigan residents.
| Immigration Origin | # Population | % Population |
| Afghanistan | 1,173 | 0.0% |
| Africa | 39,544 | 0.4% |
| Albania | 12,910 | 0.1% |
| Argentina | 1,346 | 0.0% |
| Armenia | 517 | 0.0% |
| Asia | 363,163 | 3.6% |
| Australia | 1,695 | 0.0% |
| Austria | 1,144 | 0.0% |
| Azores | 30 | 0.0% |
| Bahamas | 302 | 0.0% |
| Bangladesh | 18,065 | 0.2% |
| Barbados | 74 | 0.0% |
| Belarus | 535 | 0.0% |
| Belgium | 699 | 0.0% |
| Belize | 225 | 0.0% |
| Bolivia | 181 | 0.0% |
| Bosnia and Herzegovina | 6,009 | 0.1% |
| Brazil | 7,485 | 0.1% |
| Bulgaria | 1,248 | 0.0% |
| Cabo Verde | 4 | 0.0% |
| Cambodia | 1,657 | 0.0% |
| Cameroon | 918 | 0.0% |
| Canada | 35,052 | 0.4% |
| Caribbean | 18,054 | 0.2% |
| Central America | 92,611 | 0.9% |
| Chile | 894 | 0.0% |
| China | 40,430 | 0.4% |
| Colombia | 3,969 | 0.0% |
| Congo | 963 | 0.0% |
| Costa Rica | 1,062 | 0.0% |
| Croatia | 670 | 0.0% |
| Cuba | 6,481 | 0.1% |
| Czechoslovakia | 1,437 | 0.0% |
| Denmark | 513 | 0.0% |
| Dominica | 28 | 0.0% |
| Dominican Republic | 3,489 | 0.0% |
| Eastern Africa | 11,065 | 0.1% |
| Eastern Asia | 71,647 | 0.7% |
| Eastern Europe | 69,997 | 0.7% |
| Ecuador | 988 | 0.0% |
| Egypt | 3,827 | 0.0% |
| El Salvador | 2,977 | 0.0% |
| England | 6,424 | 0.1% |
| Eritrea | 550 | 0.0% |
| Ethiopia | 1,985 | 0.0% |
| Europe | 124,796 | 1.2% |
| Fiji | 51 | 0.0% |
| France | 2,568 | 0.0% |
| Germany | 16,126 | 0.2% |
| Ghana | 1,811 | 0.0% |
| Greece | 2,721 | 0.0% |
| Grenada | 6 | 0.0% |
| Guatemala | 7,097 | 0.1% |
| Guyana | 401 | 0.0% |
| Haiti | 1,481 | 0.0% |
| Honduras | 3,798 | 0.0% |
| Hong Kong | 1,685 | 0.0% |
| Hungary | 873 | 0.0% |
| India | 77,240 | 0.8% |
| Indonesia | 1,184 | 0.0% |
| Iran | 4,245 | 0.0% |
| Iraq | 55,954 | 0.6% |
| Ireland | 1,159 | 0.0% |
| Israel | 1,942 | 0.0% |
| Italy | 7,792 | 0.1% |
| Jamaica | 4,645 | 0.1% |
| Japan | 10,225 | 0.1% |
| Jordan | 4,939 | 0.1% |
| Kazakhstan | 529 | 0.0% |
| Kenya | 1,965 | 0.0% |
| Korea | 20,884 | 0.2% |
| Kuwait | 1,324 | 0.0% |
| Laos | 3,027 | 0.0% |
| Latin America | 129,602 | 1.3% |
| Latvia | 805 | 0.0% |
| Lebanon | 25,634 | 0.3% |
| Liberia | 1,679 | 0.0% |
| Lithuania | 854 | 0.0% |
| Malaysia | 1,331 | 0.0% |
| Mexico | 75,965 | 0.8% |
| Micronesia | 221 | 0.0% |
| Middle Africa | 3,833 | 0.0% |
| Moldova | 390 | 0.0% |
| Morocco | 1,406 | 0.0% |
| Nepal | 2,853 | 0.0% |
| Netherlands | 3,681 | 0.0% |
| Nicaragua | 624 | 0.0% |
| Nigeria | 5,964 | 0.1% |
| North Macedonia | 3,931 | 0.0% |
| Northern Africa | 8,964 | 0.1% |
| Northern Europe | 16,611 | 0.2% |
| Norway | 342 | 0.0% |
| Oceania | 2,684 | 0.0% |
| Pakistan | 10,596 | 0.1% |
| Panama | 833 | 0.0% |
| Peru | 1,298 | 0.0% |
| Philippines | 19,112 | 0.2% |
| Poland | 10,857 | 0.1% |
| Portugal | 307 | 0.0% |
| Romania | 8,563 | 0.1% |
| Russia | 6,326 | 0.1% |
| Saudi Arabia | 3,074 | 0.0% |
| Scotland | 1,597 | 0.0% |
| Senegal | 757 | 0.0% |
| Serbia | 1,030 | 0.0% |
| Sierra Leone | 861 | 0.0% |
| Singapore | 464 | 0.0% |
| Somalia | 1,042 | 0.0% |
| South Africa | 1,677 | 0.0% |
| South America | 18,937 | 0.2% |
| South Central Asia | 117,592 | 1.2% |
| South Eastern Asia | 46,834 | 0.5% |
| Southern Europe | 13,176 | 0.1% |
| Spain | 1,381 | 0.0% |
| Sri Lanka | 1,092 | 0.0% |
| St. Vincent and the Grenadines | 58 | 0.0% |
| Sudan | 1,860 | 0.0% |
| Sweden | 751 | 0.0% |
| Switzerland | 406 | 0.0% |
| Syria | 5,978 | 0.1% |
| Taiwan | 4,450 | 0.0% |
| Thailand | 3,080 | 0.0% |
| Trinidad and Tobago | 1,188 | 0.0% |
| Turkey | 1,569 | 0.0% |
| Uganda | 835 | 0.0% |
| Ukraine | 6,829 | 0.1% |
| Uruguay | 253 | 0.0% |
| Uzbekistan | 867 | 0.0% |
| Venezuela | 1,871 | 0.0% |
| Vietnam | 12,679 | 0.1% |
| West Indies | 28 | 0.0% |
| Western Africa | 12,239 | 0.1% |
| Western Asia | 125,014 | 1.2% |
| Western Europe | 24,658 | 0.3% |
| Yemen | 21,538 | 0.2% |
| Zaire | 1,416 | 0.0% |
| Zimbabwe | 454 | 0.0% | View All 137 Rows |
Sex and Age in Michigan
Sex and Age in Michigan
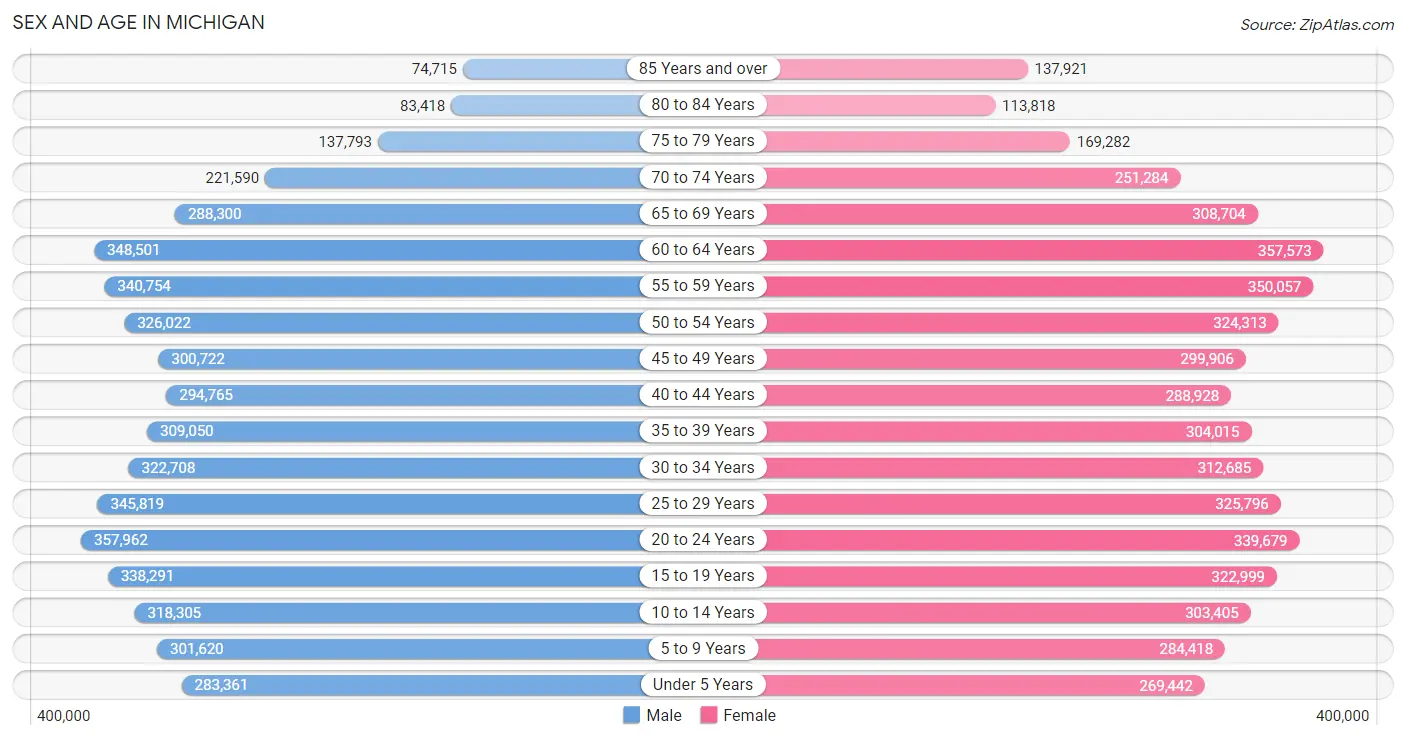
The most populous age groups in Michigan are 20 to 24 Years (357,962 | 7.2%) for men and 60 to 64 Years (357,573 | 7.1%) for women.
| Age Bracket | Male | Female |
| Under 5 Years | 283,361 (5.7%) | 269,442 (5.3%) |
| 5 to 9 Years | 301,620 (6.0%) | 284,418 (5.6%) |
| 10 to 14 Years | 318,305 (6.4%) | 303,405 (6.0%) |
| 15 to 19 Years | 338,291 (6.8%) | 322,999 (6.4%) |
| 20 to 24 Years | 357,962 (7.2%) | 339,679 (6.7%) |
| 25 to 29 Years | 345,819 (6.9%) | 325,796 (6.4%) |
| 30 to 34 Years | 322,708 (6.5%) | 312,685 (6.2%) |
| 35 to 39 Years | 309,050 (6.2%) | 304,015 (6.0%) |
| 40 to 44 Years | 294,765 (5.9%) | 288,928 (5.7%) |
| 45 to 49 Years | 300,722 (6.0%) | 299,906 (5.9%) |
| 50 to 54 Years | 326,022 (6.5%) | 324,313 (6.4%) |
| 55 to 59 Years | 340,754 (6.8%) | 350,057 (6.9%) |
| 60 to 64 Years | 348,501 (7.0%) | 357,573 (7.1%) |
| 65 to 69 Years | 288,300 (5.8%) | 308,704 (6.1%) |
| 70 to 74 Years | 221,590 (4.4%) | 251,284 (5.0%) |
| 75 to 79 Years | 137,793 (2.8%) | 169,282 (3.3%) |
| 80 to 84 Years | 83,418 (1.7%) | 113,818 (2.2%) |
| 85 Years and over | 74,715 (1.5%) | 137,921 (2.7%) |
| Total | 4,993,696 (100.0%) | 5,064,225 (100.0%) |
Families and Households in Michigan
Median Family Size in Michigan
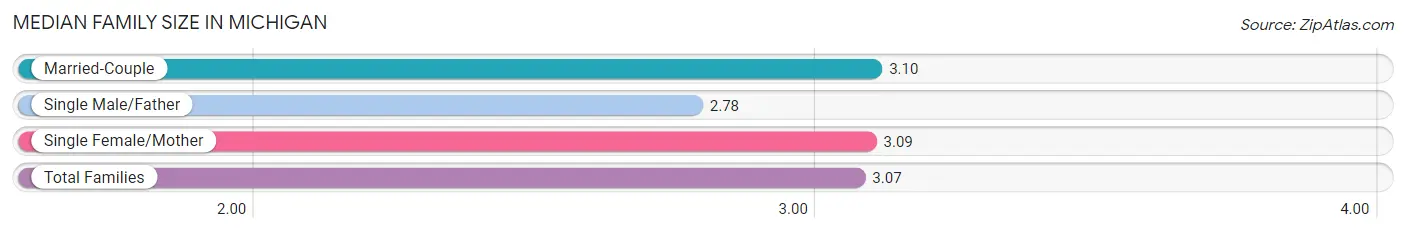
The median family size in Michigan is 3.07 persons per family, with married-couple families (1,864,083 | 73.7%) accounting for the largest median family size of 3.1 persons per family. On the other hand, single male/father families (196,199 | 7.8%) represent the smallest median family size with 2.78 persons per family.
| Family Type | # Families | Family Size |
| Married-Couple | 1,864,083 (73.7%) | 3.10 |
| Single Male/Father | 196,199 (7.8%) | 2.78 |
| Single Female/Mother | 467,630 (18.5%) | 3.09 |
| Total Families | 2,527,912 (100.0%) | 3.07 |
Median Household Size in Michigan
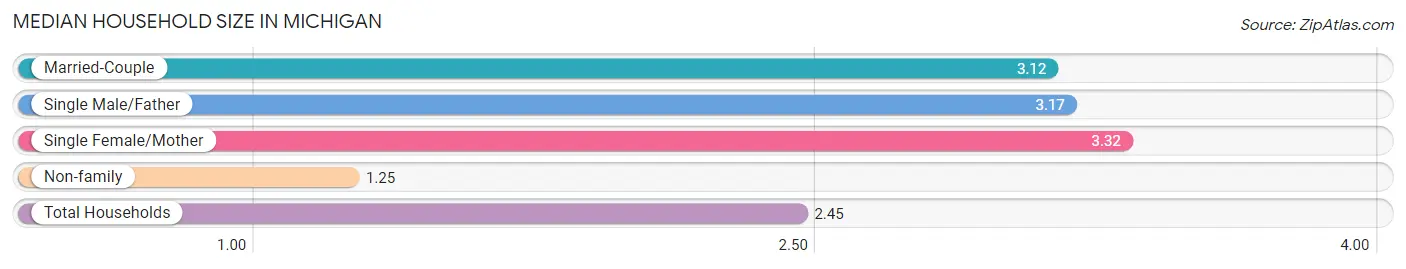
The median household size in Michigan is 2.45 persons per household, with single female/mother households (467,630 | 11.7%) accounting for the largest median household size of 3.32 persons per household. non-family households (1,481,341 | 36.9%) represent the smallest median household size with 1.25 persons per household.
| Household Type | # Households | Household Size |
| Married-Couple | 1,864,083 (46.5%) | 3.12 |
| Single Male/Father | 196,199 (4.9%) | 3.17 |
| Single Female/Mother | 467,630 (11.7%) | 3.32 |
| Non-family | 1,481,341 (36.9%) | 1.25 |
| Total Households | 4,009,253 (100.0%) | 2.45 |
Household Size by Marriage Status in Michigan
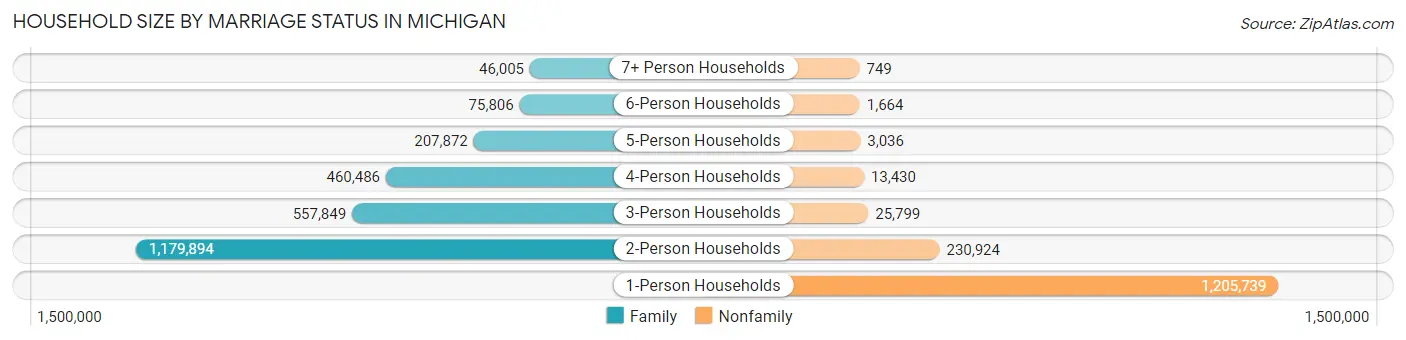
Out of a total of 4,009,253 households in Michigan, 2,527,912 (63.0%) are family households, while 1,481,341 (36.9%) are nonfamily households. The most numerous type of family households are 2-person households, comprising 1,179,894, and the most common type of nonfamily households are 1-person households, comprising 1,205,739.
| Household Size | Family Households | Nonfamily Households |
| 1-Person Households | - | 1,205,739 (30.1%) |
| 2-Person Households | 1,179,894 (29.4%) | 230,924 (5.8%) |
| 3-Person Households | 557,849 (13.9%) | 25,799 (0.6%) |
| 4-Person Households | 460,486 (11.5%) | 13,430 (0.3%) |
| 5-Person Households | 207,872 (5.2%) | 3,036 (0.1%) |
| 6-Person Households | 75,806 (1.9%) | 1,664 (0.0%) |
| 7+ Person Households | 46,005 (1.1%) | 749 (0.0%) |
| Total | 2,527,912 (63.0%) | 1,481,341 (36.9%) |
Female Fertility in Michigan
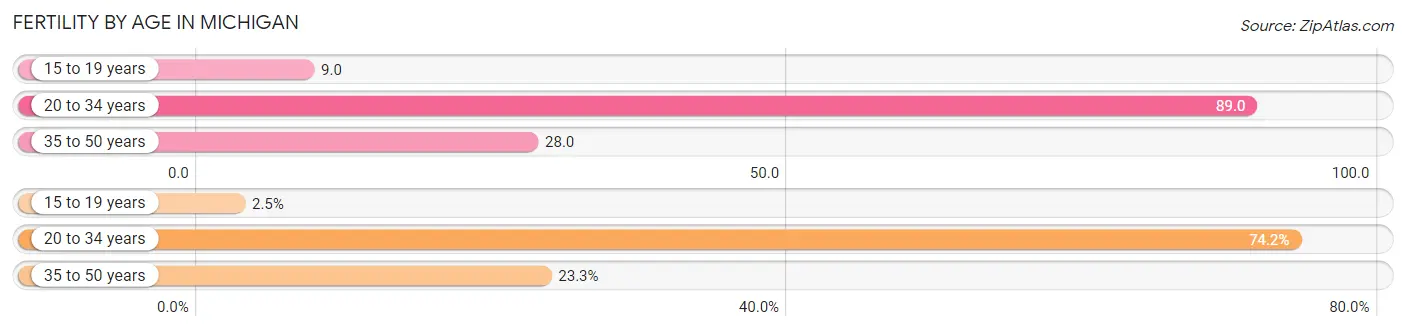
Fertility by Age in Michigan
Average fertility rate in Michigan is 52.0 births per 1,000 women. Women in the age bracket of 20 to 34 years have the highest fertility rate with 89.0 births per 1,000 women. Women in the age bracket of 20 to 34 years acount for 74.2% of all women with births.
| Age Bracket | Women with Births | Births / 1,000 Women |
| 15 to 19 years | 2,935 (2.5%) | 9.0 |
| 20 to 34 years | 86,708 (74.2%) | 89.0 |
| 35 to 50 years | 27,225 (23.3%) | 28.0 |
| Total | 116,868 (100.0%) | 52.0 |
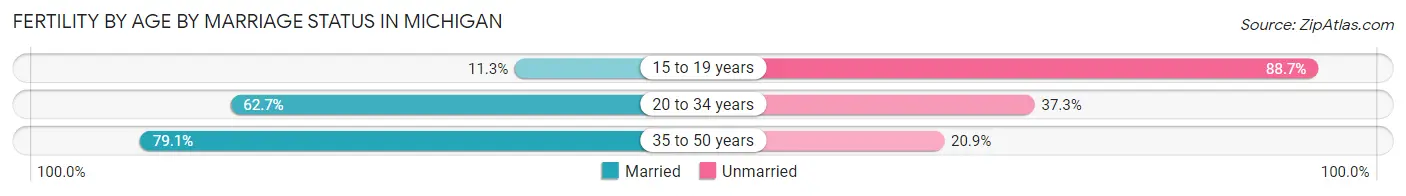
Fertility by Age by Marriage Status in Michigan
65.2% of women with births (116,868) in Michigan are married. The highest percentage of unmarried women with births falls into 15 to 19 years age bracket with 88.7% of them unmarried at the time of birth, while the lowest percentage of unmarried women with births belong to 35 to 50 years age bracket with 20.9% of them unmarried.
| Age Bracket | Married | Unmarried |
| 15 to 19 years | 332 (11.3%) | 2,603 (88.7%) |
| 20 to 34 years | 54,366 (62.7%) | 32,342 (37.3%) |
| 35 to 50 years | 21,535 (79.1%) | 5,690 (20.9%) |
| Total | 76,198 (65.2%) | 40,670 (34.8%) |
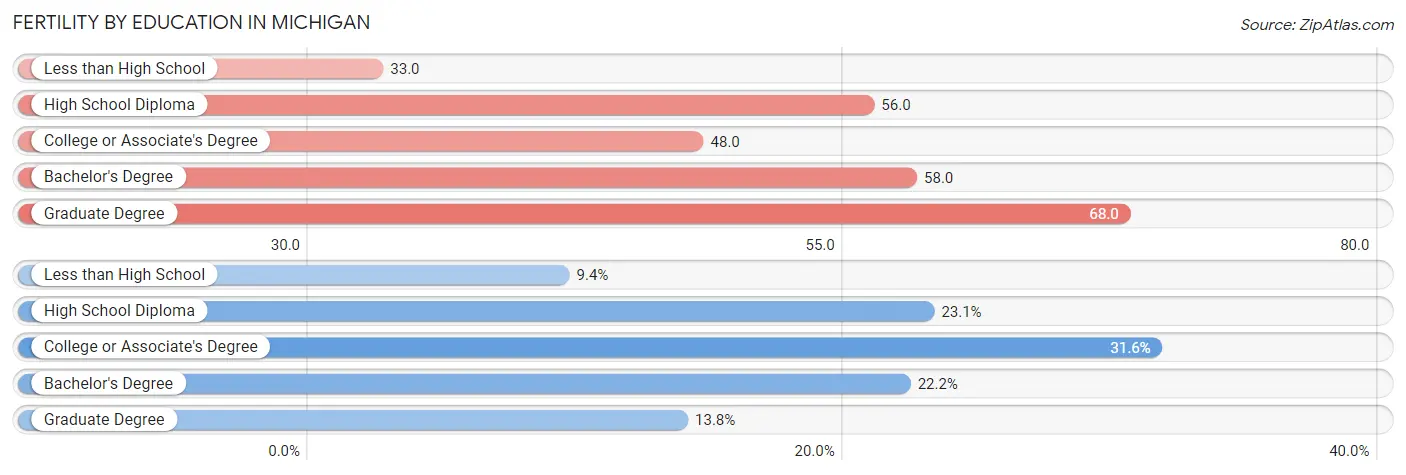
Fertility by Education in Michigan
Average fertility rate in Michigan is 52.0 births per 1,000 women. Women with the education attainment of graduate degree have the highest fertility rate of 68.0 births per 1,000 women, while women with the education attainment of less than high school have the lowest fertility at 33.0 births per 1,000 women. Women with the education attainment of college or associate's degree represent 31.6% of all women with births.
| Educational Attainment | Women with Births | Births / 1,000 Women |
| Less than High School | 10,968 (9.4%) | 33.0 |
| High School Diploma | 26,941 (23.1%) | 56.0 |
| College or Associate's Degree | 36,917 (31.6%) | 48.0 |
| Bachelor's Degree | 25,894 (22.2%) | 58.0 |
| Graduate Degree | 16,148 (13.8%) | 68.0 |
| Total | 116,868 (100.0%) | 52.0 |
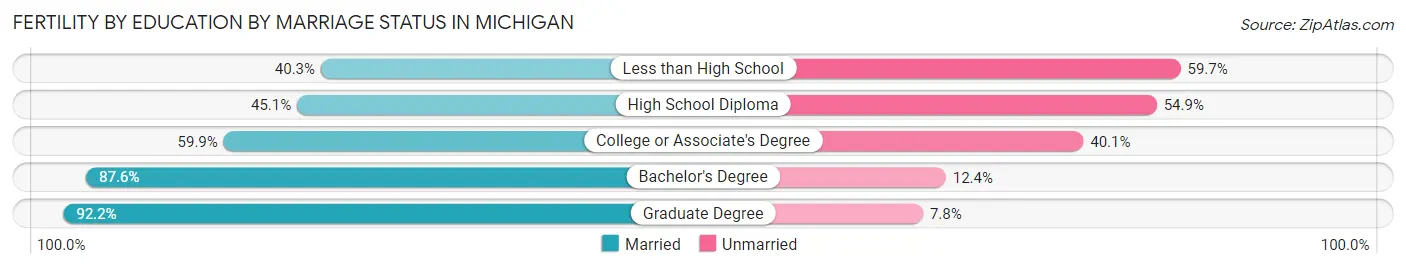
Fertility by Education by Marriage Status in Michigan
34.8% of women with births in Michigan are unmarried. Women with the educational attainment of graduate degree are most likely to be married with 92.2% of them married at childbirth, while women with the educational attainment of less than high school are least likely to be married with 59.7% of them unmarried at childbirth.
| Educational Attainment | Married | Unmarried |
| Less than High School | 4,420 (40.3%) | 6,548 (59.7%) |
| High School Diploma | 12,150 (45.1%) | 14,791 (54.9%) |
| College or Associate's Degree | 22,113 (59.9%) | 14,804 (40.1%) |
| Bachelor's Degree | 22,683 (87.6%) | 3,211 (12.4%) |
| Graduate Degree | 14,888 (92.2%) | 1,260 (7.8%) |
| Total | 76,198 (65.2%) | 40,670 (34.8%) |
Employment Characteristics in Michigan
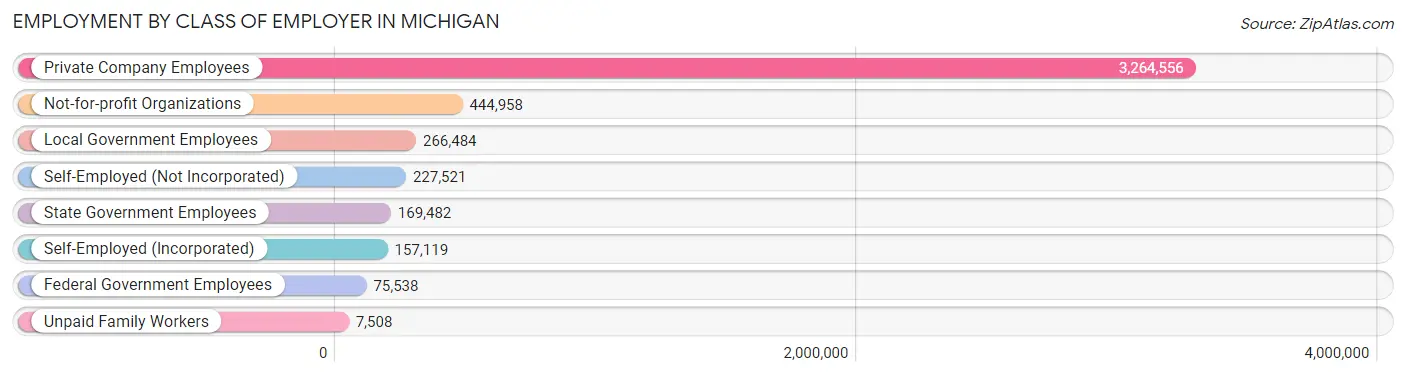
Employment by Class of Employer in Michigan
Among the 4,613,166 employed individuals in Michigan, private company employees (3,264,556 | 70.8%), not-for-profit organizations (444,958 | 9.7%), and local government employees (266,484 | 5.8%) make up the most common classes of employment.
| Employer Class | # Employees | % Employees |
| Private Company Employees | 3,264,556 | 70.8% |
| Self-Employed (Incorporated) | 157,119 | 3.4% |
| Self-Employed (Not Incorporated) | 227,521 | 4.9% |
| Not-for-profit Organizations | 444,958 | 9.7% |
| Local Government Employees | 266,484 | 5.8% |
| State Government Employees | 169,482 | 3.7% |
| Federal Government Employees | 75,538 | 1.6% |
| Unpaid Family Workers | 7,508 | 0.2% |
| Total | 4,613,166 | 100.0% |
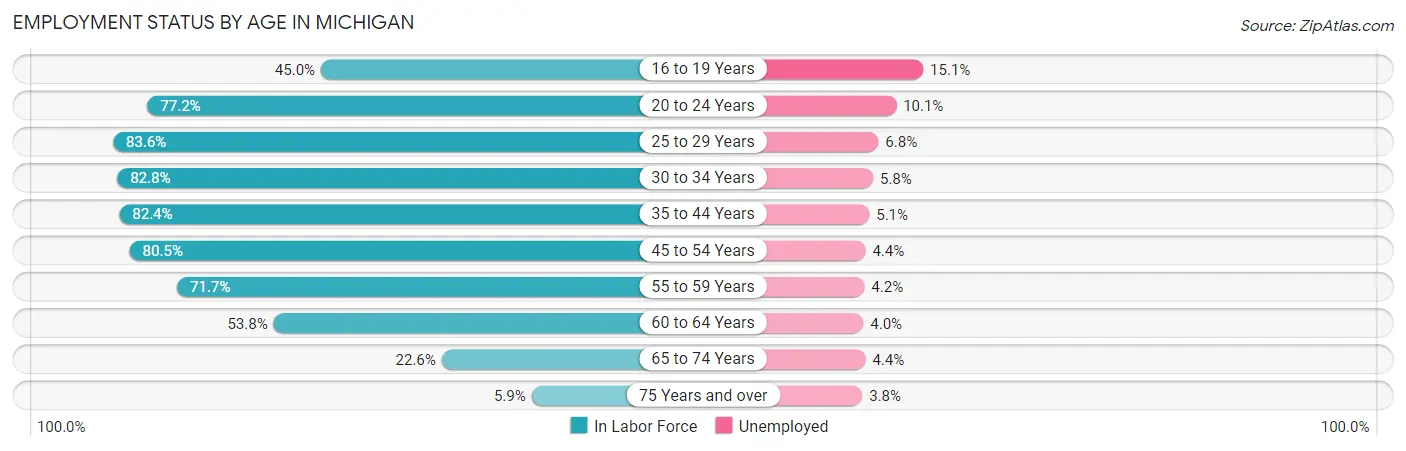
Employment Status by Age in Michigan
According to the labor force statistics for Michigan, out of the total population over 16 years of age (8,166,427), 61.5% or 5,022,353 individuals are in the labor force, with 6.0% or 301,341 of them unemployed. The age group with the highest labor force participation rate is 25 to 29 years, with 83.6% or 561,470 individuals in the labor force. Within the labor force, the 16 to 19 years age range has the highest percentage of unemployed individuals, with 15.1% or 36,037 of them being unemployed.
| Age Bracket | In Labor Force | Unemployed |
| 16 to 19 Years | 238,656 (45.0%) | 36,037 (15.1%) |
| 20 to 24 Years | 538,579 (77.2%) | 54,396 (10.1%) |
| 25 to 29 Years | 561,470 (83.6%) | 38,180 (6.8%) |
| 30 to 34 Years | 526,105 (82.8%) | 30,514 (5.8%) |
| 35 to 44 Years | 986,129 (82.4%) | 50,293 (5.1%) |
| 45 to 54 Years | 1,007,025 (80.5%) | 44,309 (4.4%) |
| 55 to 59 Years | 495,311 (71.7%) | 20,803 (4.2%) |
| 60 to 64 Years | 379,868 (53.8%) | 15,195 (4.0%) |
| 65 to 74 Years | 241,792 (22.6%) | 10,639 (4.4%) |
| 75 Years and over | 42,300 (5.9%) | 1,607 (3.8%) |
| Total | 5,022,353 (61.5%) | 301,341 (6.0%) |
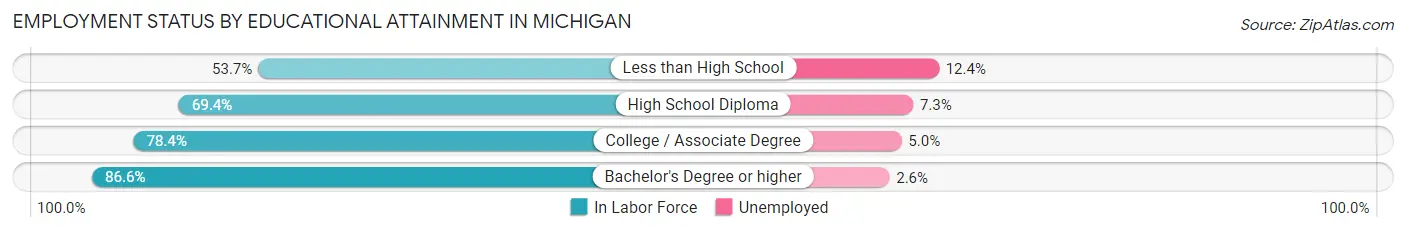
Employment Status by Educational Attainment in Michigan
According to labor force statistics for Michigan, 76.8% of individuals (3,956,440) out of the total population between 25 and 64 years of age (5,151,614) are in the labor force, with 5.0% or 197,822 of them being unemployed. The group with the highest labor force participation rate are those with the educational attainment of bachelor's degree or higher, with 86.6% or 1,464,397 individuals in the labor force. Within the labor force, individuals with less than high school education have the highest percentage of unemployment, with 12.4% or 26,308 of them being unemployed.
| Educational Attainment | In Labor Force | Unemployed |
| Less than High School | 212,160 (53.7%) | 48,990 (12.4%) |
| High School Diploma | 949,597 (69.4%) | 99,886 (7.3%) |
| College / Associate Degree | 1,330,640 (78.4%) | 84,862 (5.0%) |
| Bachelor's Degree or higher | 1,464,397 (86.6%) | 43,966 (2.6%) |
| Total | 3,956,440 (76.8%) | 257,581 (5.0%) |
Employment Occupations by Sex in Michigan
Management, Business, Science and Arts Occupations
The most common Management, Business, Science and Arts occupations in Michigan are Management (479,836 | 10.2%), Community & Social Service (455,915 | 9.7%), Computers, Engineering & Science (338,128 | 7.2%), Health Diagnosing & Treating (313,119 | 6.7%), and Education Instruction & Library (251,578 | 5.3%).
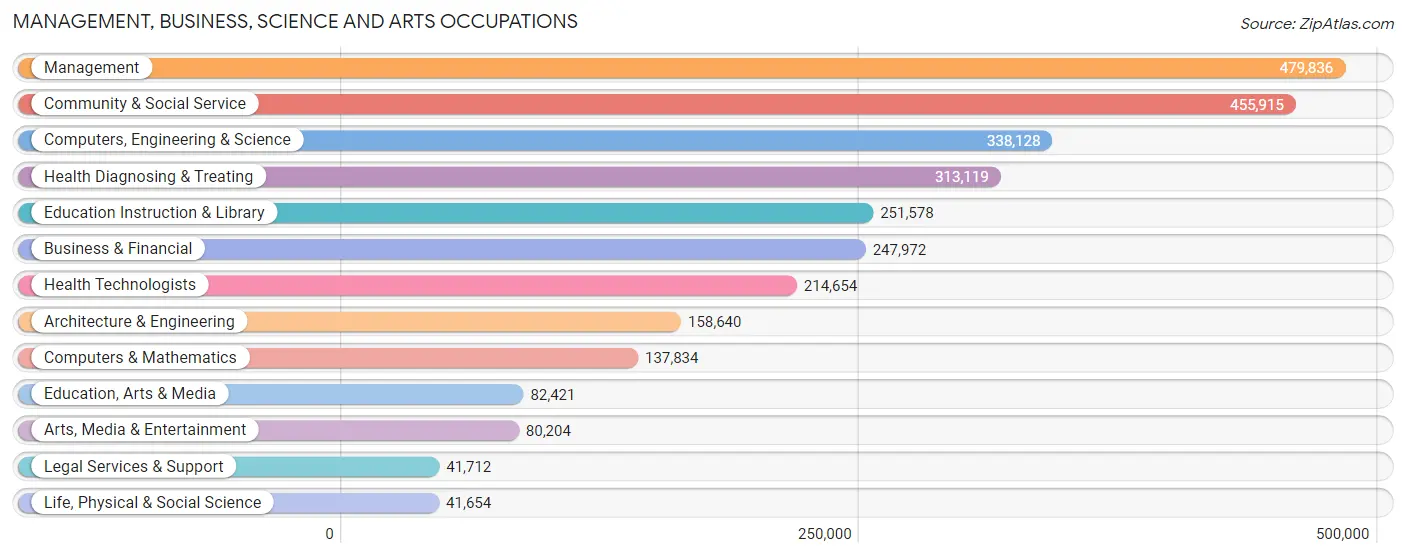
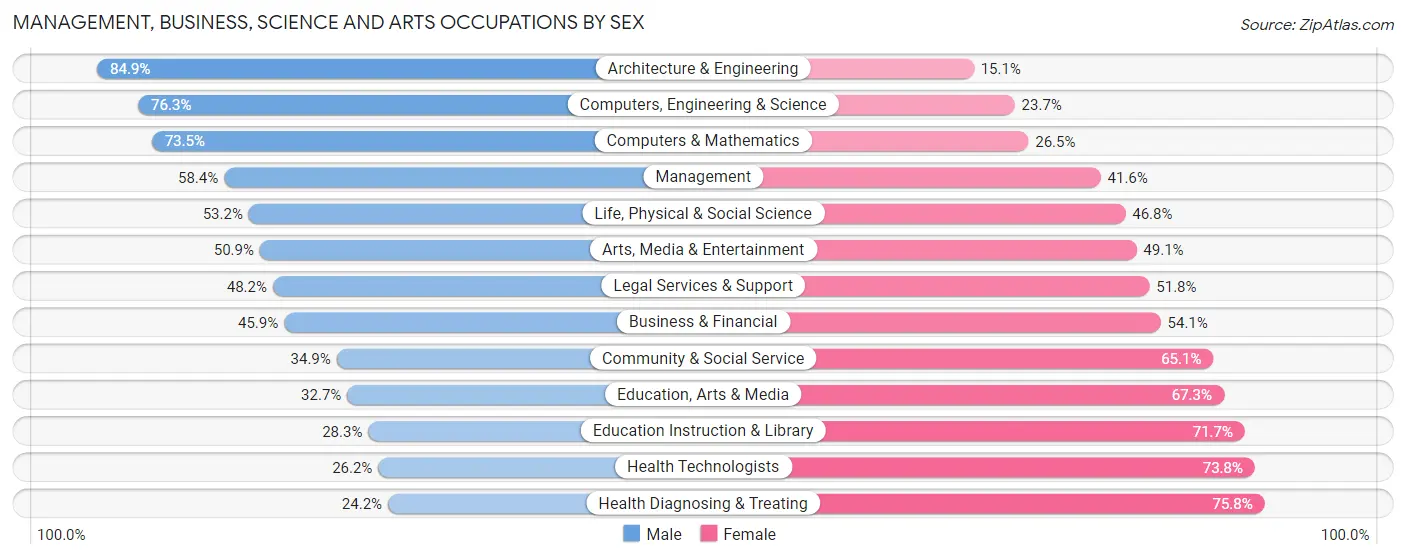
Management, Business, Science and Arts Occupations by Sex
Within the Management, Business, Science and Arts occupations in Michigan, the most male-oriented occupations are Architecture & Engineering (84.9%), Computers, Engineering & Science (76.3%), and Computers & Mathematics (73.5%), while the most female-oriented occupations are Health Diagnosing & Treating (75.8%), Health Technologists (73.8%), and Education Instruction & Library (71.7%).
| Occupation | Male | Female |
| Management | 280,200 (58.4%) | 199,636 (41.6%) |
| Business & Financial | 113,773 (45.9%) | 134,199 (54.1%) |
| Computers, Engineering & Science | 258,090 (76.3%) | 80,038 (23.7%) |
| Computers & Mathematics | 101,275 (73.5%) | 36,559 (26.5%) |
| Architecture & Engineering | 134,640 (84.9%) | 24,000 (15.1%) |
| Life, Physical & Social Science | 22,175 (53.2%) | 19,479 (46.8%) |
| Community & Social Service | 159,167 (34.9%) | 296,748 (65.1%) |
| Education, Arts & Media | 26,964 (32.7%) | 55,457 (67.3%) |
| Legal Services & Support | 20,112 (48.2%) | 21,600 (51.8%) |
| Education Instruction & Library | 71,246 (28.3%) | 180,332 (71.7%) |
| Arts, Media & Entertainment | 40,845 (50.9%) | 39,359 (49.1%) |
| Health Diagnosing & Treating | 75,814 (24.2%) | 237,305 (75.8%) |
| Health Technologists | 56,330 (26.2%) | 158,324 (73.8%) |
| Total (Category) | 887,044 (48.3%) | 947,926 (51.7%) |
| Total (Overall) | 2,482,187 (52.7%) | 2,229,257 (47.3%) |
Services Occupations
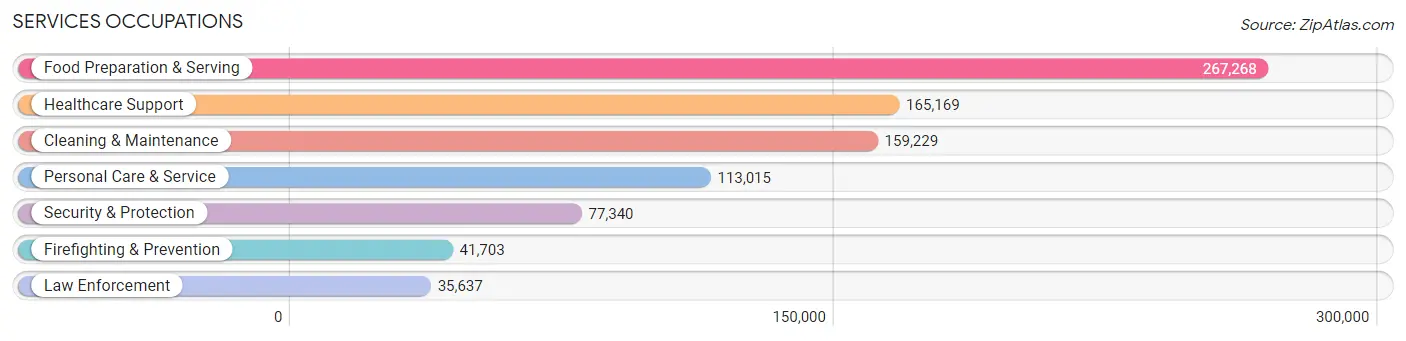
The most common Services occupations in Michigan are Food Preparation & Serving (267,268 | 5.7%), Healthcare Support (165,169 | 3.5%), Cleaning & Maintenance (159,229 | 3.4%), Personal Care & Service (113,015 | 2.4%), and Security & Protection (77,340 | 1.6%).
Services Occupations by Sex
Within the Services occupations in Michigan, the most male-oriented occupations are Law Enforcement (83.3%), Security & Protection (77.7%), and Firefighting & Prevention (72.9%), while the most female-oriented occupations are Healthcare Support (86.5%), Personal Care & Service (77.4%), and Food Preparation & Serving (57.8%).
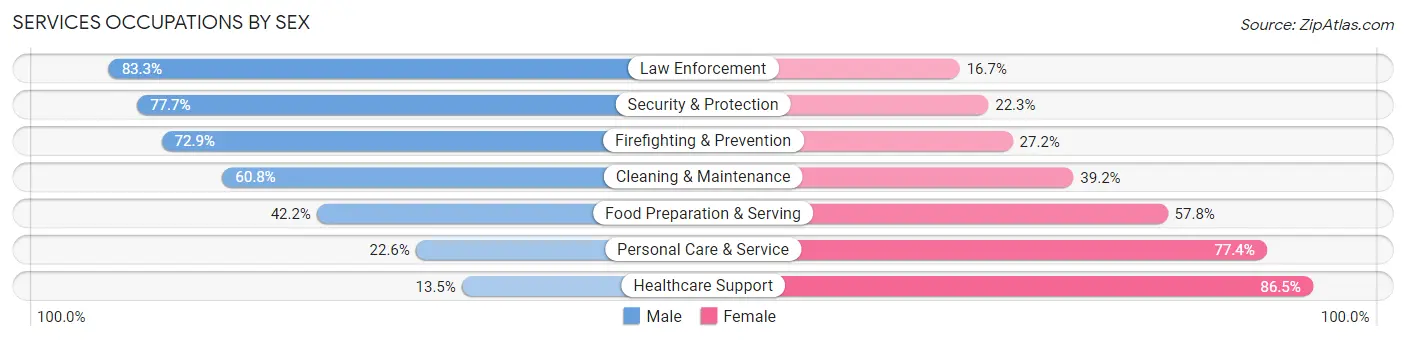
| Occupation | Male | Female |
| Healthcare Support | 22,228 (13.5%) | 142,941 (86.5%) |
| Security & Protection | 60,074 (77.7%) | 17,266 (22.3%) |
| Firefighting & Prevention | 30,379 (72.9%) | 11,324 (27.2%) |
| Law Enforcement | 29,695 (83.3%) | 5,942 (16.7%) |
| Food Preparation & Serving | 112,689 (42.2%) | 154,579 (57.8%) |
| Cleaning & Maintenance | 96,843 (60.8%) | 62,386 (39.2%) |
| Personal Care & Service | 25,504 (22.6%) | 87,511 (77.4%) |
| Total (Category) | 317,338 (40.6%) | 464,683 (59.4%) |
| Total (Overall) | 2,482,187 (52.7%) | 2,229,257 (47.3%) |
Sales and Office Occupations
The most common Sales and Office occupations in Michigan are Office & Administration (509,186 | 10.8%), and Sales & Related (430,527 | 9.1%).
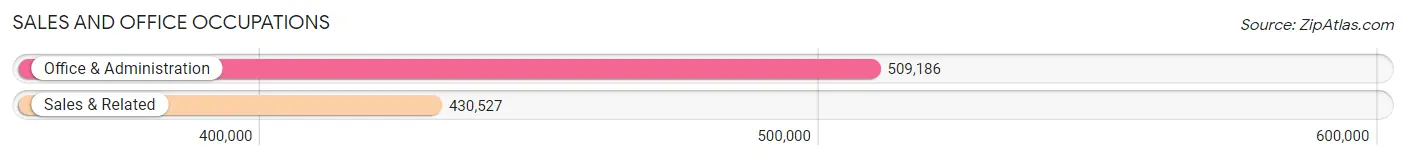
Sales and Office Occupations by Sex
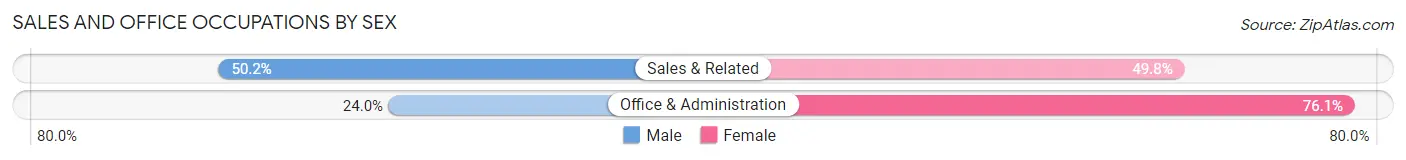
| Occupation | Male | Female |
| Sales & Related | 215,978 (50.2%) | 214,549 (49.8%) |
| Office & Administration | 121,951 (23.9%) | 387,235 (76.0%) |
| Total (Category) | 337,929 (36.0%) | 601,784 (64.0%) |
| Total (Overall) | 2,482,187 (52.7%) | 2,229,257 (47.3%) |
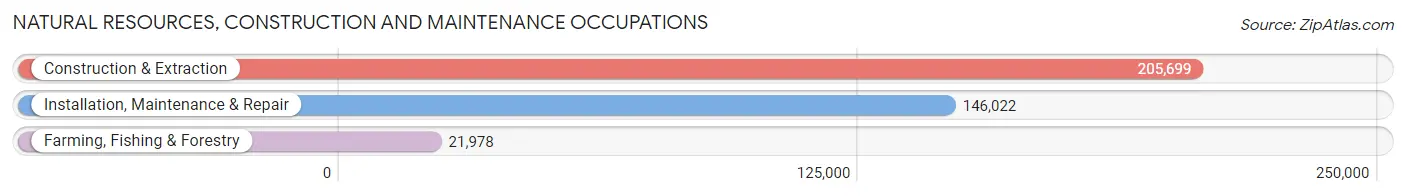
Natural Resources, Construction and Maintenance Occupations
The most common Natural Resources, Construction and Maintenance occupations in Michigan are Construction & Extraction (205,699 | 4.4%), Installation, Maintenance & Repair (146,022 | 3.1%), and Farming, Fishing & Forestry (21,978 | 0.5%).
Natural Resources, Construction and Maintenance Occupations by Sex
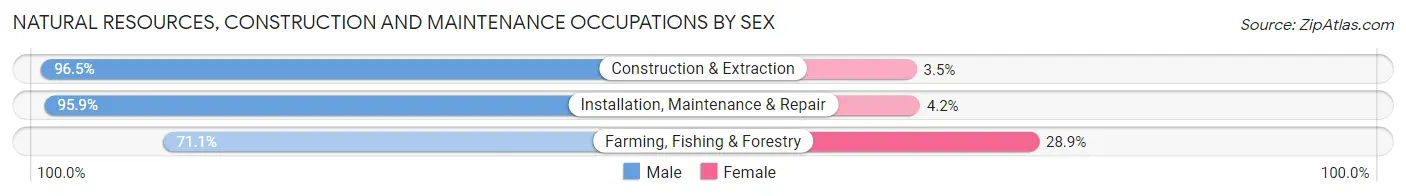
| Occupation | Male | Female |
| Farming, Fishing & Forestry | 15,617 (71.1%) | 6,361 (28.9%) |
| Construction & Extraction | 198,567 (96.5%) | 7,132 (3.5%) |
| Installation, Maintenance & Repair | 139,960 (95.9%) | 6,062 (4.2%) |
| Total (Category) | 354,144 (94.8%) | 19,555 (5.2%) |
| Total (Overall) | 2,482,187 (52.7%) | 2,229,257 (47.3%) |
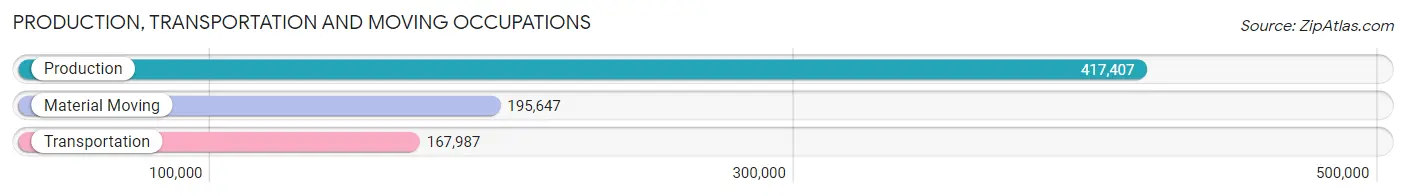
Production, Transportation and Moving Occupations
The most common Production, Transportation and Moving occupations in Michigan are Production (417,407 | 8.9%), Material Moving (195,647 | 4.2%), and Transportation (167,987 | 3.6%).
Production, Transportation and Moving Occupations by Sex
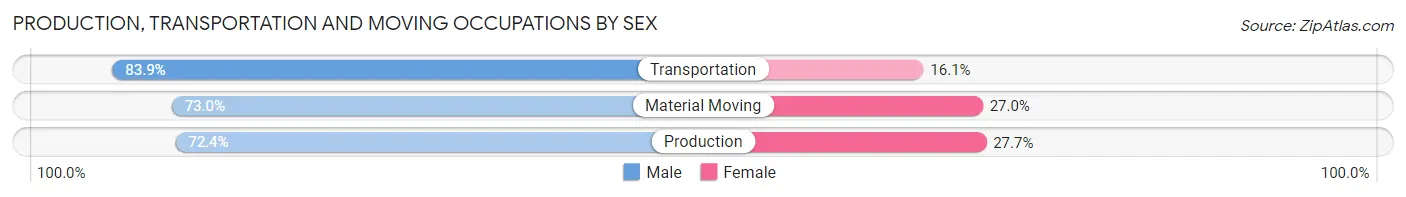
| Occupation | Male | Female |
| Production | 301,997 (72.4%) | 115,410 (27.7%) |
| Transportation | 140,913 (83.9%) | 27,074 (16.1%) |
| Material Moving | 142,822 (73.0%) | 52,825 (27.0%) |
| Total (Category) | 585,732 (75.0%) | 195,309 (25.0%) |
| Total (Overall) | 2,482,187 (52.7%) | 2,229,257 (47.3%) |
Employment Industries by Sex in Michigan
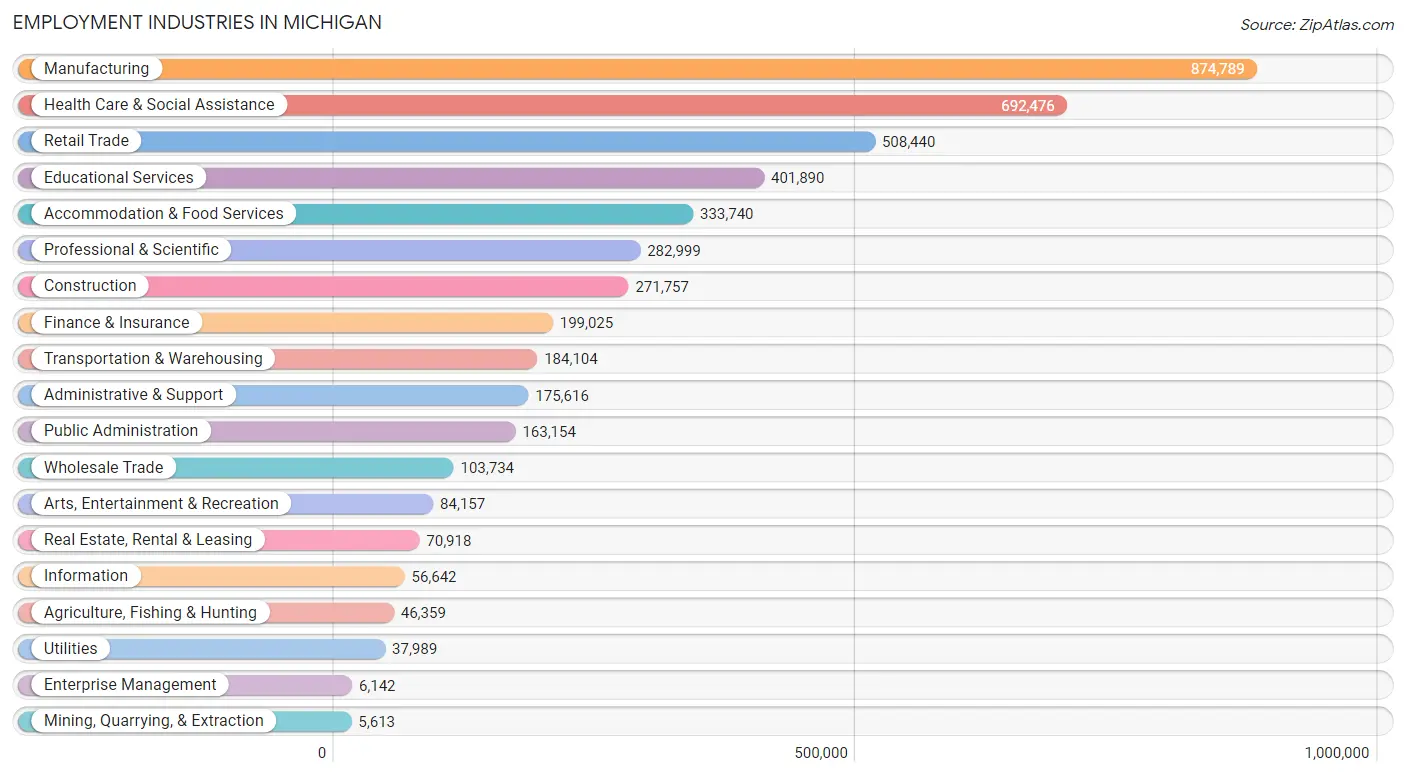
Employment Industries in Michigan
The major employment industries in Michigan include Manufacturing (874,789 | 18.6%), Health Care & Social Assistance (692,476 | 14.7%), Retail Trade (508,440 | 10.8%), Educational Services (401,890 | 8.5%), and Accommodation & Food Services (333,740 | 7.1%).
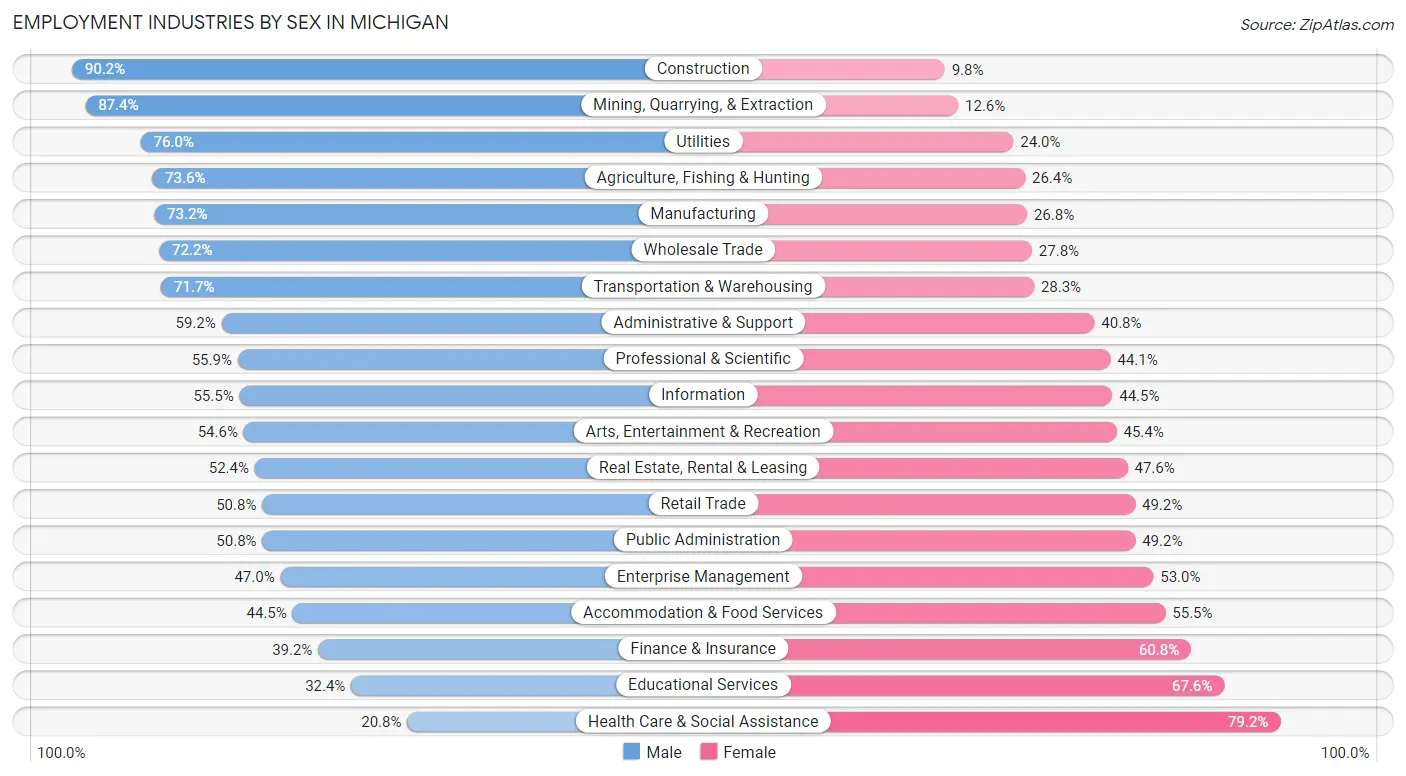
Employment Industries by Sex in Michigan
The Michigan industries that see more men than women are Construction (90.2%), Mining, Quarrying, & Extraction (87.4%), and Utilities (76.0%), whereas the industries that tend to have a higher number of women are Health Care & Social Assistance (79.2%), Educational Services (67.6%), and Finance & Insurance (60.8%).
| Industry | Male | Female |
| Agriculture, Fishing & Hunting | 34,115 (73.6%) | 12,244 (26.4%) |
| Mining, Quarrying, & Extraction | 4,908 (87.4%) | 705 (12.6%) |
| Construction | 245,146 (90.2%) | 26,611 (9.8%) |
| Manufacturing | 640,203 (73.2%) | 234,586 (26.8%) |
| Wholesale Trade | 74,859 (72.2%) | 28,875 (27.8%) |
| Retail Trade | 258,351 (50.8%) | 250,089 (49.2%) |
| Transportation & Warehousing | 132,079 (71.7%) | 52,025 (28.3%) |
| Utilities | 28,872 (76.0%) | 9,117 (24.0%) |
| Information | 31,445 (55.5%) | 25,197 (44.5%) |
| Finance & Insurance | 78,076 (39.2%) | 120,949 (60.8%) |
| Real Estate, Rental & Leasing | 37,131 (52.4%) | 33,787 (47.6%) |
| Professional & Scientific | 158,130 (55.9%) | 124,869 (44.1%) |
| Enterprise Management | 2,889 (47.0%) | 3,253 (53.0%) |
| Administrative & Support | 104,038 (59.2%) | 71,578 (40.8%) |
| Educational Services | 130,203 (32.4%) | 271,687 (67.6%) |
| Health Care & Social Assistance | 143,990 (20.8%) | 548,486 (79.2%) |
| Arts, Entertainment & Recreation | 45,980 (54.6%) | 38,177 (45.4%) |
| Accommodation & Food Services | 148,640 (44.5%) | 185,100 (55.5%) |
| Public Administration | 82,854 (50.8%) | 80,300 (49.2%) |
| Total | 2,482,187 (52.7%) | 2,229,257 (47.3%) |
Education in Michigan
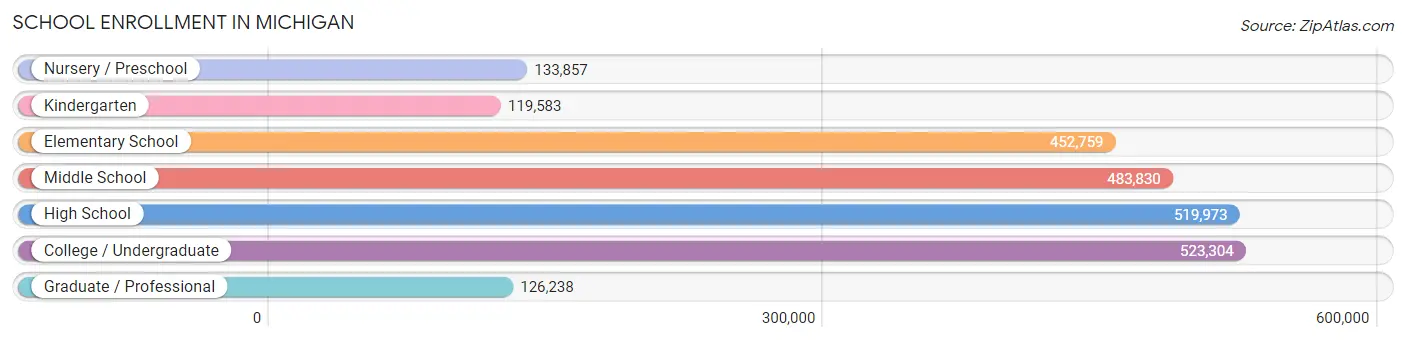
School Enrollment in Michigan
The most common levels of schooling among the 2,359,544 students in Michigan are college / undergraduate (523,304 | 22.2%), high school (519,973 | 22.0%), and middle school (483,830 | 20.5%).
| School Level | # Students | % Students |
| Nursery / Preschool | 133,857 | 5.7% |
| Kindergarten | 119,583 | 5.1% |
| Elementary School | 452,759 | 19.2% |
| Middle School | 483,830 | 20.5% |
| High School | 519,973 | 22.0% |
| College / Undergraduate | 523,304 | 22.2% |
| Graduate / Professional | 126,238 | 5.3% |
| Total | 2,359,544 | 100.0% |
School Enrollment by Age by Funding Source in Michigan
Out of a total of 2,359,544 students who are enrolled in schools in Michigan, 337,415 (14.3%) attend a private institution, while the remaining 2,022,129 (85.7%) are enrolled in public schools. The age group of 3 to 4 year olds has the highest likelihood of being enrolled in private schools, with 38,350 (37.3% in the age bracket) enrolled. Conversely, the age group of 15 to 17 year olds has the lowest likelihood of being enrolled in a private school, with 337,508 (90.1% in the age bracket) attending a public institution.
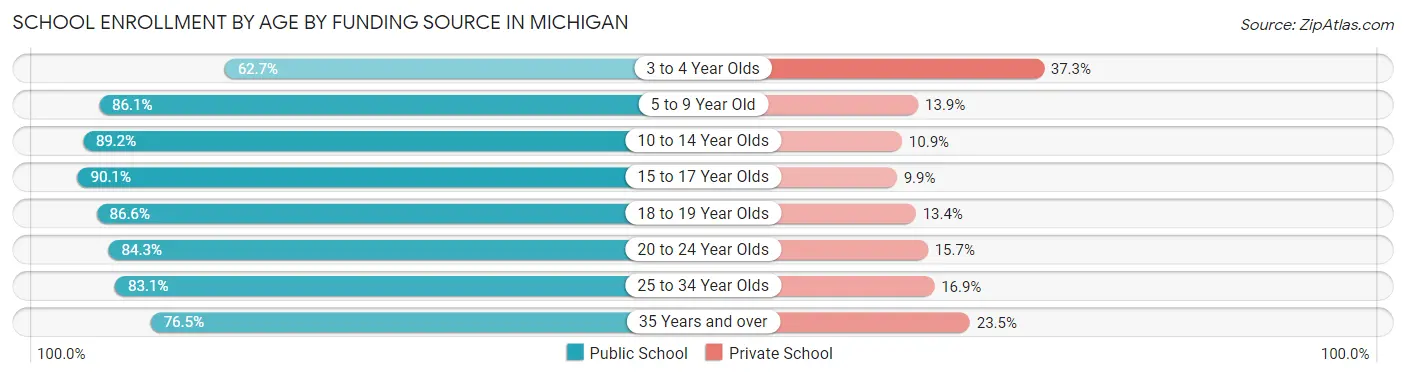
| Age Bracket | Public School | Private School |
| 3 to 4 Year Olds | 64,510 (62.7%) | 38,350 (37.3%) |
| 5 to 9 Year Old | 472,378 (86.1%) | 76,041 (13.9%) |
| 10 to 14 Year Olds | 537,628 (89.1%) | 65,436 (10.8%) |
| 15 to 17 Year Olds | 337,508 (90.1%) | 36,993 (9.9%) |
| 18 to 19 Year Olds | 172,564 (86.6%) | 26,739 (13.4%) |
| 20 to 24 Year Olds | 242,672 (84.3%) | 45,047 (15.7%) |
| 25 to 34 Year Olds | 115,118 (83.1%) | 23,338 (16.9%) |
| 35 Years and over | 80,494 (76.5%) | 24,728 (23.5%) |
| Total | 2,022,129 (85.7%) | 337,415 (14.3%) |
Educational Attainment by Field of Study in Michigan
Business (474,408 | 20.3%), education (296,548 | 12.7%), science & technology (261,586 | 11.2%), engineering (234,773 | 10.0%), and arts & humanities (159,601 | 6.8%) are the most common fields of study among 2,342,957 individuals in Michigan who have obtained a bachelor's degree or higher.
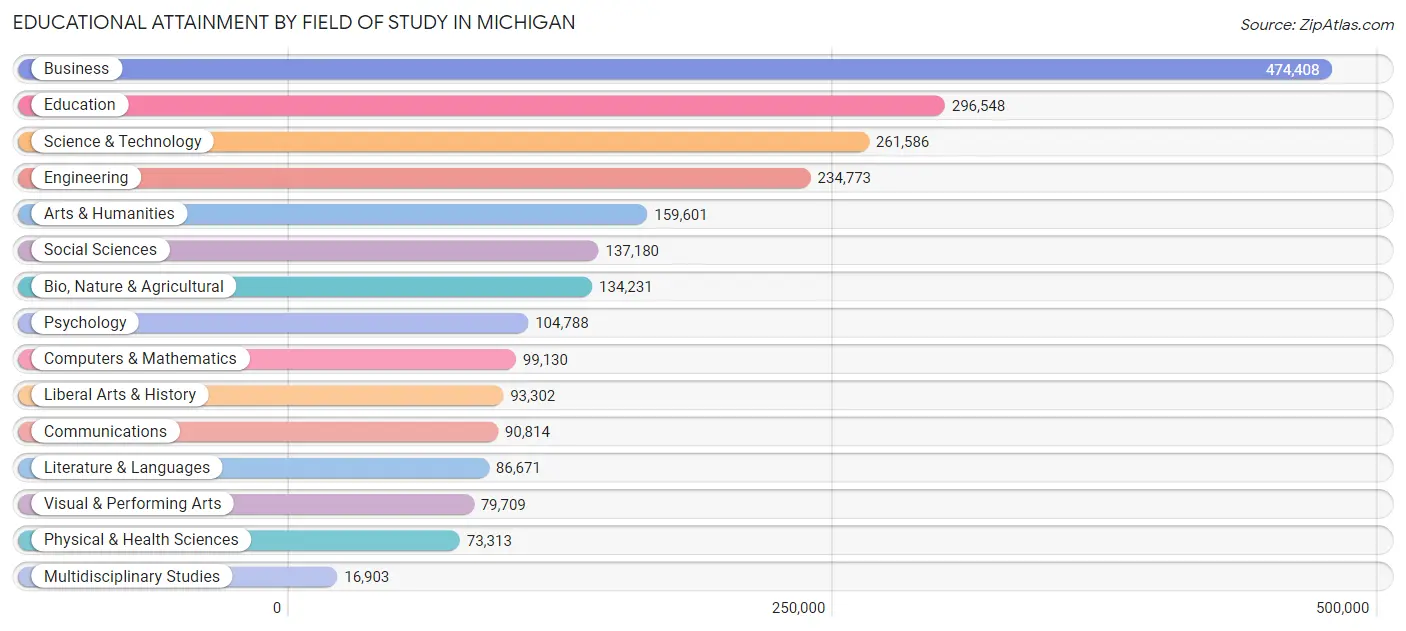
| Field of Study | # Graduates | % Graduates |
| Computers & Mathematics | 99,130 | 4.2% |
| Bio, Nature & Agricultural | 134,231 | 5.7% |
| Physical & Health Sciences | 73,313 | 3.1% |
| Psychology | 104,788 | 4.5% |
| Social Sciences | 137,180 | 5.9% |
| Engineering | 234,773 | 10.0% |
| Multidisciplinary Studies | 16,903 | 0.7% |
| Science & Technology | 261,586 | 11.2% |
| Business | 474,408 | 20.3% |
| Education | 296,548 | 12.7% |
| Literature & Languages | 86,671 | 3.7% |
| Liberal Arts & History | 93,302 | 4.0% |
| Visual & Performing Arts | 79,709 | 3.4% |
| Communications | 90,814 | 3.9% |
| Arts & Humanities | 159,601 | 6.8% |
| Total | 2,342,957 | 100.0% |
Transportation & Commute in Michigan
Vehicle Availability by Sex in Michigan
The most prevalent vehicle ownership categories in Michigan are males with 2 vehicles (1,066,666, accounting for 44.0%) and females with 2 vehicles (903,201, making up 49.7%).
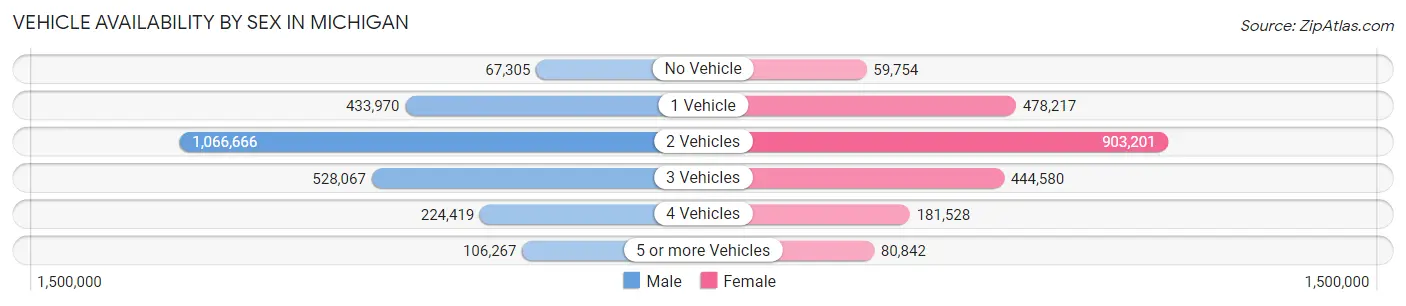
| Vehicles Available | Male | Female |
| No Vehicle | 67,305 (2.8%) | 59,754 (2.8%) |
| 1 Vehicle | 433,970 (17.9%) | 478,217 (22.3%) |
| 2 Vehicles | 1,066,666 (44.0%) | 903,201 (42.0%) |
| 3 Vehicles | 528,067 (21.8%) | 444,580 (20.7%) |
| 4 Vehicles | 224,419 (9.2%) | 181,528 (8.5%) |
| 5 or more Vehicles | 106,267 (4.4%) | 80,842 (3.8%) |
| Total | 2,426,694 (100.0%) | 2,148,122 (100.0%) |
Commute Time in Michigan
The most frequently occuring commute durations in Michigan are 15 to 19 minutes (667,042 commuters, 16.1%), 20 to 24 minutes (625,137 commuters, 15.1%), and 10 to 14 minutes (598,015 commuters, 14.4%).
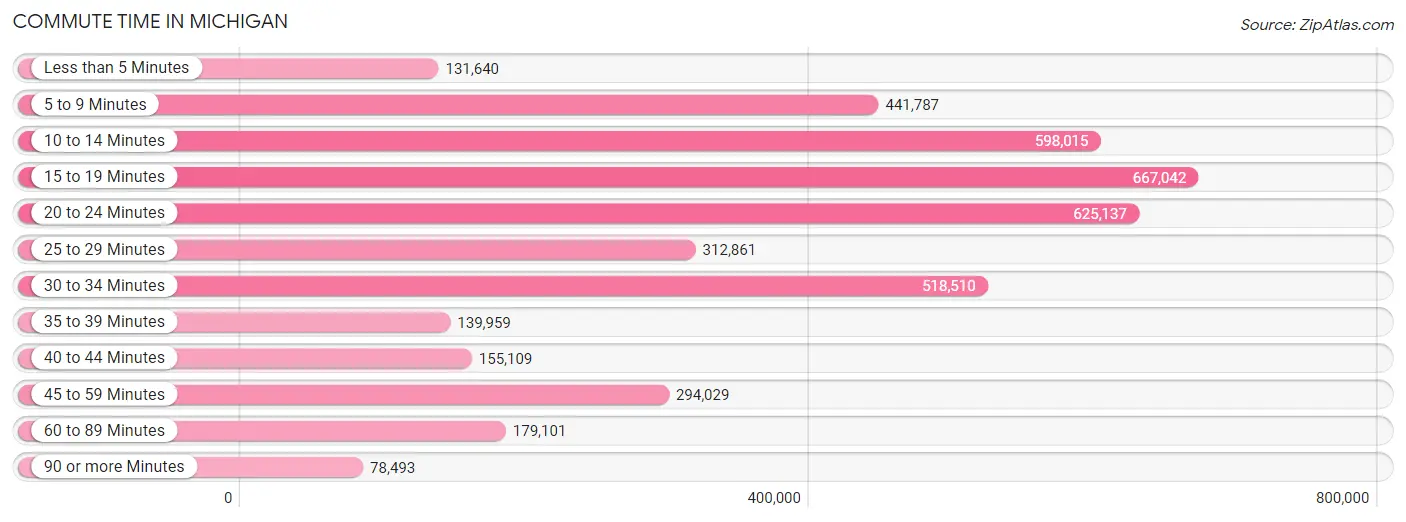
| Commute Time | # Commuters | % Commuters |
| Less than 5 Minutes | 131,640 | 3.2% |
| 5 to 9 Minutes | 441,787 | 10.7% |
| 10 to 14 Minutes | 598,015 | 14.4% |
| 15 to 19 Minutes | 667,042 | 16.1% |
| 20 to 24 Minutes | 625,137 | 15.1% |
| 25 to 29 Minutes | 312,861 | 7.5% |
| 30 to 34 Minutes | 518,510 | 12.5% |
| 35 to 39 Minutes | 139,959 | 3.4% |
| 40 to 44 Minutes | 155,109 | 3.7% |
| 45 to 59 Minutes | 294,029 | 7.1% |
| 60 to 89 Minutes | 179,101 | 4.3% |
| 90 or more Minutes | 78,493 | 1.9% |
Commute Time by Sex in Michigan
The most common commute times in Michigan are 15 to 19 minutes (340,755 commuters, 15.4%) for males and 15 to 19 minutes (326,287 commuters, 16.9%) for females.
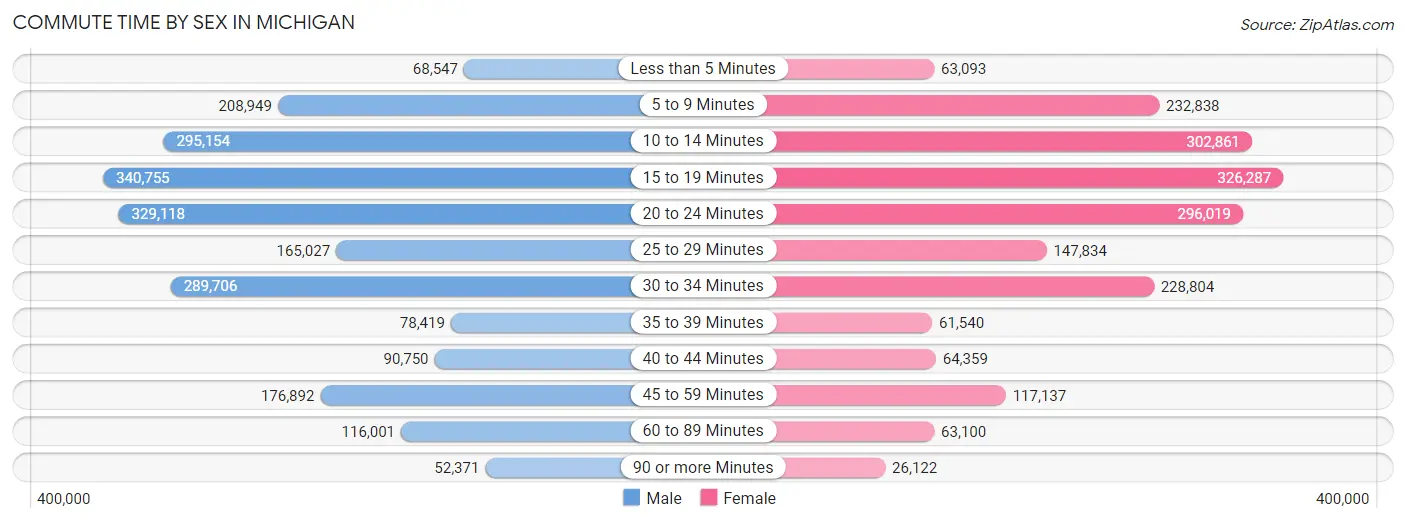
| Commute Time | Male | Female |
| Less than 5 Minutes | 68,547 (3.1%) | 63,093 (3.3%) |
| 5 to 9 Minutes | 208,949 (9.5%) | 232,838 (12.1%) |
| 10 to 14 Minutes | 295,154 (13.4%) | 302,861 (15.7%) |
| 15 to 19 Minutes | 340,755 (15.4%) | 326,287 (16.9%) |
| 20 to 24 Minutes | 329,118 (14.9%) | 296,019 (15.3%) |
| 25 to 29 Minutes | 165,027 (7.5%) | 147,834 (7.7%) |
| 30 to 34 Minutes | 289,706 (13.1%) | 228,804 (11.9%) |
| 35 to 39 Minutes | 78,419 (3.5%) | 61,540 (3.2%) |
| 40 to 44 Minutes | 90,750 (4.1%) | 64,359 (3.3%) |
| 45 to 59 Minutes | 176,892 (8.0%) | 117,137 (6.1%) |
| 60 to 89 Minutes | 116,001 (5.2%) | 63,100 (3.3%) |
| 90 or more Minutes | 52,371 (2.4%) | 26,122 (1.3%) |
Time of Departure to Work by Sex in Michigan
The most frequent times of departure to work in Michigan are 7:00 AM to 7:29 AM (276,622, 12.5%) for males and 7:30 AM to 7:59 AM (269,375, 14.0%) for females.
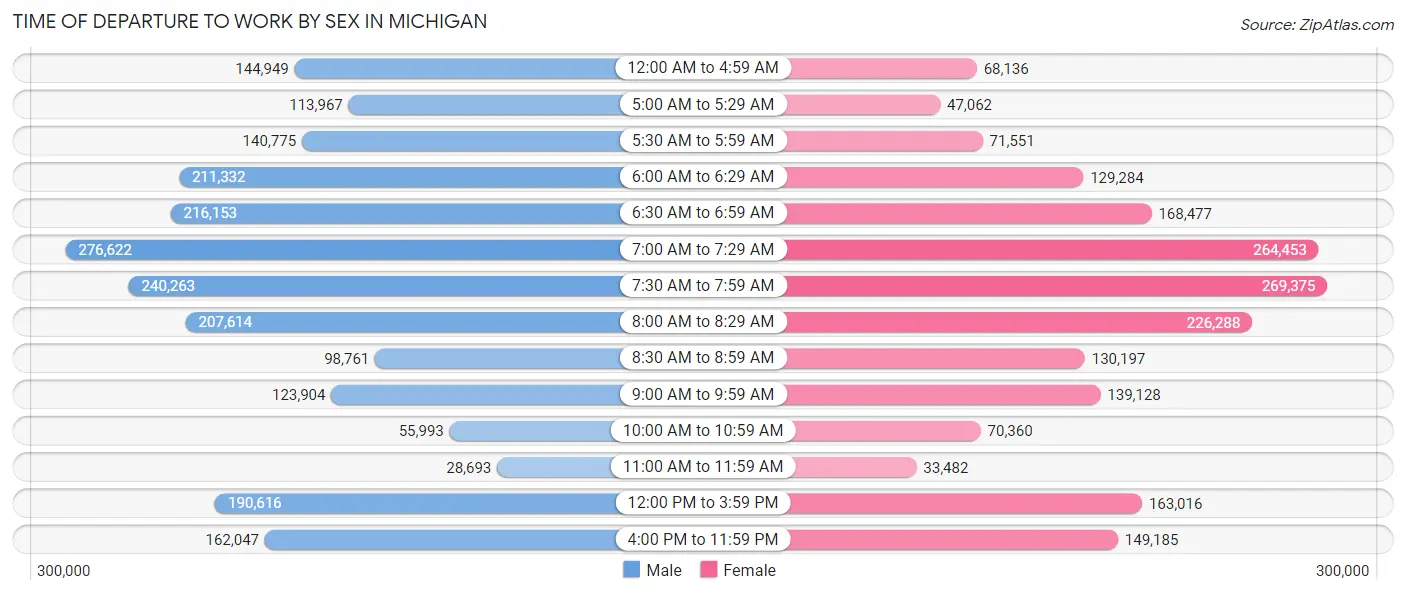
| Time of Departure | Male | Female |
| 12:00 AM to 4:59 AM | 144,949 (6.6%) | 68,136 (3.5%) |
| 5:00 AM to 5:29 AM | 113,967 (5.1%) | 47,062 (2.4%) |
| 5:30 AM to 5:59 AM | 140,775 (6.4%) | 71,551 (3.7%) |
| 6:00 AM to 6:29 AM | 211,332 (9.6%) | 129,284 (6.7%) |
| 6:30 AM to 6:59 AM | 216,153 (9.8%) | 168,477 (8.7%) |
| 7:00 AM to 7:29 AM | 276,622 (12.5%) | 264,453 (13.7%) |
| 7:30 AM to 7:59 AM | 240,263 (10.9%) | 269,375 (14.0%) |
| 8:00 AM to 8:29 AM | 207,614 (9.4%) | 226,288 (11.7%) |
| 8:30 AM to 8:59 AM | 98,761 (4.5%) | 130,197 (6.8%) |
| 9:00 AM to 9:59 AM | 123,904 (5.6%) | 139,128 (7.2%) |
| 10:00 AM to 10:59 AM | 55,993 (2.5%) | 70,360 (3.6%) |
| 11:00 AM to 11:59 AM | 28,693 (1.3%) | 33,482 (1.7%) |
| 12:00 PM to 3:59 PM | 190,616 (8.6%) | 163,016 (8.5%) |
| 4:00 PM to 11:59 PM | 162,047 (7.3%) | 149,185 (7.7%) |
| Total | 2,211,689 (100.0%) | 1,929,994 (100.0%) |
Housing Occupancy in Michigan
Occupancy by Ownership in Michigan
Of the total 4,009,253 dwellings in Michigan, owner-occupied units account for 2,906,470 (72.5%), while renter-occupied units make up 1,102,783 (27.5%).
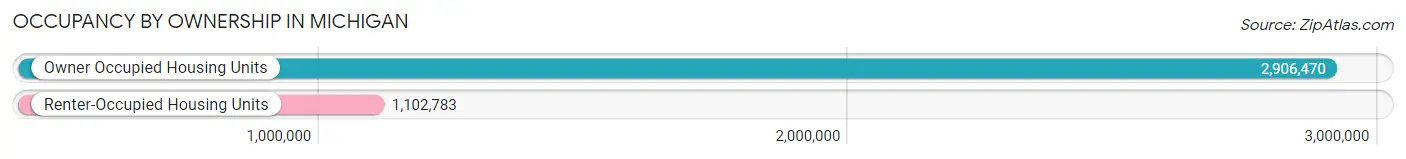
| Occupancy | # Housing Units | % Housing Units |
| Owner Occupied Housing Units | 2,906,470 | 72.5% |
| Renter-Occupied Housing Units | 1,102,783 | 27.5% |
| Total Occupied Housing Units | 4,009,253 | 100.0% |
Occupancy by Household Size in Michigan
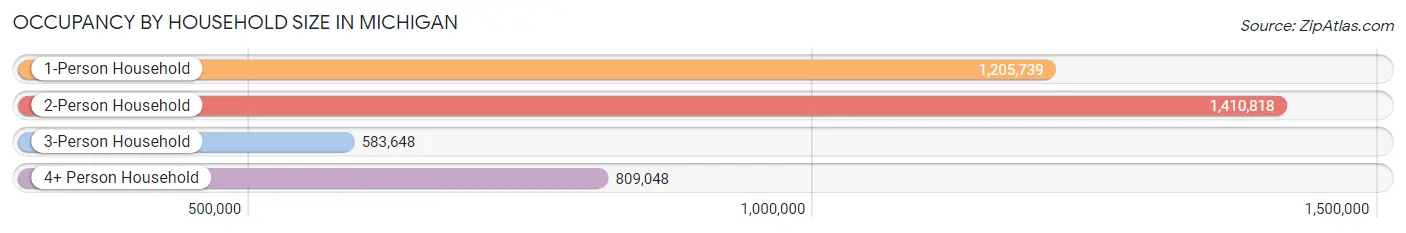
| Household Size | # Housing Units | % Housing Units |
| 1-Person Household | 1,205,739 | 30.1% |
| 2-Person Household | 1,410,818 | 35.2% |
| 3-Person Household | 583,648 | 14.6% |
| 4+ Person Household | 809,048 | 20.2% |
| Total Housing Units | 4,009,253 | 100.0% |
Occupancy by Ownership by Household Size in Michigan
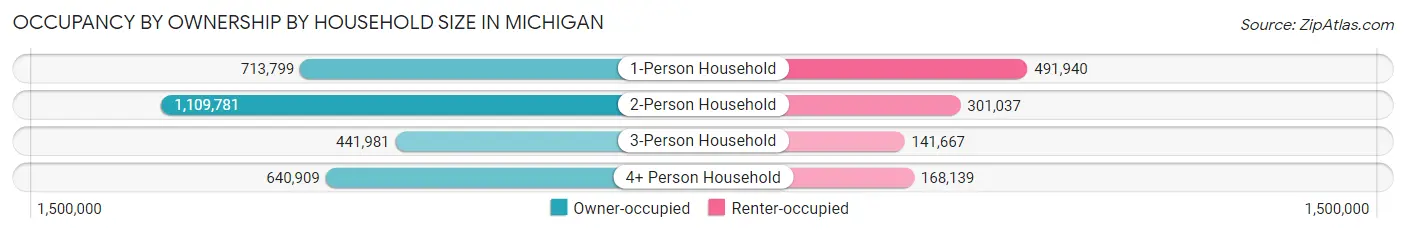
| Household Size | Owner-occupied | Renter-occupied |
| 1-Person Household | 713,799 (59.2%) | 491,940 (40.8%) |
| 2-Person Household | 1,109,781 (78.7%) | 301,037 (21.3%) |
| 3-Person Household | 441,981 (75.7%) | 141,667 (24.3%) |
| 4+ Person Household | 640,909 (79.2%) | 168,139 (20.8%) |
| Total Housing Units | 2,906,470 (72.5%) | 1,102,783 (27.5%) |
Occupancy by Educational Attainment in Michigan
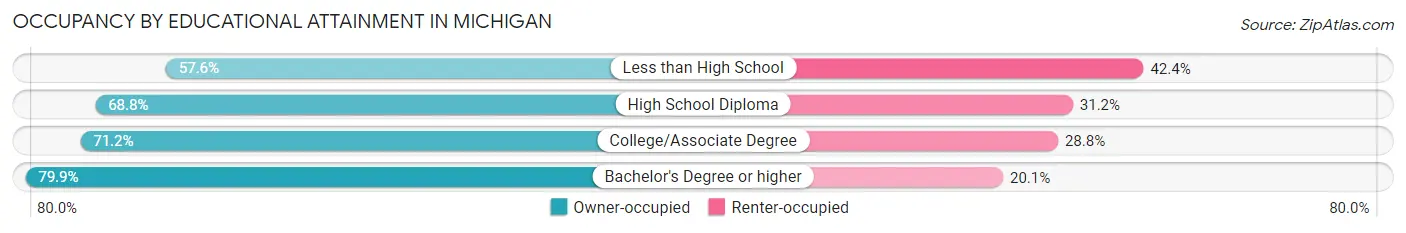
| Household Size | Owner-occupied | Renter-occupied |
| Less than High School | 160,857 (57.6%) | 118,387 (42.4%) |
| High School Diploma | 707,115 (68.8%) | 320,730 (31.2%) |
| College/Associate Degree | 978,882 (71.2%) | 396,695 (28.8%) |
| Bachelor's Degree or higher | 1,059,616 (79.9%) | 266,971 (20.1%) |
Occupancy by Age of Householder in Michigan
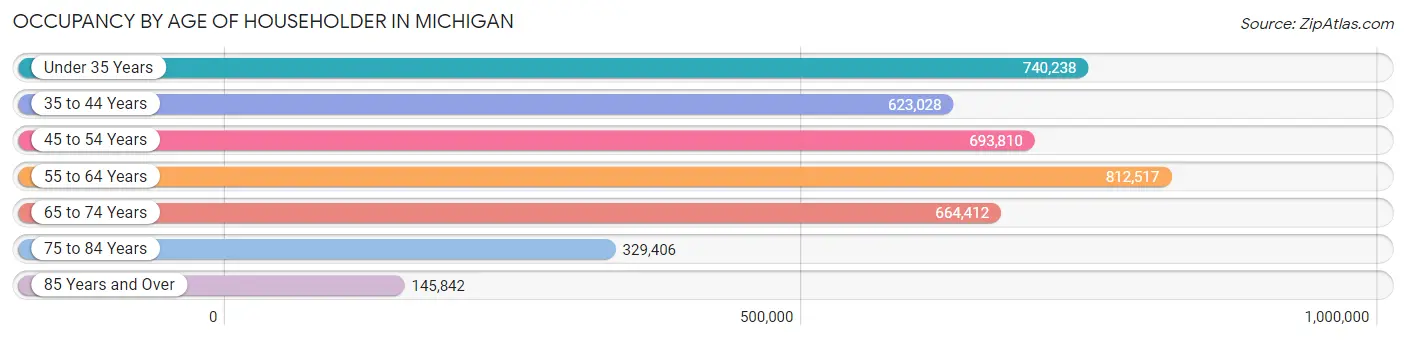
| Age Bracket | # Households | % Households |
| Under 35 Years | 740,238 | 18.5% |
| 35 to 44 Years | 623,028 | 15.5% |
| 45 to 54 Years | 693,810 | 17.3% |
| 55 to 64 Years | 812,517 | 20.3% |
| 65 to 74 Years | 664,412 | 16.6% |
| 75 to 84 Years | 329,406 | 8.2% |
| 85 Years and Over | 145,842 | 3.6% |
| Total | 4,009,253 | 100.0% |
Housing Finances in Michigan
Median Income by Occupancy in Michigan
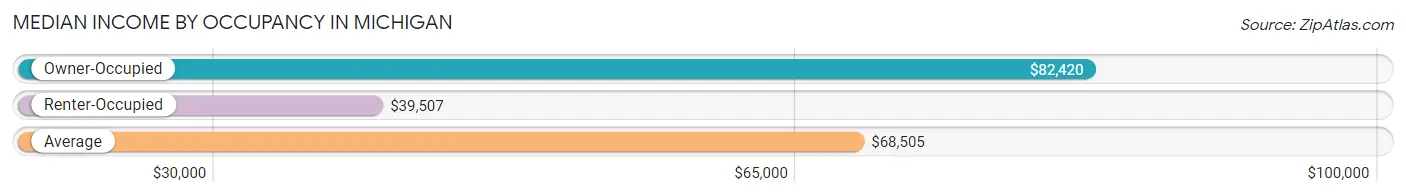
| Occupancy Type | # Households | Median Income |
| Owner-Occupied | 2,906,470 (72.5%) | $82,420 |
| Renter-Occupied | 1,102,783 (27.5%) | $39,507 |
| Average | 4,009,253 (100.0%) | $68,505 |
Occupancy by Householder Income Bracket in Michigan
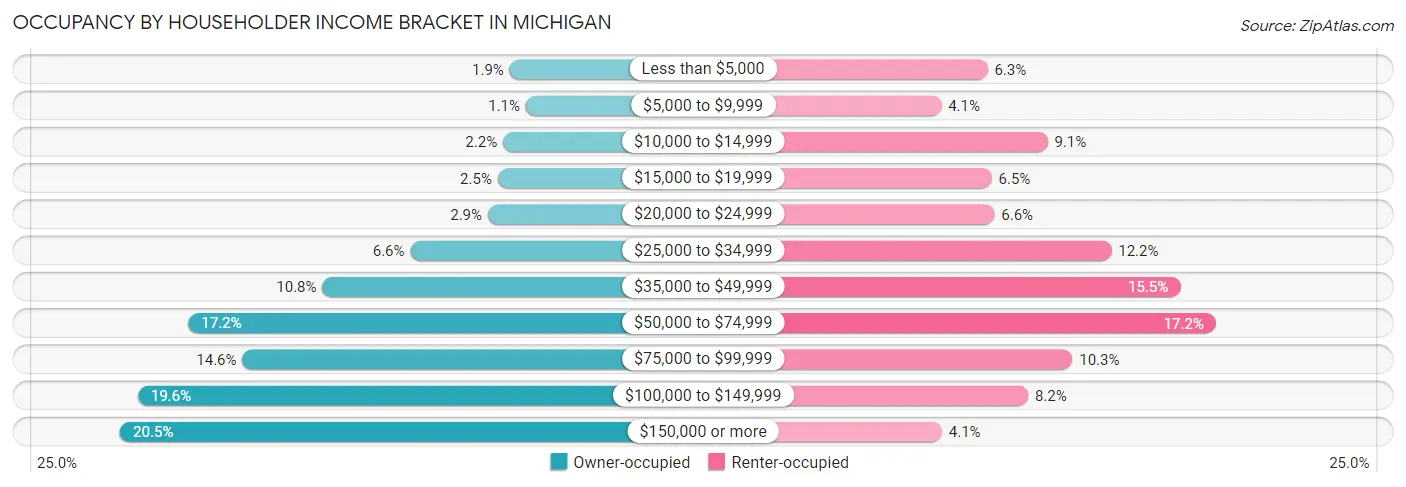
| Income Bracket | Owner-occupied | Renter-occupied |
| Less than $5,000 | 55,125 (1.9%) | 69,234 (6.3%) |
| $5,000 to $9,999 | 32,810 (1.1%) | 44,997 (4.1%) |
| $10,000 to $14,999 | 64,579 (2.2%) | 100,802 (9.1%) |
| $15,000 to $19,999 | 71,748 (2.5%) | 71,411 (6.5%) |
| $20,000 to $24,999 | 85,390 (2.9%) | 72,852 (6.6%) |
| $25,000 to $34,999 | 192,823 (6.6%) | 134,297 (12.2%) |
| $35,000 to $49,999 | 314,388 (10.8%) | 170,349 (15.4%) |
| $50,000 to $74,999 | 499,915 (17.2%) | 189,154 (17.2%) |
| $75,000 to $99,999 | 425,309 (14.6%) | 113,789 (10.3%) |
| $100,000 to $149,999 | 569,930 (19.6%) | 90,569 (8.2%) |
| $150,000 or more | 594,453 (20.4%) | 45,329 (4.1%) |
| Total | 2,906,470 (100.0%) | 1,102,783 (100.0%) |
Monthly Housing Cost Tiers in Michigan
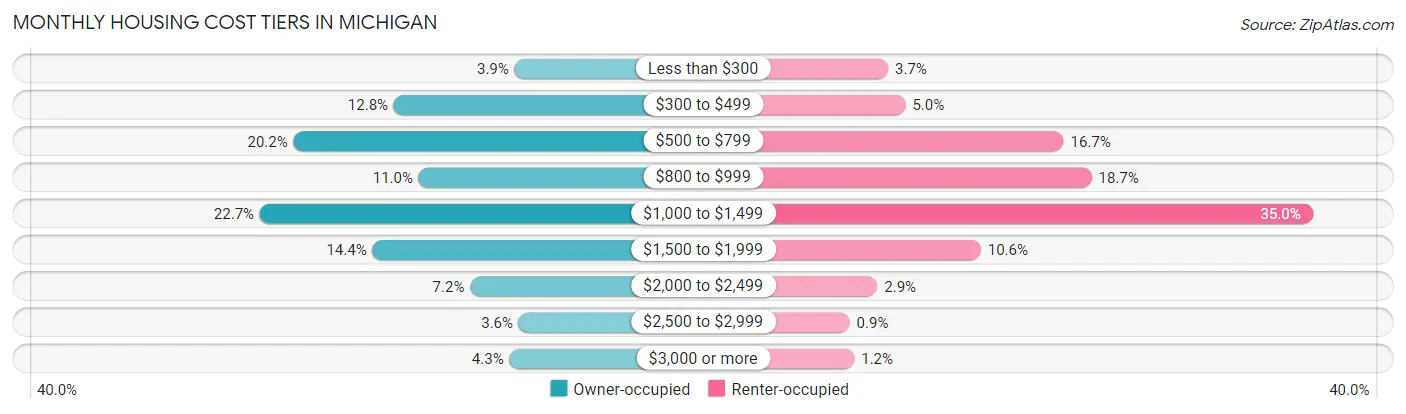
| Monthly Cost | Owner-occupied | Renter-occupied |
| Less than $300 | 113,748 (3.9%) | 41,104 (3.7%) |
| $300 to $499 | 372,123 (12.8%) | 55,292 (5.0%) |
| $500 to $799 | 586,708 (20.2%) | 183,746 (16.7%) |
| $800 to $999 | 318,904 (11.0%) | 206,436 (18.7%) |
| $1,000 to $1,499 | 658,917 (22.7%) | 385,891 (35.0%) |
| $1,500 to $1,999 | 418,004 (14.4%) | 116,507 (10.6%) |
| $2,000 to $2,499 | 208,686 (7.2%) | 32,451 (2.9%) |
| $2,500 to $2,999 | 104,717 (3.6%) | 9,970 (0.9%) |
| $3,000 or more | 124,663 (4.3%) | 13,673 (1.2%) |
| Total | 2,906,470 (100.0%) | 1,102,783 (100.0%) |
Physical Housing Characteristics in Michigan
Housing Structures in Michigan
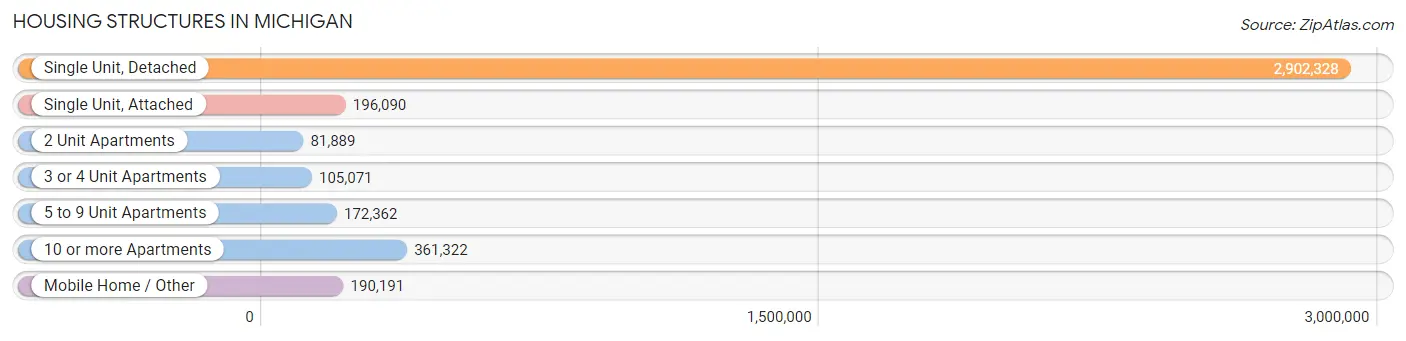
| Structure Type | # Housing Units | % Housing Units |
| Single Unit, Detached | 2,902,328 | 72.4% |
| Single Unit, Attached | 196,090 | 4.9% |
| 2 Unit Apartments | 81,889 | 2.0% |
| 3 or 4 Unit Apartments | 105,071 | 2.6% |
| 5 to 9 Unit Apartments | 172,362 | 4.3% |
| 10 or more Apartments | 361,322 | 9.0% |
| Mobile Home / Other | 190,191 | 4.7% |
| Total | 4,009,253 | 100.0% |
Housing Structures by Occupancy in Michigan
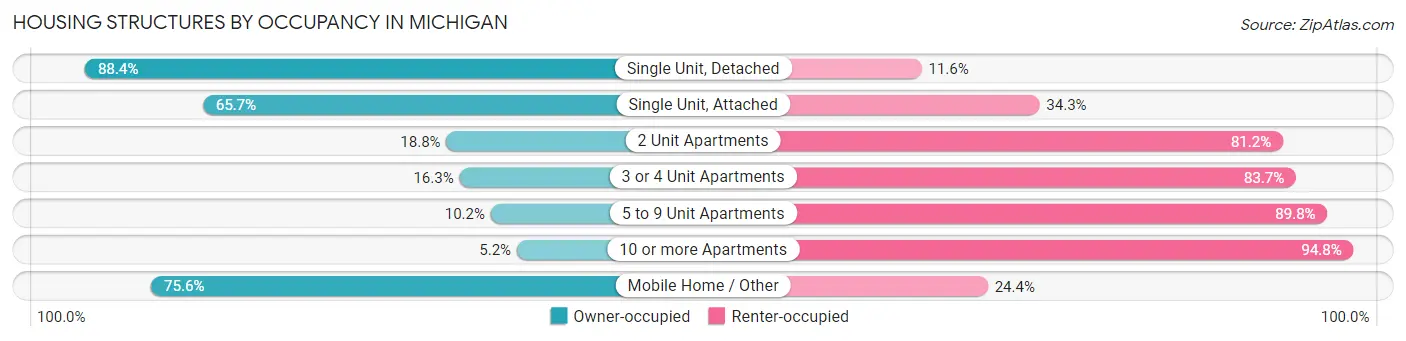
| Structure Type | Owner-occupied | Renter-occupied |
| Single Unit, Detached | 2,564,890 (88.4%) | 337,438 (11.6%) |
| Single Unit, Attached | 128,798 (65.7%) | 67,292 (34.3%) |
| 2 Unit Apartments | 15,389 (18.8%) | 66,500 (81.2%) |
| 3 or 4 Unit Apartments | 17,095 (16.3%) | 87,976 (83.7%) |
| 5 to 9 Unit Apartments | 17,648 (10.2%) | 154,714 (89.8%) |
| 10 or more Apartments | 18,813 (5.2%) | 342,509 (94.8%) |
| Mobile Home / Other | 143,837 (75.6%) | 46,354 (24.4%) |
| Total | 2,906,470 (72.5%) | 1,102,783 (27.5%) |
Housing Structures by Number of Rooms in Michigan
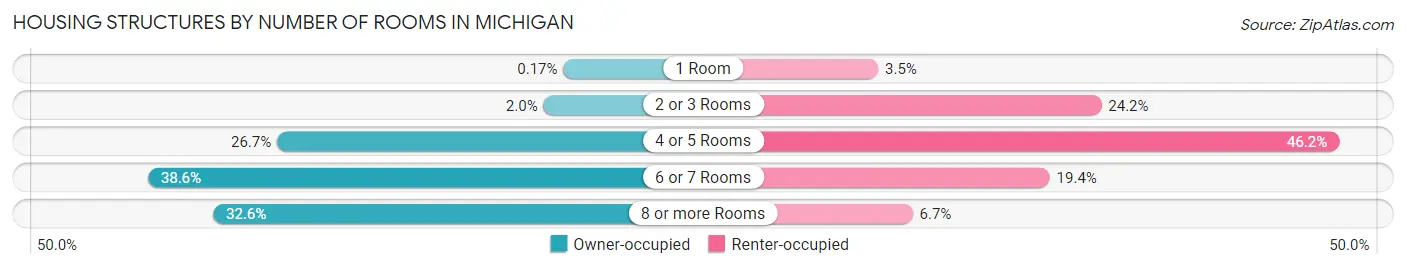
| Number of Rooms | Owner-occupied | Renter-occupied |
| 1 Room | 4,797 (0.2%) | 38,920 (3.5%) |
| 2 or 3 Rooms | 58,295 (2.0%) | 266,640 (24.2%) |
| 4 or 5 Rooms | 774,704 (26.7%) | 509,081 (46.2%) |
| 6 or 7 Rooms | 1,121,897 (38.6%) | 213,981 (19.4%) |
| 8 or more Rooms | 946,777 (32.6%) | 74,161 (6.7%) |
| Total | 2,906,470 (100.0%) | 1,102,783 (100.0%) |
Housing Structure by Heating Type in Michigan
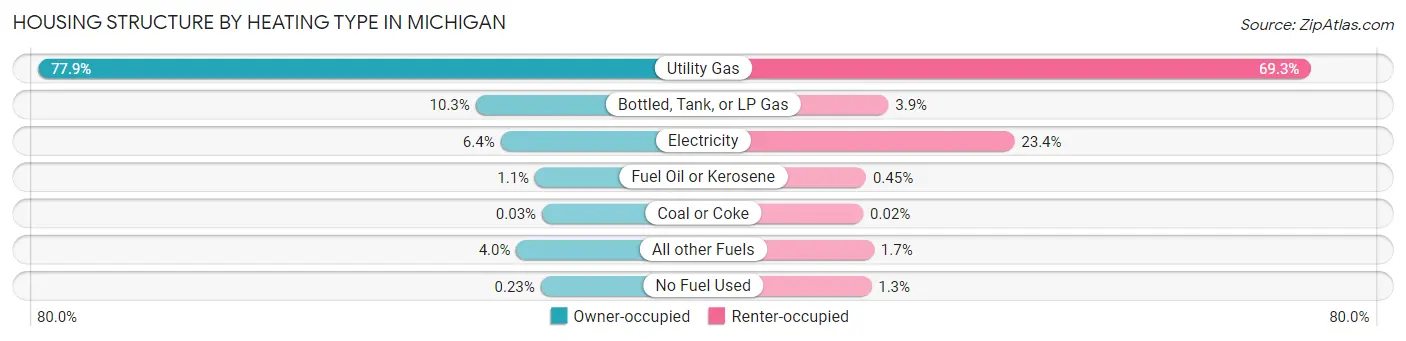
| Heating Type | Owner-occupied | Renter-occupied |
| Utility Gas | 2,265,147 (77.9%) | 763,884 (69.3%) |
| Bottled, Tank, or LP Gas | 298,913 (10.3%) | 43,157 (3.9%) |
| Electricity | 186,843 (6.4%) | 257,976 (23.4%) |
| Fuel Oil or Kerosene | 32,293 (1.1%) | 5,009 (0.4%) |
| Coal or Coke | 812 (0.0%) | 175 (0.0%) |
| All other Fuels | 115,823 (4.0%) | 18,579 (1.7%) |
| No Fuel Used | 6,639 (0.2%) | 14,003 (1.3%) |
| Total | 2,906,470 (100.0%) | 1,102,783 (100.0%) |
Household Vehicle Usage in Michigan
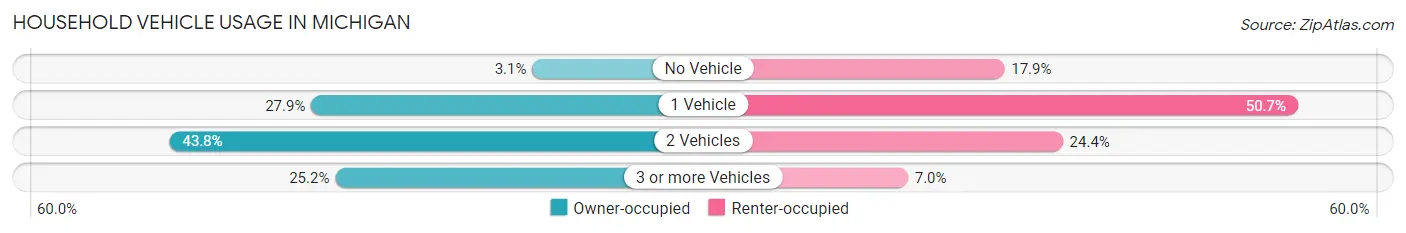
| Vehicles per Household | Owner-occupied | Renter-occupied |
| No Vehicle | 91,021 (3.1%) | 196,830 (17.8%) |
| 1 Vehicle | 810,722 (27.9%) | 559,394 (50.7%) |
| 2 Vehicles | 1,272,373 (43.8%) | 268,965 (24.4%) |
| 3 or more Vehicles | 732,354 (25.2%) | 77,594 (7.0%) |
| Total | 2,906,470 (100.0%) | 1,102,783 (100.0%) |
Real Estate & Mortgages in Michigan
Real Estate and Mortgage Overview in Michigan
| Characteristic | Without Mortgage | With Mortgage |
| Housing Units | 1,192,790 | 1,713,680 |
| Median Property Value | $170,500 | $220,200 |
| Median Household Income | $61,033 | $434,361 |
| Monthly Housing Costs | $565 | $120,562 |
| Real Estate Taxes | $2,419 | $60,944 |
Property Value by Mortgage Status in Michigan
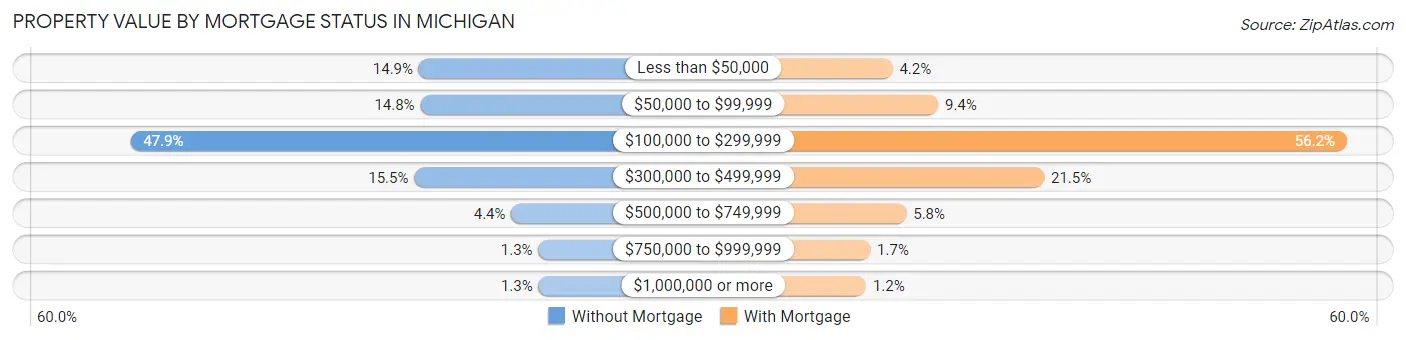
| Property Value | Without Mortgage | With Mortgage |
| Less than $50,000 | 178,257 (14.9%) | 72,360 (4.2%) |
| $50,000 to $99,999 | 176,022 (14.8%) | 161,593 (9.4%) |
| $100,000 to $299,999 | 571,724 (47.9%) | 962,223 (56.1%) |
| $300,000 to $499,999 | 184,381 (15.5%) | 369,163 (21.5%) |
| $500,000 to $749,999 | 52,067 (4.4%) | 99,320 (5.8%) |
| $750,000 to $999,999 | 15,315 (1.3%) | 28,666 (1.7%) |
| $1,000,000 or more | 15,024 (1.3%) | 20,355 (1.2%) |
| Total | 1,192,790 (100.0%) | 1,713,680 (100.0%) |
Household Income by Mortgage Status in Michigan
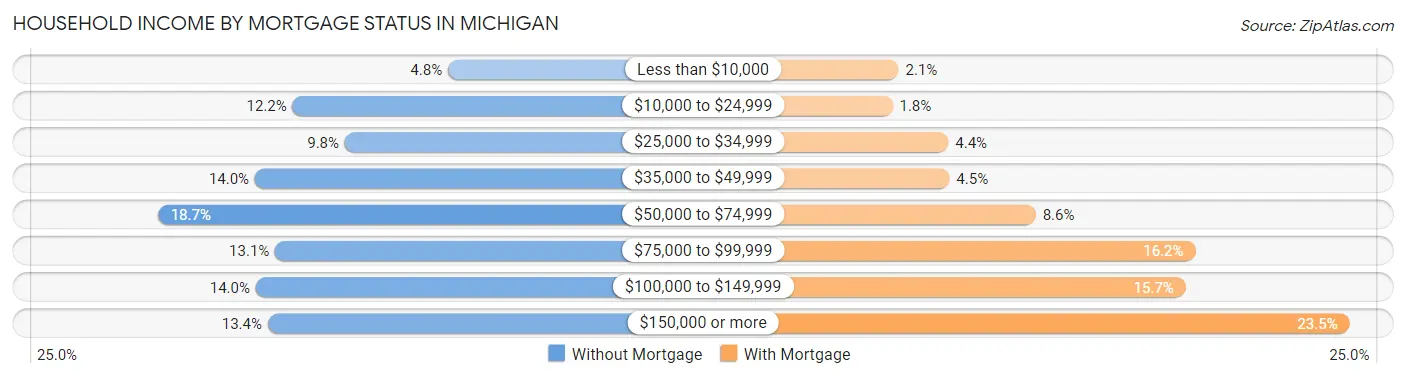
| Household Income | Without Mortgage | With Mortgage |
| Less than $10,000 | 57,689 (4.8%) | 35,103 (2.1%) |
| $10,000 to $24,999 | 145,963 (12.2%) | 30,246 (1.8%) |
| $25,000 to $34,999 | 116,271 (9.8%) | 75,754 (4.4%) |
| $35,000 to $49,999 | 167,396 (14.0%) | 76,552 (4.5%) |
| $50,000 to $74,999 | 222,620 (18.7%) | 146,992 (8.6%) |
| $75,000 to $99,999 | 155,877 (13.1%) | 277,295 (16.2%) |
| $100,000 to $149,999 | 166,882 (14.0%) | 269,432 (15.7%) |
| $150,000 or more | 160,092 (13.4%) | 403,048 (23.5%) |
| Total | 1,192,790 (100.0%) | 1,713,680 (100.0%) |
Property Value to Household Income Ratio in Michigan
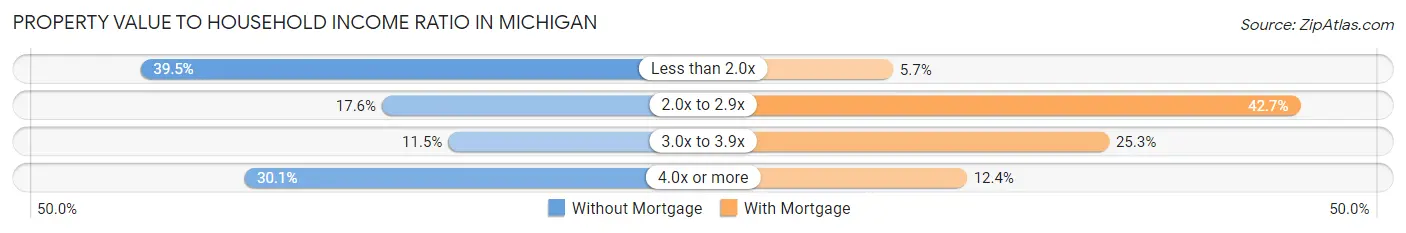
| Value-to-Income Ratio | Without Mortgage | With Mortgage |
| Less than 2.0x | 470,880 (39.5%) | 98,101 (5.7%) |
| 2.0x to 2.9x | 209,444 (17.6%) | 731,901 (42.7%) |
| 3.0x to 3.9x | 137,697 (11.5%) | 434,220 (25.3%) |
| 4.0x or more | 358,703 (30.1%) | 212,822 (12.4%) |
| Total | 1,192,790 (100.0%) | 1,713,680 (100.0%) |
Real Estate Taxes by Mortgage Status in Michigan
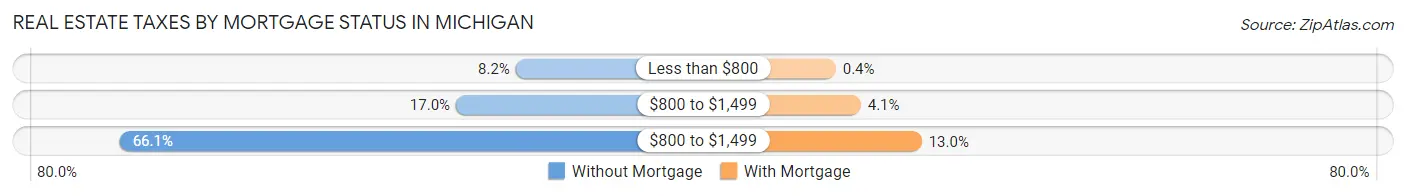
| Property Taxes | Without Mortgage | With Mortgage |
| Less than $800 | 98,332 (8.2%) | 6,882 (0.4%) |
| $800 to $1,499 | 202,572 (17.0%) | 69,444 (4.1%) |
| $800 to $1,499 | 788,376 (66.1%) | 222,020 (13.0%) |
| Total | 1,192,790 (100.0%) | 1,713,680 (100.0%) |
Health & Disability in Michigan
Health Insurance Coverage by Age in Michigan
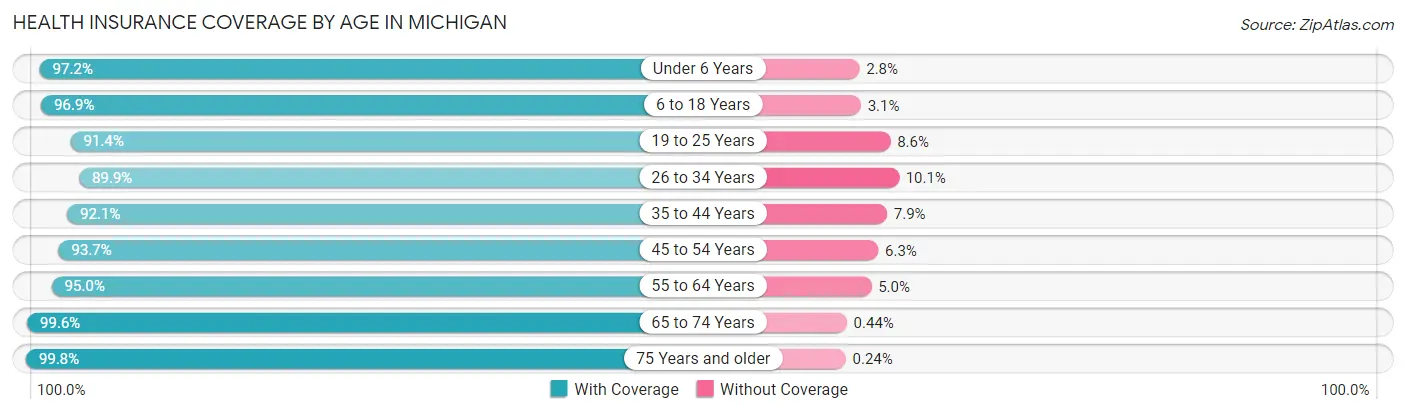
| Age Bracket | With Coverage | Without Coverage |
| Under 6 Years | 650,981 (97.2%) | 18,722 (2.8%) |
| 6 to 18 Years | 1,564,125 (96.9%) | 49,433 (3.1%) |
| 19 to 25 Years | 875,492 (91.4%) | 82,006 (8.6%) |
| 26 to 34 Years | 1,039,496 (89.9%) | 117,355 (10.1%) |
| 35 to 44 Years | 1,087,085 (92.1%) | 93,613 (7.9%) |
| 45 to 54 Years | 1,160,088 (93.7%) | 78,027 (6.3%) |
| 55 to 64 Years | 1,316,376 (95.0%) | 69,571 (5.0%) |
| 65 to 74 Years | 1,053,520 (99.6%) | 4,627 (0.4%) |
| 75 Years and older | 687,619 (99.8%) | 1,657 (0.2%) |
| Total | 9,434,782 (94.8%) | 515,011 (5.2%) |
Health Insurance Coverage by Citizenship Status in Michigan
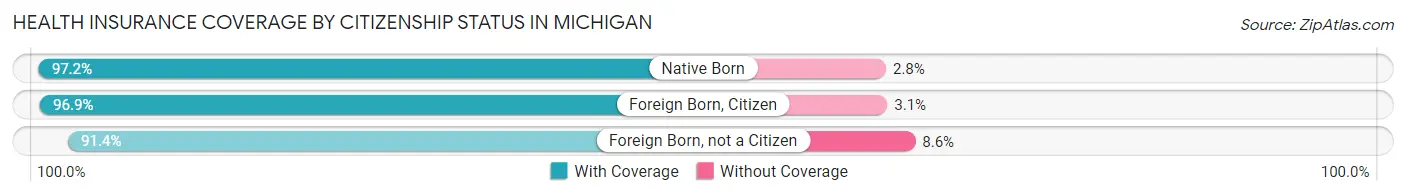
| Citizenship Status | With Coverage | Without Coverage |
| Native Born | 650,981 (97.2%) | 18,722 (2.8%) |
| Foreign Born, Citizen | 1,564,125 (96.9%) | 49,433 (3.1%) |
| Foreign Born, not a Citizen | 875,492 (91.4%) | 82,006 (8.6%) |
Health Insurance Coverage by Household Income in Michigan
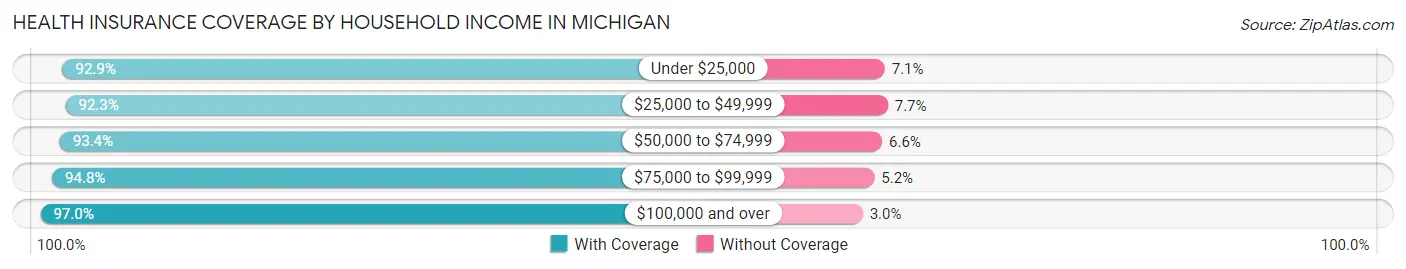
| Household Income | With Coverage | Without Coverage |
| Under $25,000 | 1,072,679 (92.9%) | 82,190 (7.1%) |
| $25,000 to $49,999 | 1,512,498 (92.3%) | 125,735 (7.7%) |
| $50,000 to $74,999 | 1,513,337 (93.4%) | 107,036 (6.6%) |
| $75,000 to $99,999 | 1,345,054 (94.8%) | 73,353 (5.2%) |
| $100,000 and over | 3,884,646 (97.0%) | 119,366 (3.0%) |
Public vs Private Health Insurance Coverage by Age in Michigan
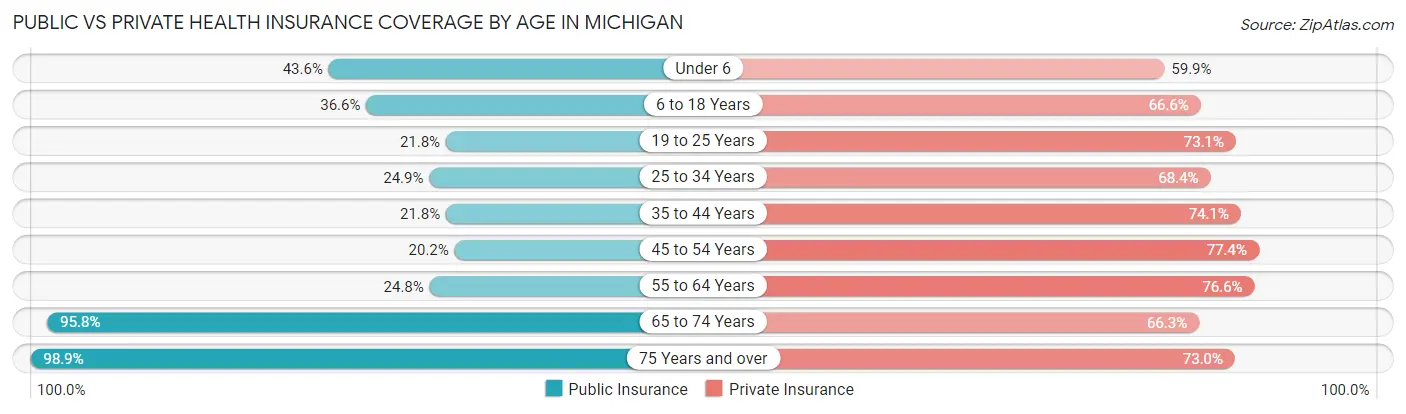
| Age Bracket | Public Insurance | Private Insurance |
| Under 6 | 291,653 (43.5%) | 400,946 (59.9%) |
| 6 to 18 Years | 590,272 (36.6%) | 1,074,717 (66.6%) |
| 19 to 25 Years | 208,643 (21.8%) | 700,324 (73.1%) |
| 25 to 34 Years | 287,911 (24.9%) | 791,460 (68.4%) |
| 35 to 44 Years | 257,130 (21.8%) | 874,473 (74.1%) |
| 45 to 54 Years | 249,893 (20.2%) | 958,339 (77.4%) |
| 55 to 64 Years | 343,952 (24.8%) | 1,061,429 (76.6%) |
| 65 to 74 Years | 1,013,970 (95.8%) | 701,688 (66.3%) |
| 75 Years and over | 681,894 (98.9%) | 502,859 (73.0%) |
| Total | 3,925,318 (39.5%) | 7,066,235 (71.0%) |
Disability Status by Sex by Age in Michigan
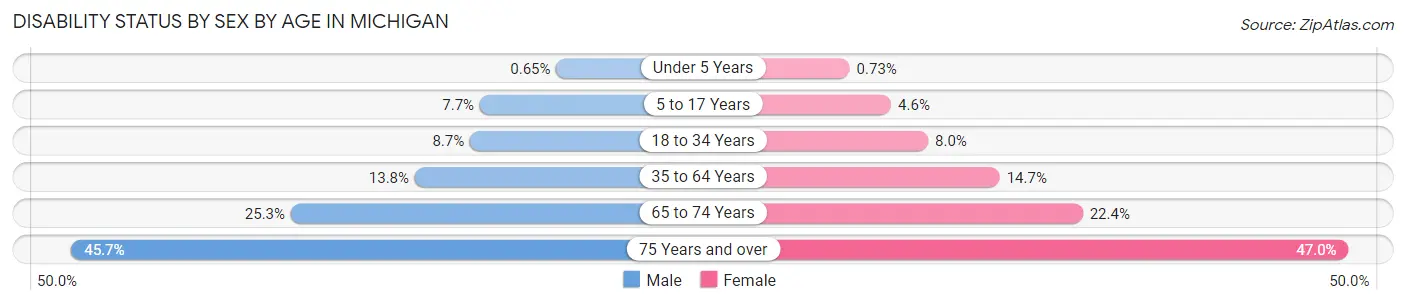
| Age Bracket | Male | Female |
| Under 5 Years | 1,828 (0.6%) | 1,977 (0.7%) |
| 5 to 17 Years | 63,321 (7.7%) | 35,588 (4.6%) |
| 18 to 34 Years | 98,816 (8.7%) | 88,854 (8.0%) |
| 35 to 64 Years | 259,863 (13.8%) | 281,428 (14.7%) |
| 65 to 74 Years | 127,251 (25.3%) | 124,074 (22.4%) |
| 75 Years and over | 131,517 (45.7%) | 188,681 (47.0%) |
Disability Class by Sex by Age in Michigan
Disability Class: Hearing Difficulty
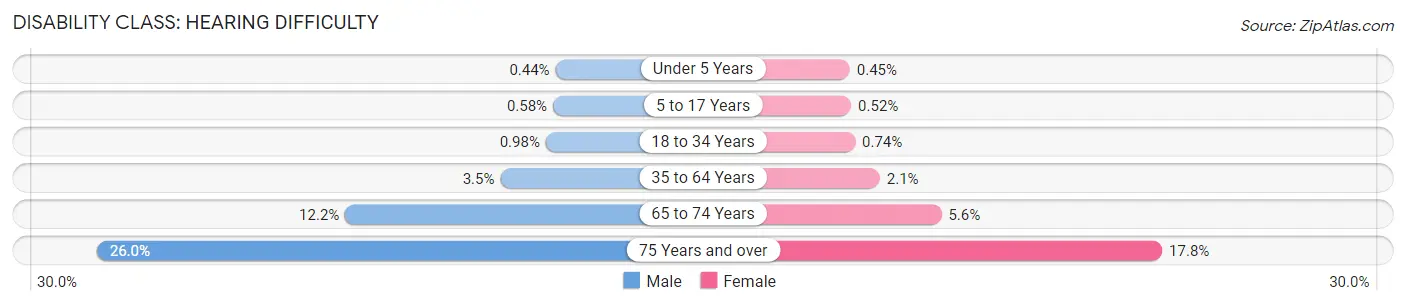
| Age Bracket | Male | Female |
| Under 5 Years | 1,254 (0.4%) | 1,211 (0.4%) |
| 5 to 17 Years | 4,744 (0.6%) | 4,024 (0.5%) |
| 18 to 34 Years | 11,205 (1.0%) | 8,179 (0.7%) |
| 35 to 64 Years | 66,229 (3.5%) | 40,629 (2.1%) |
| 65 to 74 Years | 61,149 (12.1%) | 30,798 (5.6%) |
| 75 Years and over | 74,831 (26.0%) | 71,603 (17.8%) |
Disability Class: Vision Difficulty
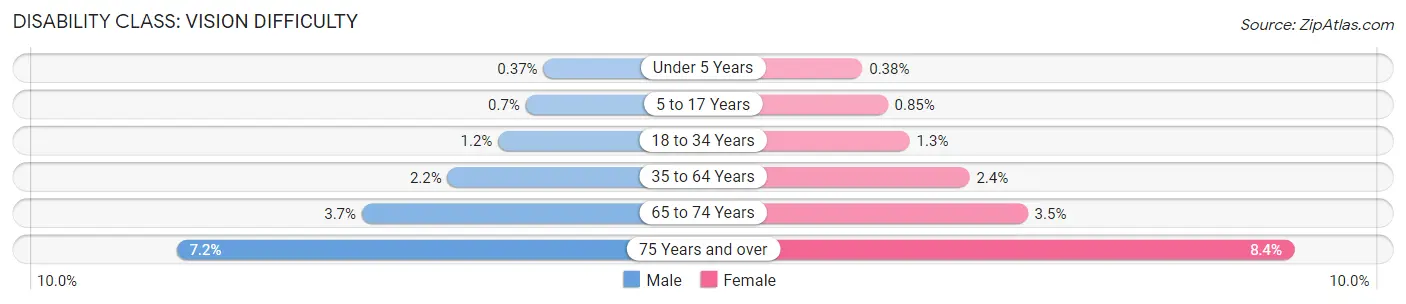
| Age Bracket | Male | Female |
| Under 5 Years | 1,054 (0.4%) | 1,018 (0.4%) |
| 5 to 17 Years | 5,741 (0.7%) | 6,636 (0.9%) |
| 18 to 34 Years | 13,832 (1.2%) | 13,978 (1.3%) |
| 35 to 64 Years | 40,553 (2.1%) | 45,485 (2.4%) |
| 65 to 74 Years | 18,839 (3.7%) | 19,129 (3.5%) |
| 75 Years and over | 20,675 (7.2%) | 33,656 (8.4%) |
Disability Class: Cognitive Difficulty
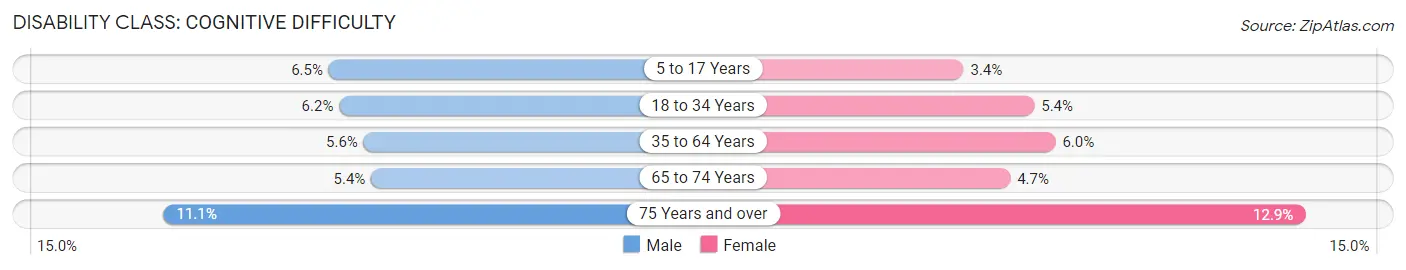
| Age Bracket | Male | Female |
| 5 to 17 Years | 53,423 (6.5%) | 26,351 (3.4%) |
| 18 to 34 Years | 71,214 (6.2%) | 59,523 (5.4%) |
| 35 to 64 Years | 104,763 (5.6%) | 114,130 (5.9%) |
| 65 to 74 Years | 26,906 (5.3%) | 26,001 (4.7%) |
| 75 Years and over | 32,063 (11.1%) | 51,771 (12.9%) |
Disability Class: Ambulatory Difficulty
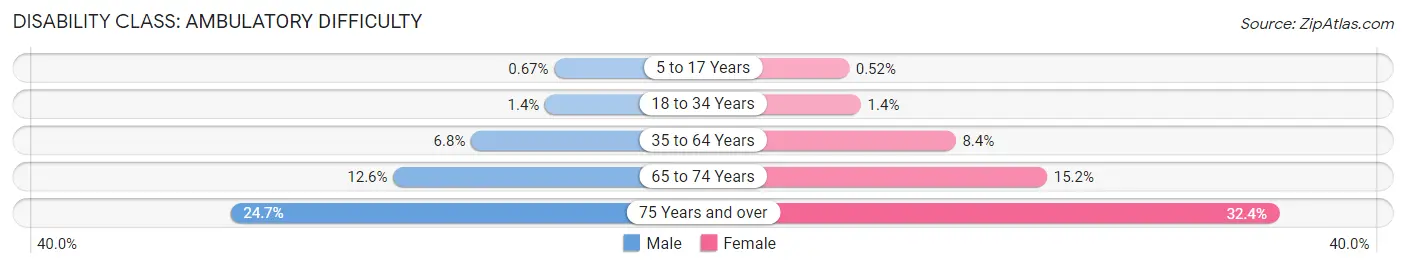
| Age Bracket | Male | Female |
| 5 to 17 Years | 5,444 (0.7%) | 4,027 (0.5%) |
| 18 to 34 Years | 15,430 (1.3%) | 15,534 (1.4%) |
| 35 to 64 Years | 128,986 (6.8%) | 162,067 (8.4%) |
| 65 to 74 Years | 63,501 (12.6%) | 84,455 (15.2%) |
| 75 Years and over | 71,201 (24.7%) | 130,177 (32.4%) |
Disability Class: Self-Care Difficulty
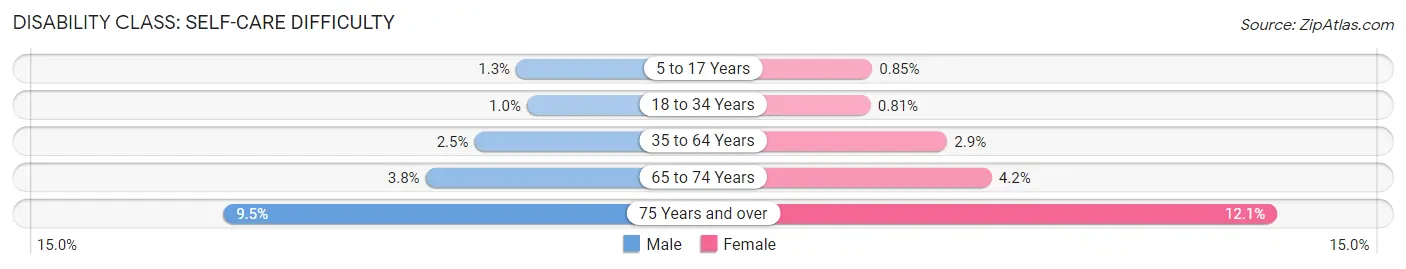
| Age Bracket | Male | Female |
| 5 to 17 Years | 10,832 (1.3%) | 6,590 (0.9%) |
| 18 to 34 Years | 11,690 (1.0%) | 9,013 (0.8%) |
| 35 to 64 Years | 46,683 (2.5%) | 56,468 (2.9%) |
| 65 to 74 Years | 19,342 (3.8%) | 23,212 (4.2%) |
| 75 Years and over | 27,286 (9.5%) | 48,643 (12.1%) |
Technology Access in Michigan
Computing Device Access in Michigan
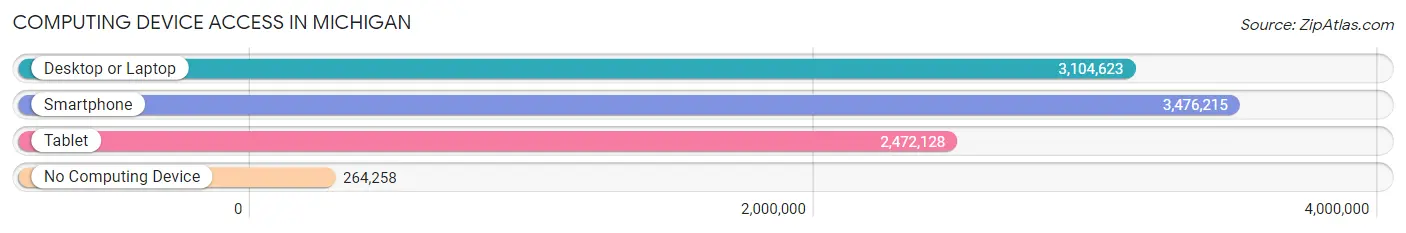
| Device Type | # Households | % Households |
| Desktop or Laptop | 3,104,623 | 77.4% |
| Smartphone | 3,476,215 | 86.7% |
| Tablet | 2,472,128 | 61.7% |
| No Computing Device | 264,258 | 6.6% |
| Total | 4,009,253 | 100.0% |
Internet Access in Michigan
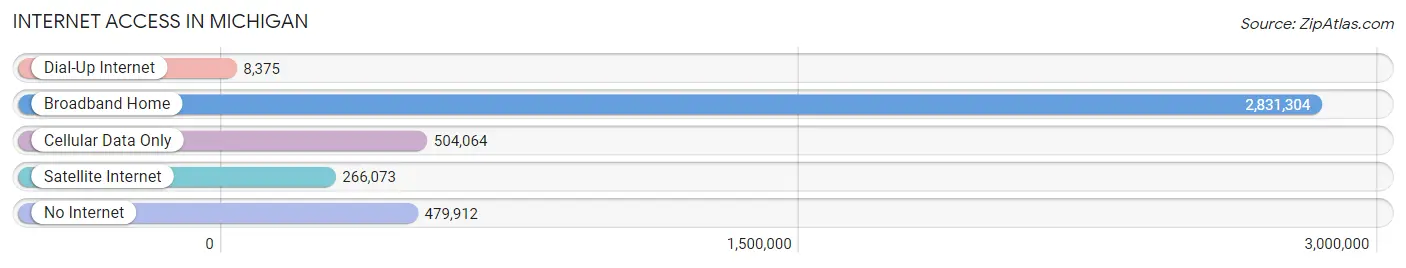
| Internet Type | # Households | % Households |
| Dial-Up Internet | 8,375 | 0.2% |
| Broadband Home | 2,831,304 | 70.6% |
| Cellular Data Only | 504,064 | 12.6% |
| Satellite Internet | 266,073 | 6.6% |
| No Internet | 479,912 | 12.0% |
| Total | 4,009,253 | 100.0% |
Michigan Summary
Michigan is a state located in the Great Lakes region of the United States. It is the tenth most populous state in the country, with a population of approximately 9.9 million people as of 2019. Michigan is bordered by four of the five Great Lakes, as well as the Canadian province of Ontario. It is the only state to be bordered by four of the five Great Lakes.
History
The history of Michigan dates back to the early 17th century, when French explorers first arrived in the area. The French established a trading post in the area in 1668, and the area was ceded to the British in 1763. The area was then ceded to the United States in 1783, and Michigan became a state in 1837.
Michigan has a long and varied history, and has played an important role in the development of the United States. During the 19th century, Michigan was a major center of the industrial revolution, and was home to many of the nation’s leading manufacturers. Michigan was also a major center of the labor movement, and was the birthplace of the United Auto Workers union.
Geography
Michigan is located in the Great Lakes region of the United States. It is bordered by four of the five Great Lakes, as well as the Canadian province of Ontario. Michigan is the only state to be bordered by four of the five Great Lakes.
Michigan is divided into two distinct regions: the Upper Peninsula and the Lower Peninsula. The Upper Peninsula is largely rural and sparsely populated, while the Lower Peninsula is more densely populated and home to the majority of the state’s population.
Michigan is home to a variety of landscapes, from the rolling hills of the Upper Peninsula to the flat plains of the Lower Peninsula. The state is also home to numerous rivers, lakes, and streams, as well as the Great Lakes.
Economy
The economy of Michigan is largely based on manufacturing and agriculture. The state is home to a number of major manufacturing companies, including General Motors, Ford, and Chrysler. Michigan is also home to a number of agricultural products, including corn, soybeans, and wheat.
Michigan is also home to a number of major universities, including the University of Michigan, Michigan State University, and Wayne State University. These universities are major economic drivers in the state, providing jobs and research opportunities.
Demographics
As of 2019, the population of Michigan was approximately 9.9 million people. The state is home to a diverse population, with the largest ethnic groups being White (78.3%), African American (14.2%), and Hispanic or Latino (5.2%).
The median household income in Michigan is $54,909, and the median home value is $169,000. The state has a poverty rate of 14.2%, and the unemployment rate is 4.3%.
Conclusion
Michigan is a state located in the Great Lakes region of the United States. It is the tenth most populous state in the country, with a population of approximately 9.9 million people as of 2019. Michigan is bordered by four of the five Great Lakes, as well as the Canadian province of Ontario. It is the only state to be bordered by four of the five Great Lakes.
The economy of Michigan is largely based on manufacturing and agriculture. The state is home to a number of major manufacturing companies, as well as a variety of agricultural products. Michigan is also home to a number of major universities, which are major economic drivers in the state.
The population of Michigan is diverse, with the largest ethnic groups being White (78.3%), African American (14.2%), and Hispanic or Latino (5.2%). The median household income in Michigan is $54,909, and the median home value is $169,000. The state has a poverty rate of 14.2%, and the unemployment rate is 4.3%.
Common Questions
When was Michigan Incorporated?
Michigan was Incorporated into the Union on Jan 26, 1837.
What is the Total Area of Michigan?
Total Area of Michigan is 96,713 Square Miles.
What is the Total Land Area of Michigan?
Total Land Area of Michigan is 56,528 Square Miles.
What is the Total Water Area of Michigan?
Total Water Area of Michigan is 40,185 Square Miles.
What is the Average Elevation in Michigan?
Average Elevation in Michigan is 900 Feet.
What is the Highest Elevation in Michigan?
Highest Elevation in Michigan is 1,979 Feet.
What is the Lowest Elevation in Michigan?
Lowest Elevation in Michigan is 572 Feet.
What is the Population Density in Michigan?
Population Density in Michigan is 177.9 People per Square Mile.
What is Per Capita Income in Michigan?
Per Capita income in Michigan is $37,929.
What is the Median Family Income in Michigan?
Median Family Income in Michigan is $87,221.
What is the Median Household income in Michigan?
Median Household Income in Michigan is $68,505.
What is Income or Wage Gap in Michigan?
Income or Wage Gap in Michigan is 31.6%.
Women in Michigan earn 68.4 cents for every dollar earned by a man.
What is Family Income Deficit in Michigan?
Family Income Deficit in Michigan is $11,099.
Families that are below poverty line in Michigan earn $11,099 less on average than the poverty threshold level.
What is Inequality or Gini Index in Michigan?
Inequality or Gini Index in Michigan is 0.46.
What is the Total Population of Michigan?
Total Population of Michigan is 10,057,921.
What is the Total Male Population of Michigan?
Total Male Population of Michigan is 4,993,696.
What is the Total Female Population of Michigan?
Total Female Population of Michigan is 5,064,225.
What is the Ratio of Males per 100 Females in Michigan?
There are 98.61 Males per 100 Females in Michigan.
What is the Ratio of Females per 100 Males in Michigan?
There are 101.41 Females per 100 Males in Michigan.
What is the Median Population Age in Michigan?
Median Population Age in Michigan is 39.9 Years.
What is the Average Family Size in Michigan
Average Family Size in Michigan is 3.1 People.
What is the Average Household Size in Michigan
Average Household Size in Michigan is 2.5 People.
How Large is the Labor Force in Michigan?
There are 5,022,353 People in the Labor Forcein in Michigan.
What is the Percentage of People in the Labor Force in Michigan?
61.5% of People are in the Labor Force in Michigan.
What is the Unemployment Rate in Michigan?
Unemployment Rate in Michigan is 6.0%.