Cities with the Highest Percentage of Population Employed in Installation, Maintenance & Repair in Tennessee
RELATED REPORTS & OPTIONS
Installation, Maintenance & Repair
Tennessee
Compare Cities
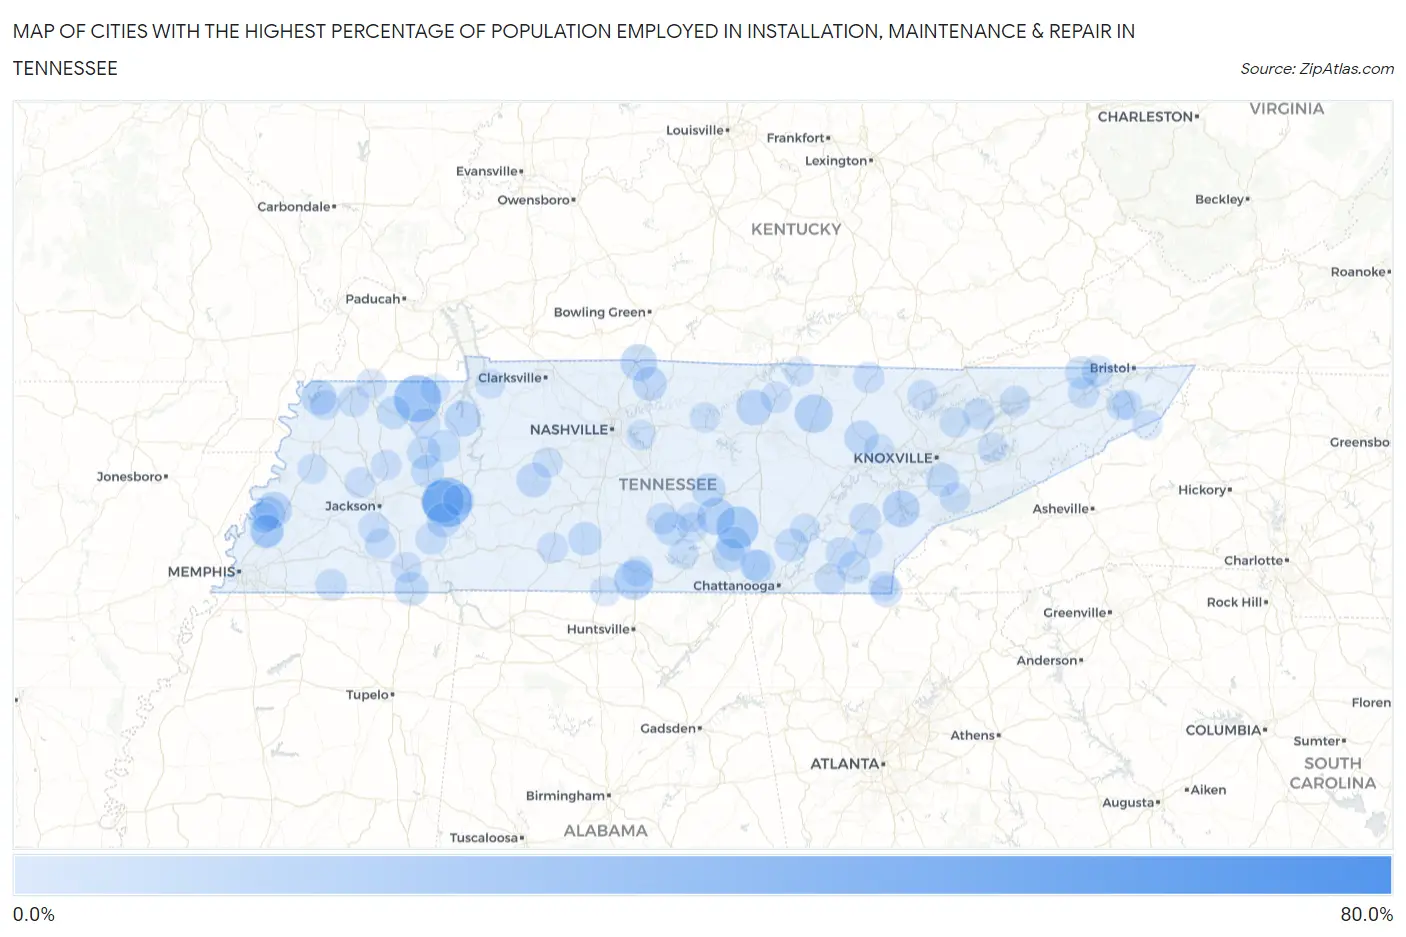
Map of Cities with the Highest Percentage of Population Employed in Installation, Maintenance & Repair in Tennessee
0.0%
80.0%
Cities with the Highest Percentage of Population Employed in Installation, Maintenance & Repair in Tennessee
| City | % Employed | vs State | vs National | |
| 1. | Nixon | 62.2% | 3.3%(+58.9)#1 | 3.1%(+59.1)#40 |
| 2. | Orebank | 30.2% | 3.3%(+26.9)#2 | 3.1%(+27.1)#280 |
| 3. | Darden | 27.3% | 3.3%(+24.0)#3 | 3.1%(+24.3)#346 |
| 4. | Cottage Grove | 25.0% | 3.3%(+21.7)#4 | 3.1%(+21.9)#423 |
| 5. | Counce | 23.2% | 3.3%(+19.9)#5 | 3.1%(+20.1)#488 |
| 6. | Mayland | 23.0% | 3.3%(+19.7)#6 | 3.1%(+20.0)#500 |
| 7. | Dellrose | 21.6% | 3.3%(+18.3)#7 | 3.1%(+18.6)#564 |
| 8. | Shiloh | 20.8% | 3.3%(+17.4)#8 | 3.1%(+17.7)#622 |
| 9. | Big Rock | 20.2% | 3.3%(+16.9)#9 | 3.1%(+17.1)#661 |
| 10. | Chesterfield | 19.8% | 3.3%(+16.5)#10 | 3.1%(+16.8)#687 |
| 11. | Beersheba Springs | 19.5% | 3.3%(+16.2)#11 | 3.1%(+16.4)#705 |
| 12. | Greenvale | 18.6% | 3.3%(+15.3)#12 | 3.1%(+15.5)#763 |
| 13. | Park City | 16.6% | 3.3%(+13.2)#13 | 3.1%(+13.5)#964 |
| 14. | Ocoee | 16.2% | 3.3%(+12.8)#14 | 3.1%(+13.1)#1,004 |
| 15. | Grimsley | 15.5% | 3.3%(+12.2)#15 | 3.1%(+12.4)#1,072 |
| 16. | Bogota | 15.3% | 3.3%(+11.9)#16 | 3.1%(+12.2)#1,114 |
| 17. | Viola | 14.8% | 3.3%(+11.5)#17 | 3.1%(+11.7)#1,188 |
| 18. | Chewalla | 14.3% | 3.3%(+11.0)#18 | 3.1%(+11.2)#1,276 |
| 19. | Vonore | 14.2% | 3.3%(+10.9)#19 | 3.1%(+11.1)#1,300 |
| 20. | Mcdonald | 13.5% | 3.3%(+10.2)#20 | 3.1%(+10.4)#1,446 |
| 21. | Mitchellville | 13.5% | 3.3%(+10.2)#21 | 3.1%(+10.4)#1,449 |
| 22. | Garland | 13.2% | 3.3%(+9.93)#22 | 3.1%(+10.2)#1,505 |
| 23. | Big Sandy | 13.0% | 3.3%(+9.64)#23 | 3.1%(+9.89)#1,583 |
| 24. | Dodson Branch | 12.6% | 3.3%(+9.26)#24 | 3.1%(+9.51)#1,671 |
| 25. | Samburg | 11.9% | 3.3%(+8.59)#25 | 3.1%(+8.84)#1,856 |
| 26. | Centerville | 11.5% | 3.3%(+8.17)#26 | 3.1%(+8.41)#1,990 |
| 27. | Graball | 11.3% | 3.3%(+7.96)#27 | 3.1%(+8.20)#2,059 |
| 28. | Coalmont | 11.3% | 3.3%(+7.94)#28 | 3.1%(+8.18)#2,061 |
| 29. | Scotts Hill | 11.0% | 3.3%(+7.68)#29 | 3.1%(+7.92)#2,146 |
| 30. | Wartburg | 11.0% | 3.3%(+7.68)#30 | 3.1%(+7.92)#2,148 |
| 31. | Guys | 11.0% | 3.3%(+7.66)#31 | 3.1%(+7.91)#2,152 |
| 32. | Burlison | 10.8% | 3.3%(+7.52)#32 | 3.1%(+7.77)#2,203 |
| 33. | Lynnville | 10.7% | 3.3%(+7.36)#33 | 3.1%(+7.60)#2,261 |
| 34. | Hilham | 10.6% | 3.3%(+7.31)#34 | 3.1%(+7.56)#2,275 |
| 35. | Centertown | 10.4% | 3.3%(+7.14)#35 | 3.1%(+7.38)#2,352 |
| 36. | Tracy City | 10.4% | 3.3%(+7.04)#36 | 3.1%(+7.29)#2,390 |
| 37. | Normandy | 10.3% | 3.3%(+7.03)#37 | 3.1%(+7.28)#2,401 |
| 38. | Wildwood | 10.3% | 3.3%(+7.03)#38 | 3.1%(+7.27)#2,403 |
| 39. | Flat Top Mountain | 10.3% | 3.3%(+6.99)#39 | 3.1%(+7.23)#2,420 |
| 40. | Dresden | 10.2% | 3.3%(+6.93)#40 | 3.1%(+7.17)#2,452 |
| 41. | Huntingdon | 10.2% | 3.3%(+6.87)#41 | 3.1%(+7.11)#2,477 |
| 42. | Clarksburg | 10.0% | 3.3%(+6.69)#42 | 3.1%(+6.93)#2,541 |
| 43. | Delano | 9.9% | 3.3%(+6.56)#43 | 3.1%(+6.80)#2,632 |
| 44. | Munford | 9.8% | 3.3%(+6.51)#44 | 3.1%(+6.76)#2,657 |
| 45. | Powells Crossroads | 9.7% | 3.3%(+6.40)#45 | 3.1%(+6.65)#2,724 |
| 46. | Atoka | 9.7% | 3.3%(+6.35)#46 | 3.1%(+6.59)#2,764 |
| 47. | Benton | 9.5% | 3.3%(+6.15)#47 | 3.1%(+6.39)#2,860 |
| 48. | Mount Carmel | 9.4% | 3.3%(+6.13)#48 | 3.1%(+6.37)#2,870 |
| 49. | Bruceton | 9.3% | 3.3%(+6.03)#49 | 3.1%(+6.27)#2,928 |
| 50. | Wartrace | 8.9% | 3.3%(+5.56)#50 | 3.1%(+5.80)#3,205 |
| 51. | Niota | 8.7% | 3.3%(+5.42)#51 | 3.1%(+5.66)#3,316 |
| 52. | Milledgeville | 8.7% | 3.3%(+5.34)#52 | 3.1%(+5.59)#3,385 |
| 53. | Copperhill | 8.6% | 3.3%(+5.26)#53 | 3.1%(+5.50)#3,443 |
| 54. | La Grange | 8.6% | 3.3%(+5.26)#54 | 3.1%(+5.50)#3,451 |
| 55. | Fall Branch | 8.4% | 3.3%(+5.12)#55 | 3.1%(+5.36)#3,564 |
| 56. | Bloomingdale | 8.4% | 3.3%(+5.07)#56 | 3.1%(+5.32)#3,597 |
| 57. | Charleston | 8.3% | 3.3%(+4.99)#57 | 3.1%(+5.24)#3,672 |
| 58. | Rutledge | 8.3% | 3.3%(+4.97)#58 | 3.1%(+5.21)#3,695 |
| 59. | Rives | 8.2% | 3.3%(+4.92)#59 | 3.1%(+5.17)#3,733 |
| 60. | Parsons | 8.1% | 3.3%(+4.83)#60 | 3.1%(+5.08)#3,810 |
| 61. | Livingston | 8.0% | 3.3%(+4.72)#61 | 3.1%(+4.96)#3,909 |
| 62. | Wildwood Lake | 8.0% | 3.3%(+4.71)#62 | 3.1%(+4.96)#3,916 |
| 63. | Gilt Edge | 8.0% | 3.3%(+4.64)#63 | 3.1%(+4.89)#3,969 |
| 64. | Oneida | 7.9% | 3.3%(+4.62)#64 | 3.1%(+4.87)#3,991 |
| 65. | Medon | 7.8% | 3.3%(+4.53)#65 | 3.1%(+4.78)#4,071 |
| 66. | Rocky Top | 7.7% | 3.3%(+4.39)#66 | 3.1%(+4.64)#4,183 |
| 67. | Whitwell | 7.6% | 3.3%(+4.31)#67 | 3.1%(+4.56)#4,295 |
| 68. | Selmer | 7.6% | 3.3%(+4.28)#68 | 3.1%(+4.52)#4,335 |
| 69. | Gadsden | 7.6% | 3.3%(+4.28)#69 | 3.1%(+4.52)#4,337 |
| 70. | Henry | 7.5% | 3.3%(+4.20)#70 | 3.1%(+4.44)#4,416 |
| 71. | Ethridge | 7.5% | 3.3%(+4.18)#71 | 3.1%(+4.42)#4,447 |
| 72. | Fayetteville | 7.5% | 3.3%(+4.17)#72 | 3.1%(+4.41)#4,452 |
| 73. | Mooresburg | 7.5% | 3.3%(+4.16)#73 | 3.1%(+4.41)#4,463 |
| 74. | Townsend | 7.4% | 3.3%(+4.12)#74 | 3.1%(+4.36)#4,501 |
| 75. | Silerton | 7.3% | 3.3%(+4.01)#75 | 3.1%(+4.25)#4,626 |
| 76. | Fincastle | 7.3% | 3.3%(+3.97)#76 | 3.1%(+4.21)#4,666 |
| 77. | Milan | 7.2% | 3.3%(+3.92)#77 | 3.1%(+4.16)#4,742 |
| 78. | Hornbeak | 7.1% | 3.3%(+3.83)#78 | 3.1%(+4.08)#4,820 |
| 79. | Central | 7.1% | 3.3%(+3.78)#79 | 3.1%(+4.02)#4,904 |
| 80. | Lyles | 7.1% | 3.3%(+3.75)#80 | 3.1%(+4.00)#4,933 |
| 81. | South Carthage | 7.1% | 3.3%(+3.75)#81 | 3.1%(+3.99)#4,946 |
| 82. | Luttrell | 7.0% | 3.3%(+3.73)#82 | 3.1%(+3.97)#4,964 |
| 83. | Lynchburg | 7.0% | 3.3%(+3.70)#83 | 3.1%(+3.94)#4,991 |
| 84. | Manchester | 7.0% | 3.3%(+3.70)#84 | 3.1%(+3.94)#4,994 |
| 85. | Coalfield | 7.0% | 3.3%(+3.65)#85 | 3.1%(+3.90)#5,041 |
| 86. | Puryear | 6.9% | 3.3%(+3.62)#86 | 3.1%(+3.86)#5,064 |
| 87. | Ducktown | 6.9% | 3.3%(+3.61)#87 | 3.1%(+3.86)#5,073 |
| 88. | Ardmore | 6.9% | 3.3%(+3.61)#88 | 3.1%(+3.85)#5,083 |
| 89. | Etowah | 6.9% | 3.3%(+3.60)#89 | 3.1%(+3.84)#5,094 |
| 90. | Dandridge | 6.8% | 3.3%(+3.52)#90 | 3.1%(+3.77)#5,204 |
| 91. | Estill Springs | 6.8% | 3.3%(+3.52)#91 | 3.1%(+3.76)#5,209 |
| 92. | Halls | 6.8% | 3.3%(+3.51)#92 | 3.1%(+3.75)#5,225 |
| 93. | Elizabethton | 6.8% | 3.3%(+3.49)#93 | 3.1%(+3.74)#5,258 |
| 94. | Roan Mountain | 6.8% | 3.3%(+3.45)#94 | 3.1%(+3.70)#5,311 |
| 95. | Rural Hill | 6.7% | 3.3%(+3.44)#95 | 3.1%(+3.68)#5,324 |
| 96. | Dover | 6.7% | 3.3%(+3.41)#96 | 3.1%(+3.66)#5,360 |
| 97. | Graysville | 6.7% | 3.3%(+3.37)#97 | 3.1%(+3.61)#5,415 |
| 98. | New Union | 6.7% | 3.3%(+3.36)#98 | 3.1%(+3.61)#5,421 |
| 99. | Byrdstown | 6.7% | 3.3%(+3.36)#99 | 3.1%(+3.60)#5,431 |
| 100. | South Fulton | 6.7% | 3.3%(+3.34)#100 | 3.1%(+3.59)#5,474 |
Common Questions
What are the Top 10 Cities with the Highest Percentage of Population Employed in Installation, Maintenance & Repair in Tennessee?
Top 10 Cities with the Highest Percentage of Population Employed in Installation, Maintenance & Repair in Tennessee are:
#1
27.3%
#2
25.0%
#3
19.8%
#4
19.5%
#5
16.6%
#6
15.5%
#7
14.8%
#8
14.2%
#9
13.5%
#10
13.2%
What city has the Highest Percentage of Population Employed in Installation, Maintenance & Repair in Tennessee?
Darden has the Highest Percentage of Population Employed in Installation, Maintenance & Repair in Tennessee with 27.3%.
What is the Percentage of Population Employed in Installation, Maintenance & Repair in the State of Tennessee?
Percentage of Population Employed in Installation, Maintenance & Repair in Tennessee is 3.3%.
What is the Percentage of Population Employed in Installation, Maintenance & Repair in the United States?
Percentage of Population Employed in Installation, Maintenance & Repair in the United States is 3.1%.