Cities with the Highest Percentage of Population Employed in Installation, Maintenance & Repair in Utah
RELATED REPORTS & OPTIONS
Installation, Maintenance & Repair
Utah
Compare Cities
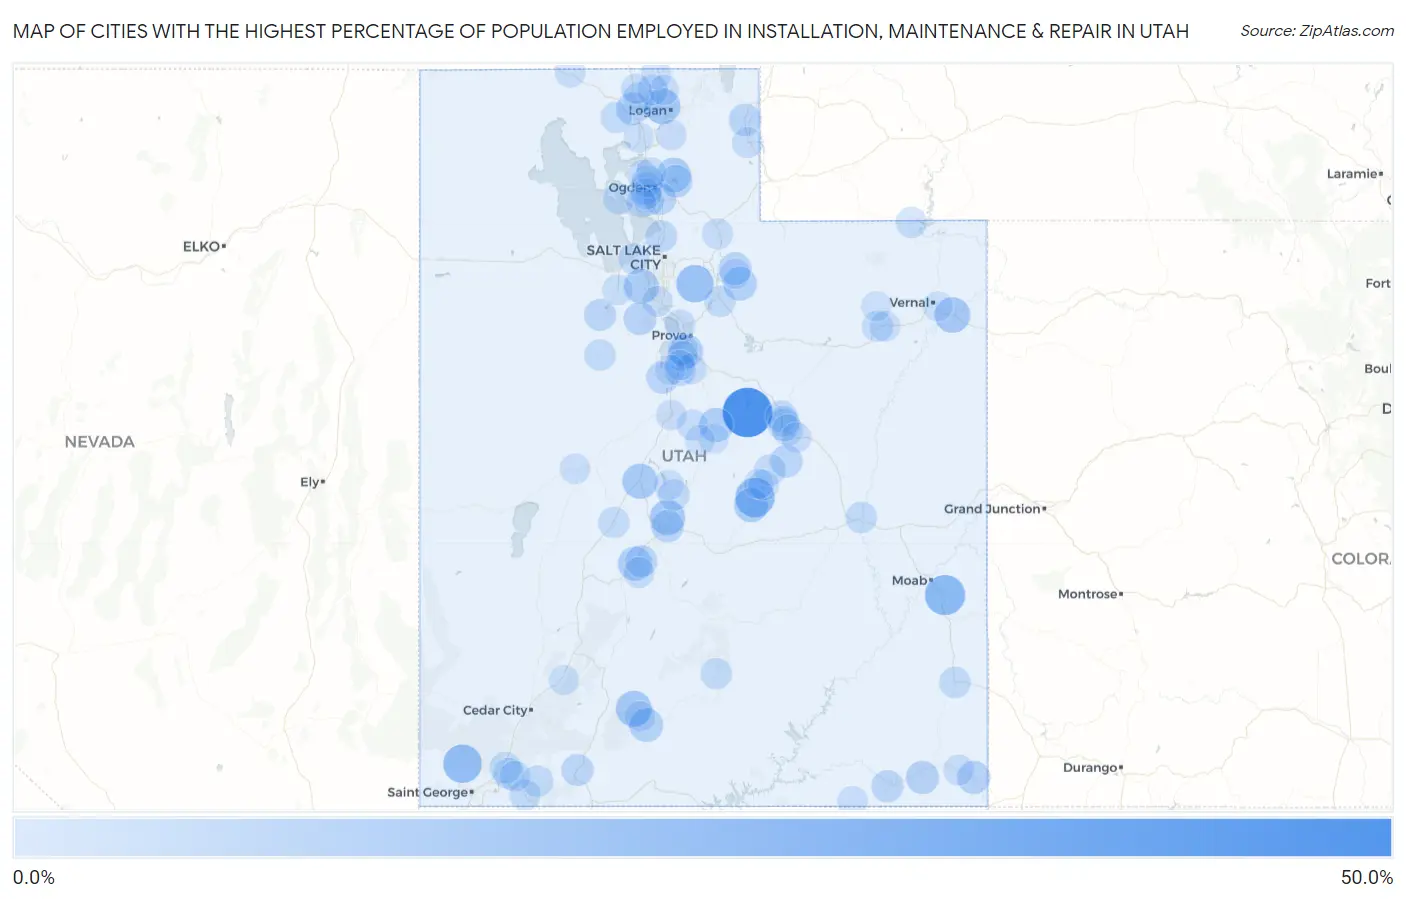
Map of Cities with the Highest Percentage of Population Employed in Installation, Maintenance & Repair in Utah
0.0%
50.0%
Cities with the Highest Percentage of Population Employed in Installation, Maintenance & Repair in Utah
| City | % Employed | vs State | vs National | |
| 1. | Scofield | 45.0% | 3.0%(+42.0)#1 | 3.1%(+41.9)#105 |
| 2. | Spanish Valley | 24.8% | 3.0%(+21.8)#2 | 3.1%(+21.7)#432 |
| 3. | Clawson | 23.1% | 3.0%(+20.0)#3 | 3.1%(+20.0)#496 |
| 4. | Dammeron Valley | 21.5% | 3.0%(+18.5)#4 | 3.1%(+18.5)#569 |
| 5. | Alta | 19.3% | 3.0%(+16.2)#5 | 3.1%(+16.2)#719 |
| 6. | Bryce Canyon City | 16.2% | 3.0%(+13.2)#6 | 3.1%(+13.1)#997 |
| 7. | Benson | 16.1% | 3.0%(+13.1)#7 | 3.1%(+13.1)#1,005 |
| 8. | Jensen | 15.6% | 3.0%(+12.6)#8 | 3.1%(+12.6)#1,057 |
| 9. | Redmond | 15.1% | 3.0%(+12.0)#9 | 3.1%(+12.0)#1,149 |
| 10. | Scipio | 14.9% | 3.0%(+11.9)#10 | 3.1%(+11.9)#1,174 |
| 11. | Copperton | 14.0% | 3.0%(+11.0)#11 | 3.1%(+10.9)#1,331 |
| 12. | Eden | 13.5% | 3.0%(+10.4)#12 | 3.1%(+10.4)#1,445 |
| 13. | Ferron | 13.0% | 3.0%(+9.98)#13 | 3.1%(+9.95)#1,568 |
| 14. | Fairview | 12.9% | 3.0%(+9.82)#14 | 3.1%(+9.79)#1,610 |
| 15. | Elsinore | 12.7% | 3.0%(+9.62)#15 | 3.1%(+9.59)#1,656 |
| 16. | Cannonville | 12.2% | 3.0%(+9.20)#16 | 3.1%(+9.16)#1,773 |
| 17. | Woodland | 11.9% | 3.0%(+8.87)#17 | 3.1%(+8.84)#1,853 |
| 18. | Palmyra | 11.8% | 3.0%(+8.76)#18 | 3.1%(+8.72)#1,887 |
| 19. | Aneth | 10.6% | 3.0%(+7.56)#19 | 3.1%(+7.52)#2,292 |
| 20. | Tselakai Dezza | 10.5% | 3.0%(+7.49)#20 | 3.1%(+7.46)#2,322 |
| 21. | Garland | 10.1% | 3.0%(+7.09)#21 | 3.1%(+7.05)#2,498 |
| 22. | Marion | 10.0% | 3.0%(+6.97)#22 | 3.1%(+6.93)#2,546 |
| 23. | Cedar Fort | 9.9% | 3.0%(+6.84)#23 | 3.1%(+6.81)#2,628 |
| 24. | Huntsville | 9.7% | 3.0%(+6.66)#24 | 3.1%(+6.62)#2,736 |
| 25. | Elmo | 9.4% | 3.0%(+6.32)#25 | 3.1%(+6.28)#2,924 |
| 26. | Salina | 9.2% | 3.0%(+6.22)#26 | 3.1%(+6.18)#2,974 |
| 27. | Goshen | 9.1% | 3.0%(+6.02)#27 | 3.1%(+5.98)#3,090 |
| 28. | Randolph | 9.0% | 3.0%(+5.99)#28 | 3.1%(+5.96)#3,105 |
| 29. | Uintah | 8.9% | 3.0%(+5.90)#29 | 3.1%(+5.86)#3,167 |
| 30. | West Haven | 8.7% | 3.0%(+5.67)#30 | 3.1%(+5.64)#3,338 |
| 31. | Central Valley | 8.6% | 3.0%(+5.60)#31 | 3.1%(+5.57)#3,393 |
| 32. | Halchita | 8.6% | 3.0%(+5.57)#32 | 3.1%(+5.53)#3,419 |
| 33. | Carbonville | 8.5% | 3.0%(+5.45)#33 | 3.1%(+5.41)#3,519 |
| 34. | Orderville | 8.3% | 3.0%(+5.30)#34 | 3.1%(+5.27)#3,632 |
| 35. | Rush Valley | 8.2% | 3.0%(+5.21)#35 | 3.1%(+5.17)#3,726 |
| 36. | Marriott Slaterville | 8.2% | 3.0%(+5.15)#36 | 3.1%(+5.12)#3,778 |
| 37. | Spring Lake | 8.1% | 3.0%(+5.06)#37 | 3.1%(+5.03)#3,858 |
| 38. | West Bountiful | 7.8% | 3.0%(+4.78)#38 | 3.1%(+4.75)#4,094 |
| 39. | Huntington | 7.5% | 3.0%(+4.49)#39 | 3.1%(+4.46)#4,397 |
| 40. | Toquerville | 7.5% | 3.0%(+4.48)#40 | 3.1%(+4.45)#4,410 |
| 41. | Helper | 7.4% | 3.0%(+4.38)#41 | 3.1%(+4.34)#4,513 |
| 42. | Green River | 7.4% | 3.0%(+4.35)#42 | 3.1%(+4.31)#4,541 |
| 43. | La Verkin | 7.3% | 3.0%(+4.31)#43 | 3.1%(+4.28)#4,585 |
| 44. | Monticello | 7.3% | 3.0%(+4.26)#44 | 3.1%(+4.23)#4,651 |
| 45. | Springdale | 7.3% | 3.0%(+4.24)#45 | 3.1%(+4.21)#4,674 |
| 46. | Gunnison | 7.3% | 3.0%(+4.24)#46 | 3.1%(+4.20)#4,690 |
| 47. | Vernon | 7.2% | 3.0%(+4.20)#47 | 3.1%(+4.16)#4,738 |
| 48. | Boulder | 7.1% | 3.0%(+4.05)#48 | 3.1%(+4.01)#4,920 |
| 49. | Sunset | 7.0% | 3.0%(+3.95)#49 | 3.1%(+3.92)#5,015 |
| 50. | Hooper | 6.9% | 3.0%(+3.88)#50 | 3.1%(+3.85)#5,086 |
| 51. | Daniel | 6.9% | 3.0%(+3.85)#51 | 3.1%(+3.82)#5,126 |
| 52. | Thatcher | 6.8% | 3.0%(+3.79)#52 | 3.1%(+3.76)#5,222 |
| 53. | Fillmore | 6.7% | 3.0%(+3.70)#53 | 3.1%(+3.66)#5,349 |
| 54. | Spring Glen | 6.7% | 3.0%(+3.65)#54 | 3.1%(+3.61)#5,414 |
| 55. | Apple Valley | 6.6% | 3.0%(+3.56)#55 | 3.1%(+3.53)#5,550 |
| 56. | Fielding | 6.6% | 3.0%(+3.56)#56 | 3.1%(+3.52)#5,559 |
| 57. | Roosevelt | 6.6% | 3.0%(+3.52)#57 | 3.1%(+3.49)#5,613 |
| 58. | Manila | 6.4% | 3.0%(+3.35)#58 | 3.1%(+3.32)#5,849 |
| 59. | Magna | 6.2% | 3.0%(+3.16)#59 | 3.1%(+3.13)#6,144 |
| 60. | Virgin | 6.1% | 3.0%(+3.11)#60 | 3.1%(+3.07)#6,235 |
| 61. | Vineyard | 6.1% | 3.0%(+3.06)#61 | 3.1%(+3.03)#6,306 |
| 62. | Coalville | 6.1% | 3.0%(+3.06)#62 | 3.1%(+3.02)#6,320 |
| 63. | Monroe | 6.1% | 3.0%(+3.05)#63 | 3.1%(+3.02)#6,323 |
| 64. | Roy | 6.1% | 3.0%(+3.05)#64 | 3.1%(+3.01)#6,333 |
| 65. | Montezuma Creek | 6.0% | 3.0%(+2.94)#65 | 3.1%(+2.90)#6,502 |
| 66. | Price | 5.9% | 3.0%(+2.82)#66 | 3.1%(+2.79)#6,718 |
| 67. | Fountain Green | 5.8% | 3.0%(+2.80)#67 | 3.1%(+2.77)#6,749 |
| 68. | Newton | 5.8% | 3.0%(+2.78)#68 | 3.1%(+2.74)#6,792 |
| 69. | Lake Shore | 5.8% | 3.0%(+2.75)#69 | 3.1%(+2.72)#6,831 |
| 70. | Bluffdale | 5.8% | 3.0%(+2.72)#70 | 3.1%(+2.69)#6,895 |
| 71. | Woodland Hills | 5.7% | 3.0%(+2.67)#71 | 3.1%(+2.64)#6,989 |
| 72. | Woodruff | 5.7% | 3.0%(+2.65)#72 | 3.1%(+2.61)#7,034 |
| 73. | Benjamin | 5.6% | 3.0%(+2.54)#73 | 3.1%(+2.50)#7,246 |
| 74. | Castle Dale | 5.5% | 3.0%(+2.47)#74 | 3.1%(+2.43)#7,394 |
| 75. | Ballard | 5.5% | 3.0%(+2.45)#75 | 3.1%(+2.42)#7,427 |
| 76. | Plain City | 5.5% | 3.0%(+2.42)#76 | 3.1%(+2.39)#7,490 |
| 77. | Nephi | 5.4% | 3.0%(+2.41)#77 | 3.1%(+2.37)#7,515 |
| 78. | Tooele | 5.3% | 3.0%(+2.31)#78 | 3.1%(+2.28)#7,717 |
| 79. | Paradise | 5.2% | 3.0%(+2.20)#79 | 3.1%(+2.17)#7,941 |
| 80. | Cornish | 5.2% | 3.0%(+2.18)#80 | 3.1%(+2.15)#7,972 |
| 81. | Amalga | 5.2% | 3.0%(+2.17)#81 | 3.1%(+2.13)#8,008 |
| 82. | Kamas | 5.2% | 3.0%(+2.13)#82 | 3.1%(+2.10)#8,086 |
| 83. | Tropic | 5.2% | 3.0%(+2.13)#83 | 3.1%(+2.09)#8,101 |
| 84. | Oljato Monument Valley | 5.1% | 3.0%(+2.09)#84 | 3.1%(+2.05)#8,180 |
| 85. | Snowville | 5.1% | 3.0%(+2.05)#85 | 3.1%(+2.02)#8,248 |
| 86. | Fayette | 5.0% | 3.0%(+1.97)#86 | 3.1%(+1.93)#8,459 |
| 87. | West Point | 5.0% | 3.0%(+1.96)#87 | 3.1%(+1.93)#8,481 |
| 88. | Hinckley | 5.0% | 3.0%(+1.94)#88 | 3.1%(+1.91)#8,513 |
| 89. | Wellington | 5.0% | 3.0%(+1.94)#89 | 3.1%(+1.91)#8,523 |
| 90. | Plymouth | 5.0% | 3.0%(+1.94)#90 | 3.1%(+1.90)#8,528 |
| 91. | Payson | 4.9% | 3.0%(+1.87)#91 | 3.1%(+1.83)#8,705 |
| 92. | Paragonah | 4.9% | 3.0%(+1.83)#92 | 3.1%(+1.79)#8,812 |
| 93. | Orangeville | 4.7% | 3.0%(+1.70)#93 | 3.1%(+1.66)#9,114 |
| 94. | Corinne | 4.7% | 3.0%(+1.66)#94 | 3.1%(+1.63)#9,209 |
| 95. | Mount Pleasant | 4.6% | 3.0%(+1.62)#95 | 3.1%(+1.58)#9,337 |
| 96. | Moroni | 4.6% | 3.0%(+1.60)#96 | 3.1%(+1.57)#9,370 |
| 97. | Neola | 4.6% | 3.0%(+1.56)#97 | 3.1%(+1.53)#9,459 |
| 98. | Genola | 4.6% | 3.0%(+1.54)#98 | 3.1%(+1.51)#9,519 |
| 99. | Naples | 4.5% | 3.0%(+1.51)#99 | 3.1%(+1.47)#9,646 |
| 100. | Pleasant View | 4.5% | 3.0%(+1.48)#100 | 3.1%(+1.45)#9,695 |
Common Questions
What are the Top 10 Cities with the Highest Percentage of Population Employed in Installation, Maintenance & Repair in Utah?
Top 10 Cities with the Highest Percentage of Population Employed in Installation, Maintenance & Repair in Utah are:
#1
45.0%
#2
24.8%
#3
23.1%
#4
21.5%
#5
19.3%
#6
16.2%
#7
16.1%
#8
15.6%
#9
15.1%
#10
14.9%
What city has the Highest Percentage of Population Employed in Installation, Maintenance & Repair in Utah?
Scofield has the Highest Percentage of Population Employed in Installation, Maintenance & Repair in Utah with 45.0%.
What is the Percentage of Population Employed in Installation, Maintenance & Repair in the State of Utah?
Percentage of Population Employed in Installation, Maintenance & Repair in Utah is 3.0%.
What is the Percentage of Population Employed in Installation, Maintenance & Repair in the United States?
Percentage of Population Employed in Installation, Maintenance & Repair in the United States is 3.1%.