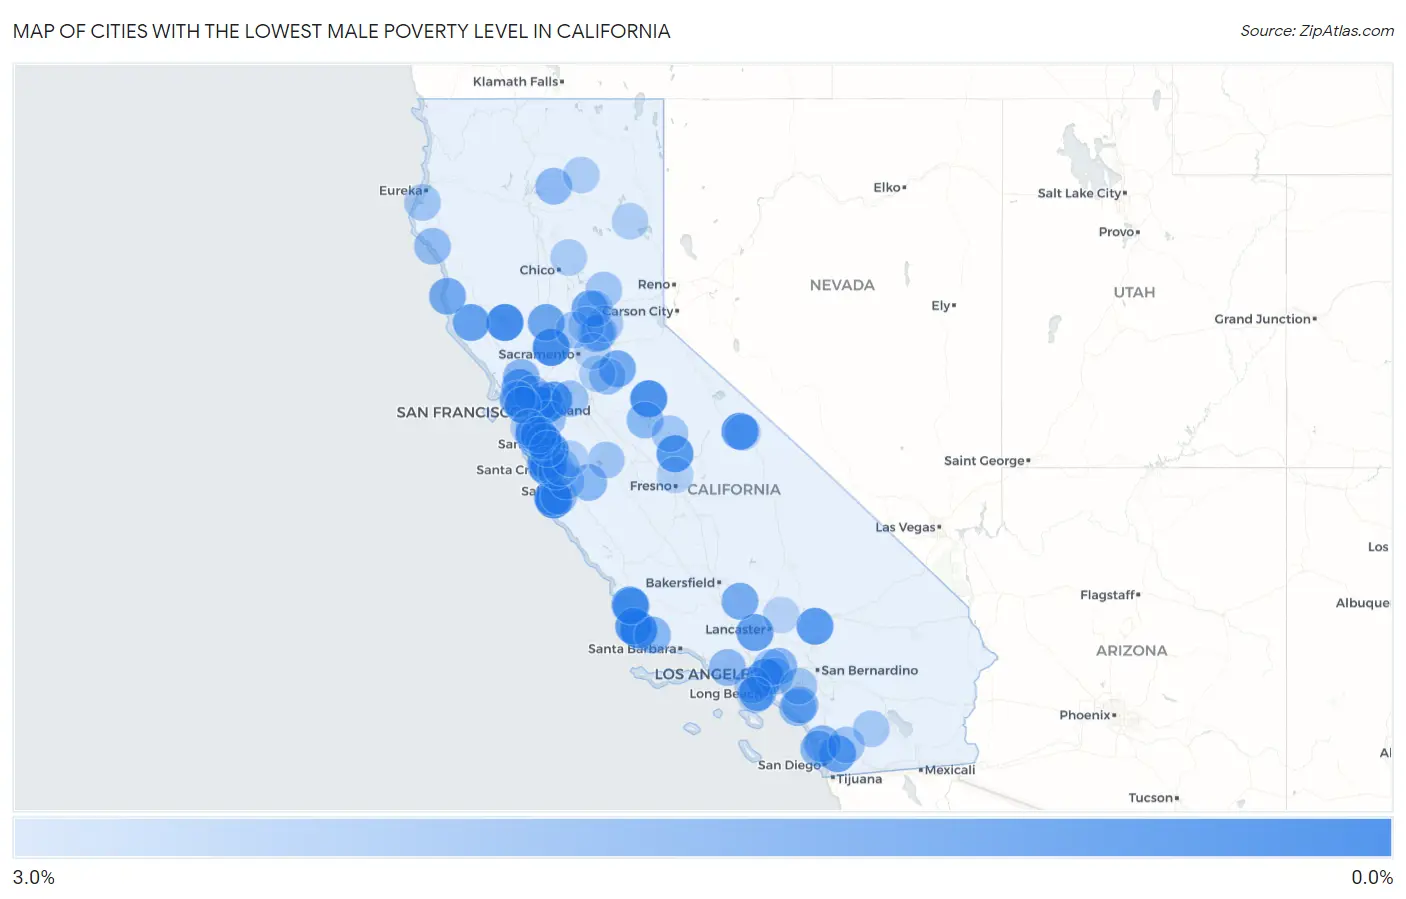
Cities with the Lowest Male Poverty Level in California
RELATED REPORTS & OPTIONS
Lowest Poverty | Male
California
Compare Cities
Map of Cities with the Lowest Male Poverty Level in California
3.0%
0.0%
Cities with the Lowest Male Poverty Level in California
| City | Male Poverty | vs State | vs National | |
| 1. | Monte Sereno | 0.28% | 11.1%(-10.8)#1 | 11.3%(-11.1)#46 |
| 2. | Carmel By The Sea | 0.53% | 11.1%(-10.5)#2 | 11.3%(-10.8)#159 |
| 3. | Madison | 0.56% | 11.1%(-10.5)#3 | 11.3%(-10.8)#176 |
| 4. | Soda Bay | 0.57% | 11.1%(-10.5)#4 | 11.3%(-10.8)#181 |
| 5. | Mission Hills | 0.69% | 11.1%(-10.4)#5 | 11.3%(-10.6)#258 |
| 6. | Tuolumne City | 0.70% | 11.1%(-10.4)#6 | 11.3%(-10.6)#263 |
| 7. | Swall Meadows | 0.82% | 11.1%(-10.2)#7 | 11.3%(-10.5)#353 |
| 8. | West Menlo Park | 0.82% | 11.1%(-10.2)#8 | 11.3%(-10.5)#354 |
| 9. | Vernon | 0.85% | 11.1%(-10.2)#9 | 11.3%(-10.5)#377 |
| 10. | Clayton | 0.92% | 11.1%(-10.1)#10 | 11.3%(-10.4)#427 |
| 11. | Yosemite Lakes | 0.94% | 11.1%(-10.1)#11 | 11.3%(-10.4)#439 |
| 12. | Callender | 0.94% | 11.1%(-10.1)#12 | 11.3%(-10.4)#445 |
| 13. | Baywood Park | 0.97% | 11.1%(-10.1)#13 | 11.3%(-10.4)#460 |
| 14. | Vandenberg Afb | 0.97% | 11.1%(-10.1)#14 | 11.3%(-10.4)#464 |
| 15. | Silver Lakes | 0.99% | 11.1%(-10.1)#15 | 11.3%(-10.4)#479 |
| 16. | Tiburon | 1.1% | 11.1%(-9.99)#16 | 11.3%(-10.3)#535 |
| 17. | Castle Hill | 1.1% | 11.1%(-9.98)#17 | 11.3%(-10.3)#545 |
| 18. | Rolling Hills Estates | 1.1% | 11.1%(-9.92)#18 | 11.3%(-10.2)#588 |
| 19. | Pasatiempo | 1.1% | 11.1%(-9.92)#19 | 11.3%(-10.2)#595 |
| 20. | Bayview Cdp Contra Costa County | 1.2% | 11.1%(-9.88)#20 | 11.3%(-10.2)#647 |
| 21. | Black Point Green Point | 1.2% | 11.1%(-9.87)#21 | 11.3%(-10.2)#648 |
| 22. | Boonville | 1.2% | 11.1%(-9.87)#22 | 11.3%(-10.1)#655 |
| 23. | Elizabeth Lake | 1.2% | 11.1%(-9.86)#23 | 11.3%(-10.1)#669 |
| 24. | Lompico | 1.2% | 11.1%(-9.83)#24 | 11.3%(-10.1)#699 |
| 25. | Rancho Mission Viejo | 1.3% | 11.1%(-9.81)#25 | 11.3%(-10.1)#716 |
| 26. | Los Altos Hills | 1.3% | 11.1%(-9.79)#26 | 11.3%(-10.1)#732 |
| 27. | Eucalyptus Hills | 1.3% | 11.1%(-9.76)#27 | 11.3%(-10.0)#757 |
| 28. | Smartsville | 1.4% | 11.1%(-9.69)#28 | 11.3%(-9.97)#820 |
| 29. | Scotts Valley | 1.4% | 11.1%(-9.69)#29 | 11.3%(-9.97)#825 |
| 30. | Arbuckle | 1.4% | 11.1%(-9.67)#30 | 11.3%(-9.95)#844 |
| 31. | Del Monte Forest | 1.4% | 11.1%(-9.65)#31 | 11.3%(-9.93)#859 |
| 32. | Sutter Creek | 1.5% | 11.1%(-9.58)#32 | 11.3%(-9.85)#924 |
| 33. | Caspar | 1.5% | 11.1%(-9.57)#33 | 11.3%(-9.85)#934 |
| 34. | Stallion Springs | 1.5% | 11.1%(-9.53)#34 | 11.3%(-9.81)#969 |
| 35. | Portola Valley | 1.5% | 11.1%(-9.52)#35 | 11.3%(-9.80)#975 |
| 36. | Emerald Lake Hills | 1.6% | 11.1%(-9.45)#36 | 11.3%(-9.73)#1,033 |
| 37. | Happy Valley | 1.7% | 11.1%(-9.37)#37 | 11.3%(-9.65)#1,131 |
| 38. | Rancho Santa Fe | 1.8% | 11.1%(-9.27)#38 | 11.3%(-9.55)#1,249 |
| 39. | Ladera | 1.8% | 11.1%(-9.27)#39 | 11.3%(-9.55)#1,254 |
| 40. | Loyola | 1.8% | 11.1%(-9.24)#40 | 11.3%(-9.52)#1,282 |
| 41. | Orinda | 1.9% | 11.1%(-9.19)#41 | 11.3%(-9.47)#1,336 |
| 42. | Temelec | 1.9% | 11.1%(-9.18)#42 | 11.3%(-9.46)#1,348 |
| 43. | Bradbury | 1.9% | 11.1%(-9.17)#43 | 11.3%(-9.45)#1,357 |
| 44. | Del Mar | 1.9% | 11.1%(-9.15)#44 | 11.3%(-9.43)#1,385 |
| 45. | Tres Pinos | 1.9% | 11.1%(-9.14)#45 | 11.3%(-9.42)#1,389 |
| 46. | Buellton | 1.9% | 11.1%(-9.14)#46 | 11.3%(-9.41)#1,399 |
| 47. | Lake Don Pedro | 2.0% | 11.1%(-9.11)#47 | 11.3%(-9.39)#1,425 |
| 48. | Amador Pines | 2.0% | 11.1%(-9.11)#48 | 11.3%(-9.38)#1,430 |
| 49. | Ladera Ranch | 2.0% | 11.1%(-9.09)#49 | 11.3%(-9.37)#1,447 |
| 50. | Lake Sherwood | 2.0% | 11.1%(-9.03)#50 | 11.3%(-9.31)#1,517 |
| 51. | Penryn | 2.0% | 11.1%(-9.02)#51 | 11.3%(-9.30)#1,525 |
| 52. | Coto De Caza | 2.0% | 11.1%(-9.02)#52 | 11.3%(-9.30)#1,533 |
| 53. | Montgomery Creek | 2.1% | 11.1%(-9.00)#53 | 11.3%(-9.28)#1,556 |
| 54. | San Carlos | 2.1% | 11.1%(-8.97)#54 | 11.3%(-9.25)#1,589 |
| 55. | Reliez Valley | 2.1% | 11.1%(-8.96)#55 | 11.3%(-9.24)#1,602 |
| 56. | Shelter Cove | 2.1% | 11.1%(-8.92)#56 | 11.3%(-9.20)#1,651 |
| 57. | Camanche Village | 2.2% | 11.1%(-8.90)#57 | 11.3%(-9.18)#1,684 |
| 58. | Del Rey Oaks | 2.2% | 11.1%(-8.88)#58 | 11.3%(-9.16)#1,709 |
| 59. | Rose Hills | 2.3% | 11.1%(-8.79)#59 | 11.3%(-9.07)#1,821 |
| 60. | Woodlands | 2.3% | 11.1%(-8.79)#60 | 11.3%(-9.07)#1,831 |
| 61. | Fairview | 2.3% | 11.1%(-8.78)#61 | 11.3%(-9.06)#1,842 |
| 62. | Nicolaus | 2.3% | 11.1%(-8.74)#62 | 11.3%(-9.02)#1,888 |
| 63. | Knightsen | 2.3% | 11.1%(-8.74)#63 | 11.3%(-9.01)#1,891 |
| 64. | Kentfield | 2.3% | 11.1%(-8.72)#64 | 11.3%(-9.00)#1,900 |
| 65. | San Diego Country Estates | 2.3% | 11.1%(-8.71)#65 | 11.3%(-8.99)#1,911 |
| 66. | Newcastle | 2.4% | 11.1%(-8.71)#66 | 11.3%(-8.99)#1,924 |
| 67. | Manhattan Beach | 2.4% | 11.1%(-8.70)#67 | 11.3%(-8.98)#1,940 |
| 68. | Elkhorn | 2.4% | 11.1%(-8.69)#68 | 11.3%(-8.96)#1,961 |
| 69. | Bootjack | 2.4% | 11.1%(-8.68)#69 | 11.3%(-8.96)#1,971 |
| 70. | Santa Nella | 2.4% | 11.1%(-8.67)#70 | 11.3%(-8.95)#1,985 |
| 71. | Camptonville | 2.4% | 11.1%(-8.66)#71 | 11.3%(-8.94)#1,989 |
| 72. | Hercules | 2.4% | 11.1%(-8.66)#72 | 11.3%(-8.94)#1,996 |
| 73. | Loleta | 2.4% | 11.1%(-8.66)#73 | 11.3%(-8.94)#1,998 |
| 74. | San Pasqual | 2.4% | 11.1%(-8.66)#74 | 11.3%(-8.93)#2,002 |
| 75. | Felton | 2.4% | 11.1%(-8.64)#75 | 11.3%(-8.92)#2,016 |
| 76. | Ross | 2.4% | 11.1%(-8.64)#76 | 11.3%(-8.92)#2,024 |
| 77. | Coronita | 2.5% | 11.1%(-8.61)#77 | 11.3%(-8.89)#2,053 |
| 78. | San Miguel Cdp Contra Costa County | 2.5% | 11.1%(-8.60)#78 | 11.3%(-8.88)#2,071 |
| 79. | Meadow Vista | 2.5% | 11.1%(-8.59)#79 | 11.3%(-8.87)#2,088 |
| 80. | Belvedere | 2.5% | 11.1%(-8.59)#80 | 11.3%(-8.87)#2,093 |
| 81. | Rio Del Mar | 2.5% | 11.1%(-8.58)#81 | 11.3%(-8.86)#2,108 |
| 82. | Corralitos | 2.5% | 11.1%(-8.54)#82 | 11.3%(-8.82)#2,164 |
| 83. | Borrego Springs | 2.5% | 11.1%(-8.53)#83 | 11.3%(-8.81)#2,183 |
| 84. | Los Altos | 2.5% | 11.1%(-8.51)#84 | 11.3%(-8.79)#2,209 |
| 85. | Forest Ranch | 2.6% | 11.1%(-8.46)#85 | 11.3%(-8.74)#2,256 |
| 86. | La Canada Flintridge | 2.6% | 11.1%(-8.45)#86 | 11.3%(-8.72)#2,278 |
| 87. | Clay | 2.6% | 11.1%(-8.44)#87 | 11.3%(-8.71)#2,290 |
| 88. | Hillsborough | 2.6% | 11.1%(-8.44)#88 | 11.3%(-8.71)#2,291 |
| 89. | Atherton | 2.6% | 11.1%(-8.43)#89 | 11.3%(-8.71)#2,319 |
| 90. | Fall River Mills | 2.6% | 11.1%(-8.42)#90 | 11.3%(-8.70)#2,326 |
| 91. | Johnstonville | 2.7% | 11.1%(-8.38)#91 | 11.3%(-8.66)#2,374 |
| 92. | Rolling Hills | 2.7% | 11.1%(-8.34)#92 | 11.3%(-8.62)#2,423 |
| 93. | Rancho Palos Verdes | 2.7% | 11.1%(-8.32)#93 | 11.3%(-8.60)#2,442 |
| 94. | Paradise | 2.8% | 11.1%(-8.31)#94 | 11.3%(-8.59)#2,454 |
| 95. | Morgan Hill | 2.8% | 11.1%(-8.31)#95 | 11.3%(-8.59)#2,455 |
| 96. | Penn Valley | 2.8% | 11.1%(-8.29)#96 | 11.3%(-8.57)#2,479 |
| 97. | Edwards Afb | 2.8% | 11.1%(-8.27)#97 | 11.3%(-8.55)#2,515 |
| 98. | Gold River | 2.8% | 11.1%(-8.26)#98 | 11.3%(-8.54)#2,522 |
| 99. | Saratoga | 2.8% | 11.1%(-8.25)#99 | 11.3%(-8.52)#2,535 |
| 100. | Sheridan | 2.8% | 11.1%(-8.25)#100 | 11.3%(-8.52)#2,536 |
Common Questions
What are the Top 10 Cities with the Lowest Male Poverty Level in California?
Top 10 Cities with the Lowest Male Poverty Level in California are:
#1
0.28%
#2
0.53%
#3
0.56%
#4
0.57%
#5
0.69%
#6
0.70%
#7
0.82%
#8
0.82%
#9
0.85%
#10
0.92%
What city has the Lowest Male Poverty Level in California?
Monte Sereno has the Lowest Male Poverty Level in California with 0.28%.
What is the Poverty Level Among Males in the State of California?
Poverty Level Among Males in California is 11.1%.
What is the Poverty Level Among Males in the United States?
Poverty Level Among Males in the United States is 11.3%.