Fellows, CA Map & Demographics
Fellows Map
Fellows Overview
$58,382
PER CAPITA INCOME
$123,125
AVG FAMILY INCOME
$153,750
AVG HOUSEHOLD INCOME
58.7%
WAGE / INCOME GAP [ % ]
41.3¢/ $1
WAGE / INCOME GAP [ $ ]
0.46
INEQUALITY / GINI INDEX
62
TOTAL POPULATION
42
MALE POPULATION
20
FEMALE POPULATION
210.00
MALES / 100 FEMALES
47.62
FEMALES / 100 MALES
46.8
MEDIAN AGE
3.1
AVG FAMILY SIZE
3.3
AVG HOUSEHOLD SIZE
31
LABOR FORCE [ PEOPLE ]
55.4%
PERCENT IN LABOR FORCE
19.4%
UNEMPLOYMENT RATE
Fellows Zip Codes
Fellows Area Codes
Income in Fellows
Income Overview in Fellows
Per Capita Income in Fellows is $58,382, while median incomes of families and households are $123,125 and $153,750 respectively.
| Characteristic | Number | Measure |
| Per Capita Income | 62 | $58,382 |
| Median Family Income | 19 | $123,125 |
| Mean Family Income | 19 | $167,095 |
| Median Household Income | 19 | $153,750 |
| Mean Household Income | 19 | $179,579 |
| Income Deficit | 19 | $0 |
| Wage / Income Gap (%) | 62 | 58.66% |
| Wage / Income Gap ($) | 62 | 41.34¢ per $1 |
| Gini / Inequality Index | 62 | 0.46 |
Earnings by Sex in Fellows
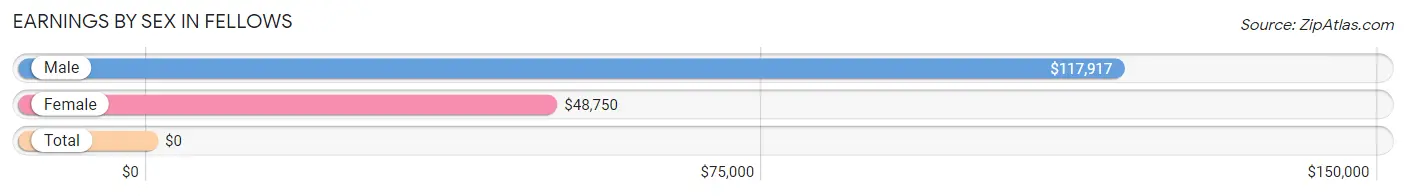
| Sex | Number | Average Earnings |
| Male | 21 (84.0%) | $117,917 |
| Female | 4 (16.0%) | $48,750 |
| Total | 25 (100.0%) | $0 |
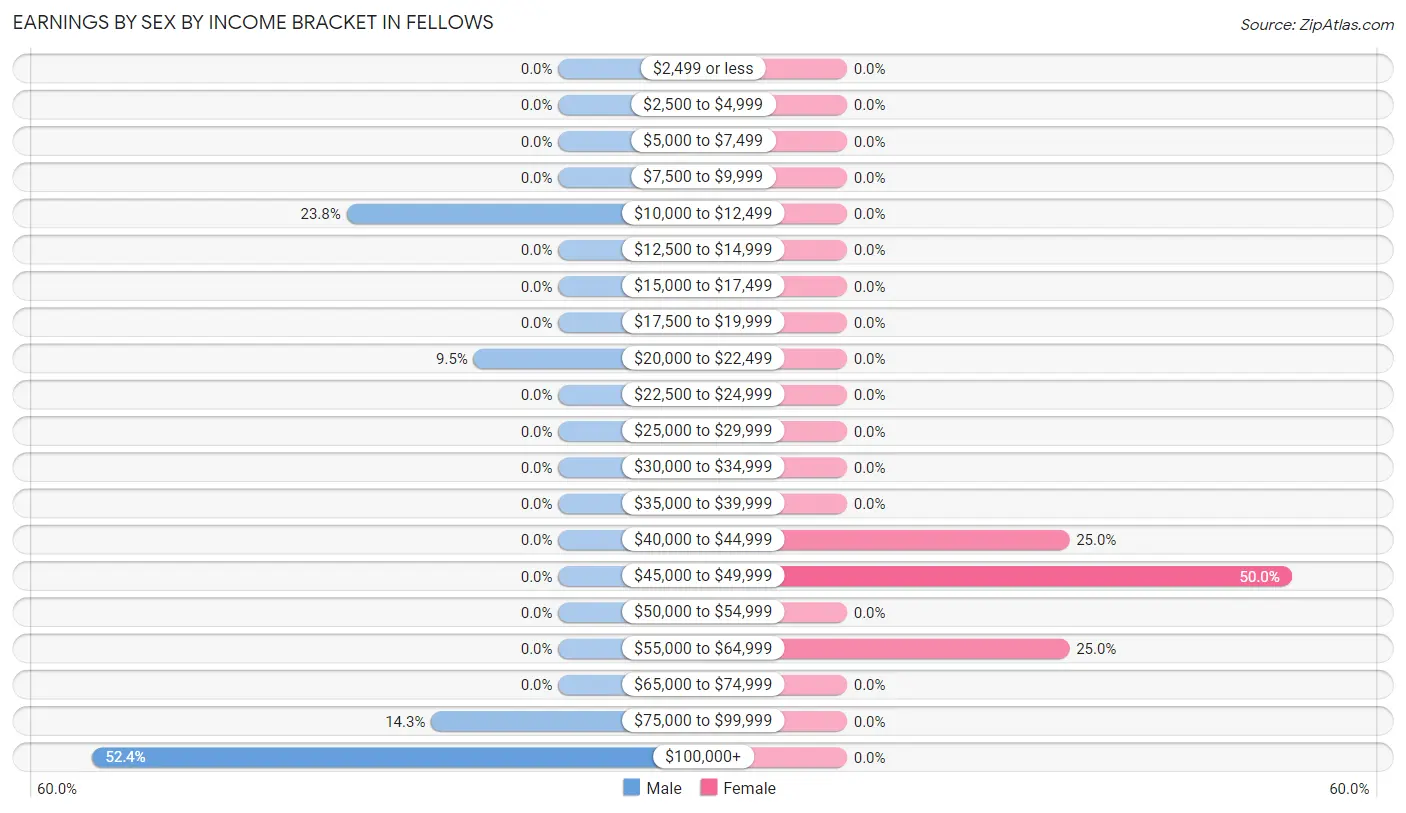
Earnings by Sex by Income Bracket in Fellows
The most common earnings brackets in Fellows are $100,000+ for men (11 | 52.4%) and $45,000 to $49,999 for women (2 | 50.0%).
| Income | Male | Female |
| $2,499 or less | 0 (0.0%) | 0 (0.0%) |
| $2,500 to $4,999 | 0 (0.0%) | 0 (0.0%) |
| $5,000 to $7,499 | 0 (0.0%) | 0 (0.0%) |
| $7,500 to $9,999 | 0 (0.0%) | 0 (0.0%) |
| $10,000 to $12,499 | 5 (23.8%) | 0 (0.0%) |
| $12,500 to $14,999 | 0 (0.0%) | 0 (0.0%) |
| $15,000 to $17,499 | 0 (0.0%) | 0 (0.0%) |
| $17,500 to $19,999 | 0 (0.0%) | 0 (0.0%) |
| $20,000 to $22,499 | 2 (9.5%) | 0 (0.0%) |
| $22,500 to $24,999 | 0 (0.0%) | 0 (0.0%) |
| $25,000 to $29,999 | 0 (0.0%) | 0 (0.0%) |
| $30,000 to $34,999 | 0 (0.0%) | 0 (0.0%) |
| $35,000 to $39,999 | 0 (0.0%) | 0 (0.0%) |
| $40,000 to $44,999 | 0 (0.0%) | 1 (25.0%) |
| $45,000 to $49,999 | 0 (0.0%) | 2 (50.0%) |
| $50,000 to $54,999 | 0 (0.0%) | 0 (0.0%) |
| $55,000 to $64,999 | 0 (0.0%) | 1 (25.0%) |
| $65,000 to $74,999 | 0 (0.0%) | 0 (0.0%) |
| $75,000 to $99,999 | 3 (14.3%) | 0 (0.0%) |
| $100,000+ | 11 (52.4%) | 0 (0.0%) |
| Total | 21 (100.0%) | 4 (100.0%) |
Earnings by Sex by Educational Attainment in Fellows
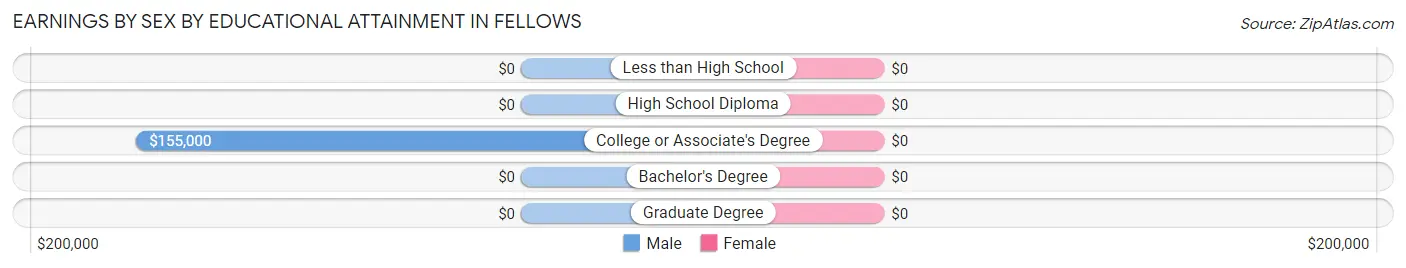
| Educational Attainment | Male Income | Female Income |
| Less than High School | - | - |
| High School Diploma | - | - |
| College or Associate's Degree | $155,000 | $0 |
| Bachelor's Degree | - | - |
| Graduate Degree | - | - |
| Total | $153,750 | $48,750 |
Family Income in Fellows
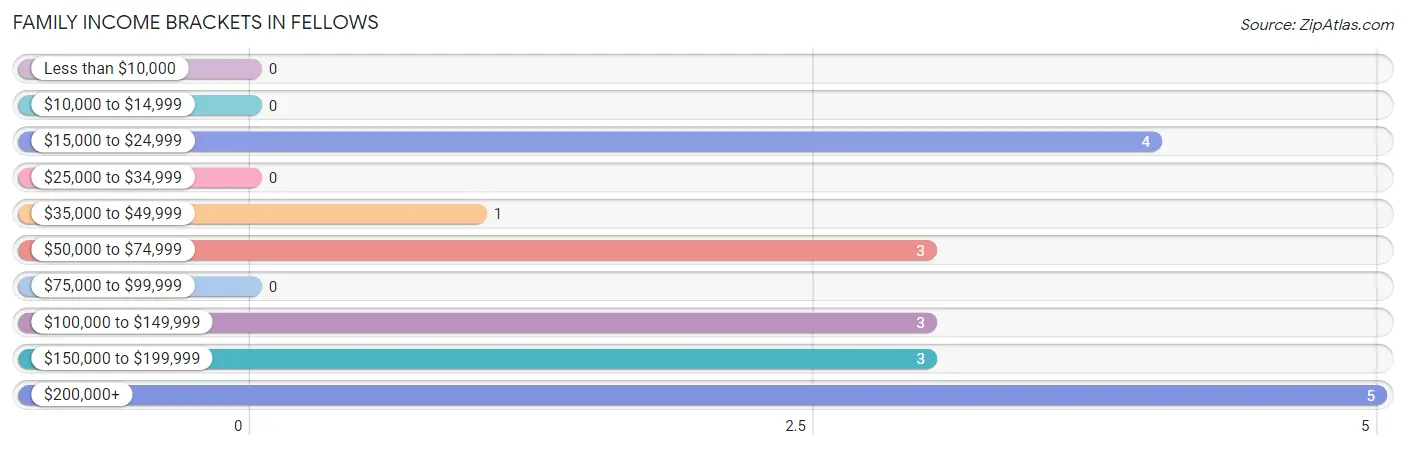
Family Income Brackets in Fellows
According to the Fellows family income data, there are 5 families falling into the $200,000+ income range, which is the most common income bracket and makes up 26.3% of all families.
| Income Bracket | # Families | % Families |
| Less than $10,000 | 0 | 0.0% |
| $10,000 to $14,999 | 0 | 0.0% |
| $15,000 to $24,999 | 4 | 21.1% |
| $25,000 to $34,999 | 0 | 0.0% |
| $35,000 to $49,999 | 1 | 5.3% |
| $50,000 to $74,999 | 3 | 15.8% |
| $75,000 to $99,999 | 0 | 0.0% |
| $100,000 to $149,999 | 3 | 15.8% |
| $150,000 to $199,999 | 3 | 15.8% |
| $200,000+ | 5 | 26.3% |
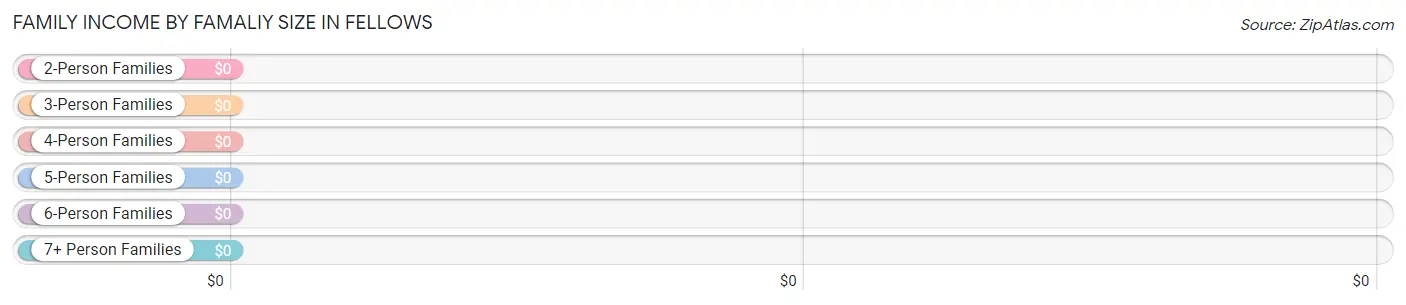
Family Income by Famaliy Size in Fellows
| Income Bracket | # Families | Median Income |
| 2-Person Families | 12 (63.2%) | $0 |
| 3-Person Families | 4 (21.0%) | $0 |
| 4-Person Families | 2 (10.5%) | $0 |
| 5-Person Families | 1 (5.3%) | $0 |
| 6-Person Families | 0 (0.0%) | $0 |
| 7+ Person Families | 0 (0.0%) | $0 |
| Total | 19 (100.0%) | $123,125 |
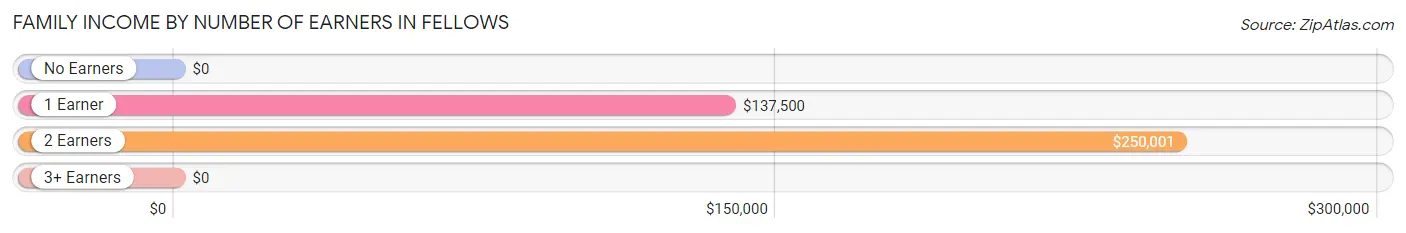
Family Income by Number of Earners in Fellows
| Number of Earners | # Families | Median Income |
| No Earners | 6 (31.6%) | $0 |
| 1 Earner | 6 (31.6%) | $137,500 |
| 2 Earners | 7 (36.8%) | $250,001 |
| 3+ Earners | 0 (0.0%) | $0 |
| Total | 19 (100.0%) | $123,125 |
Household Income in Fellows
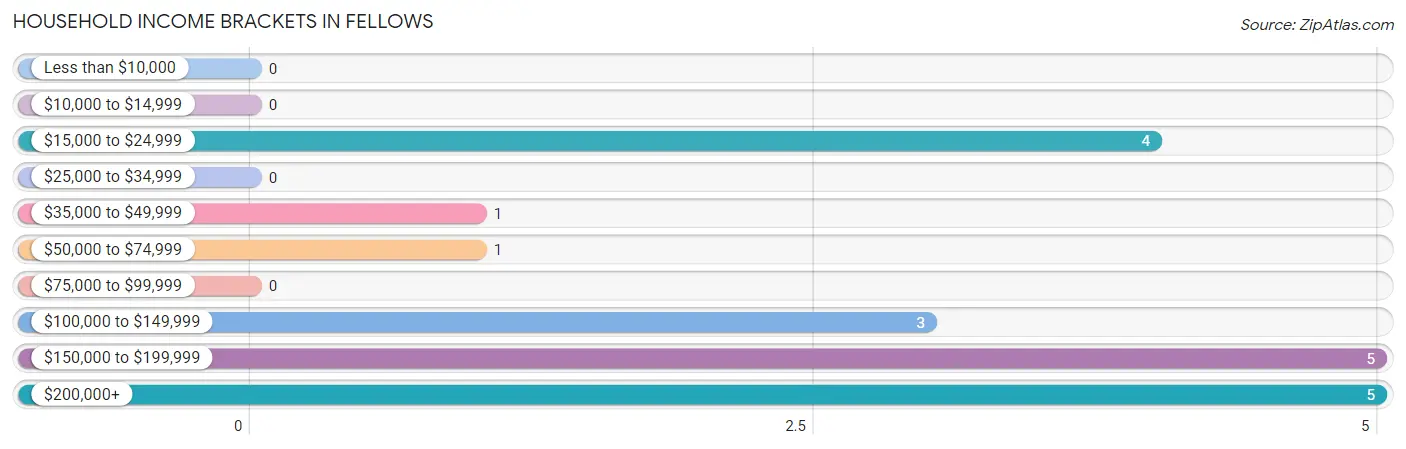
Household Income Brackets in Fellows
With 5 households falling in the category, the $150,000 to $199,999 income range is the most frequent in Fellows, accounting for 26.3% of all households.
| Income Bracket | # Households | % Households |
| Less than $10,000 | 0 | 0.0% |
| $10,000 to $14,999 | 0 | 0.0% |
| $15,000 to $24,999 | 4 | 21.1% |
| $25,000 to $34,999 | 0 | 0.0% |
| $35,000 to $49,999 | 1 | 5.3% |
| $50,000 to $74,999 | 1 | 5.3% |
| $75,000 to $99,999 | 0 | 0.0% |
| $100,000 to $149,999 | 3 | 15.8% |
| $150,000 to $199,999 | 5 | 26.3% |
| $200,000+ | 5 | 26.3% |
Household Income by Householder Age in Fellows
The median household income in Fellows is $153,750, with the highest median household income of $158,750 found in the 45 to 64 years age bracket for the primary householder. A total of 16 households (84.2%) fall into this category.
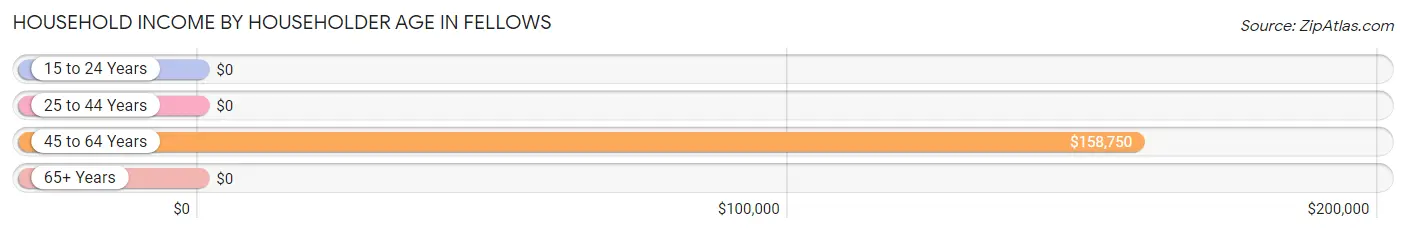
| Income Bracket | # Households | Median Income |
| 15 to 24 Years | 0 (0.0%) | $0 |
| 25 to 44 Years | 0 (0.0%) | $0 |
| 45 to 64 Years | 16 (84.2%) | $158,750 |
| 65+ Years | 3 (15.8%) | $0 |
| Total | 19 (100.0%) | $153,750 |
Poverty in Fellows
Income Below Poverty by Sex and Age in Fellows
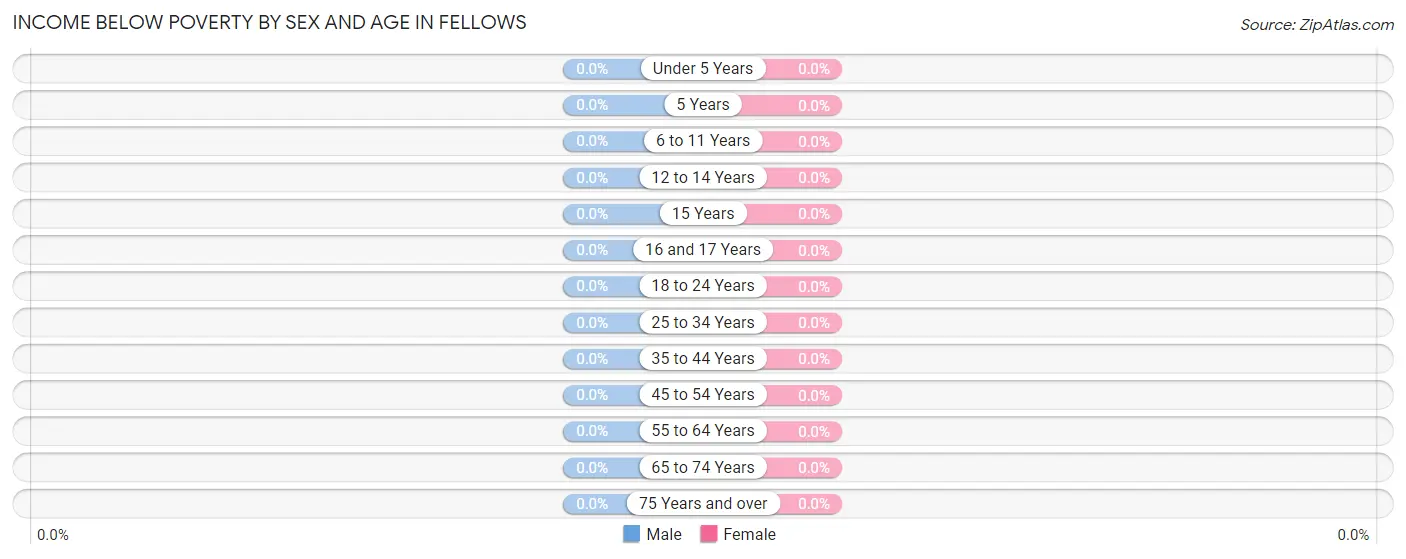
| Age Bracket | Male | Female |
| Under 5 Years | 0 (0.0%) | 0 (0.0%) |
| 5 Years | 0 (0.0%) | 0 (0.0%) |
| 6 to 11 Years | 0 (0.0%) | 0 (0.0%) |
| 12 to 14 Years | 0 (0.0%) | 0 (0.0%) |
| 15 Years | 0 (0.0%) | 0 (0.0%) |
| 16 and 17 Years | 0 (0.0%) | 0 (0.0%) |
| 18 to 24 Years | 0 (0.0%) | 0 (0.0%) |
| 25 to 34 Years | 0 (0.0%) | 0 (0.0%) |
| 35 to 44 Years | 0 (0.0%) | 0 (0.0%) |
| 45 to 54 Years | 0 (0.0%) | 0 (0.0%) |
| 55 to 64 Years | 0 (0.0%) | 0 (0.0%) |
| 65 to 74 Years | 0 (0.0%) | 0 (0.0%) |
| 75 Years and over | 0 (0.0%) | 0 (0.0%) |
| Total | 0 (0.0%) | 0 (0.0%) |
Income Above Poverty by Sex and Age in Fellows
According to the poverty statistics in Fellows, males aged 5 years and females aged 12 to 14 years are the age groups that are most secure financially, with 100.0% of males and 100.0% of females in these age groups living above the poverty line.
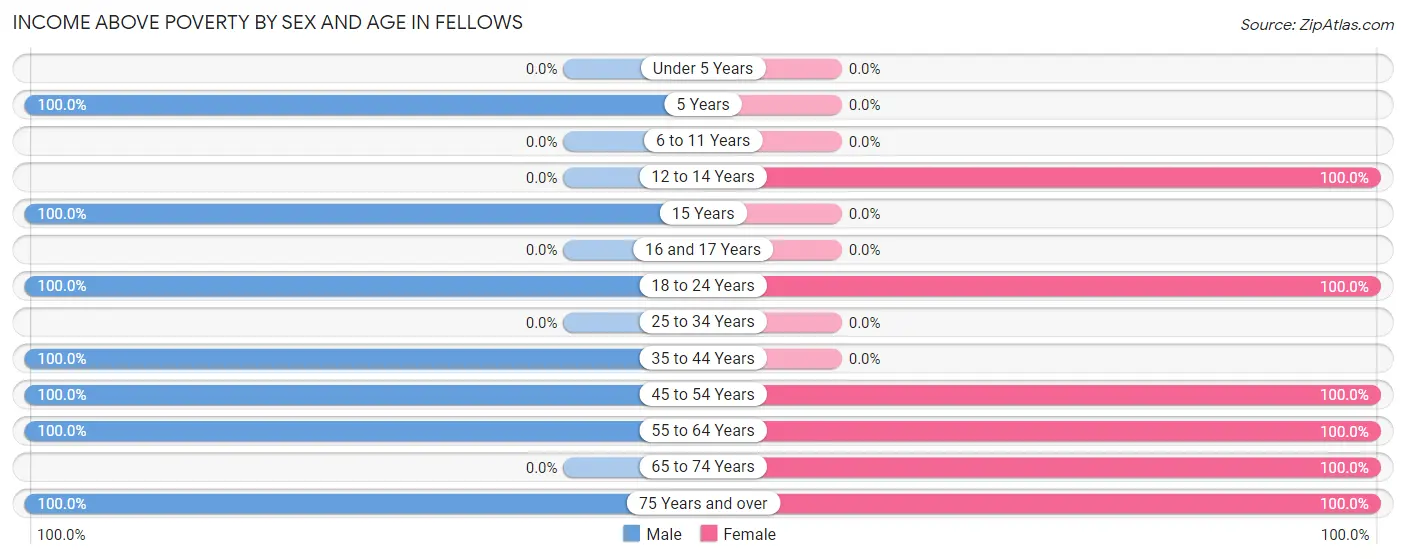
| Age Bracket | Male | Female |
| Under 5 Years | 0 (0.0%) | 0 (0.0%) |
| 5 Years | 2 (100.0%) | 0 (0.0%) |
| 6 to 11 Years | 0 (0.0%) | 0 (0.0%) |
| 12 to 14 Years | 0 (0.0%) | 2 (100.0%) |
| 15 Years | 2 (100.0%) | 0 (0.0%) |
| 16 and 17 Years | 0 (0.0%) | 0 (0.0%) |
| 18 to 24 Years | 14 (100.0%) | 1 (100.0%) |
| 25 to 34 Years | 0 (0.0%) | 0 (0.0%) |
| 35 to 44 Years | 6 (100.0%) | 0 (0.0%) |
| 45 to 54 Years | 6 (100.0%) | 6 (100.0%) |
| 55 to 64 Years | 11 (100.0%) | 6 (100.0%) |
| 65 to 74 Years | 0 (0.0%) | 1 (100.0%) |
| 75 Years and over | 1 (100.0%) | 4 (100.0%) |
| Total | 42 (100.0%) | 20 (100.0%) |
Income Below Poverty Among Married-Couple Families in Fellows
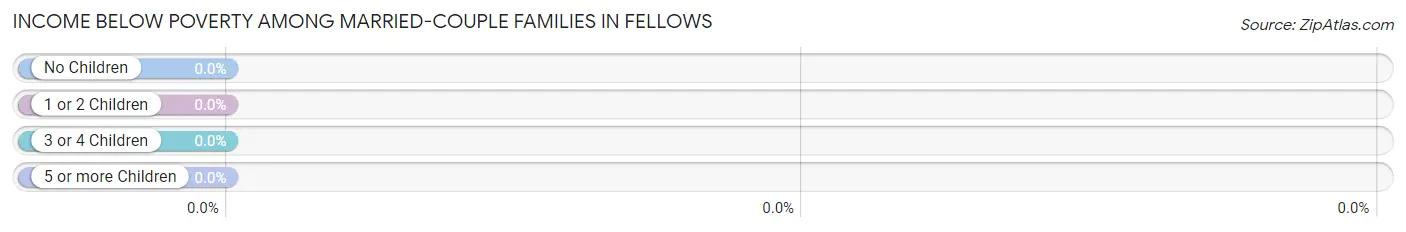
| Children | Above Poverty | Below Poverty |
| No Children | 12 (100.0%) | 0 (0.0%) |
| 1 or 2 Children | 2 (100.0%) | 0 (0.0%) |
| 3 or 4 Children | 0 (0.0%) | 0 (0.0%) |
| 5 or more Children | 0 (0.0%) | 0 (0.0%) |
| Total | 14 (100.0%) | 0 (0.0%) |
Income Below Poverty Among Single-Parent Households in Fellows
| Children | Single Father | Single Mother |
| No Children | 0 (0.0%) | 0 (0.0%) |
| 1 or 2 Children | 0 (0.0%) | 0 (0.0%) |
| 3 or 4 Children | 0 (0.0%) | 0 (0.0%) |
| 5 or more Children | 0 (0.0%) | 0 (0.0%) |
| Total | 0 (0.0%) | 0 (0.0%) |
Income Below Poverty Among Married-Couple vs Single-Parent Households in Fellows
| Children | Married-Couple Families | Single-Parent Households |
| No Children | 0 (0.0%) | 0 (0.0%) |
| 1 or 2 Children | 0 (0.0%) | 0 (0.0%) |
| 3 or 4 Children | 0 (0.0%) | 0 (0.0%) |
| 5 or more Children | 0 (0.0%) | 0 (0.0%) |
| Total | 0 (0.0%) | 0 (0.0%) |
Race in Fellows
The most populous races in Fellows are , and White / Caucasian (62 | 100.0%).
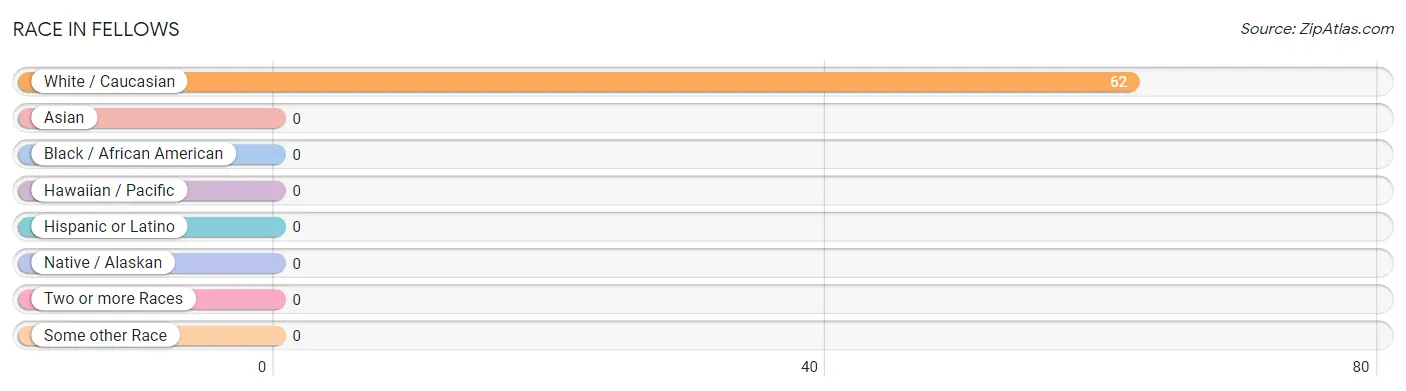
| Race | # Population | % Population |
| Asian | 0 | 0.0% |
| Black / African American | 0 | 0.0% |
| Hawaiian / Pacific | 0 | 0.0% |
| Hispanic or Latino | 0 | 0.0% |
| Native / Alaskan | 0 | 0.0% |
| White / Caucasian | 62 | 100.0% |
| Two or more Races | 0 | 0.0% |
| Some other Race | 0 | 0.0% |
| Total | 62 | 100.0% |
Ancestry in Fellows
The most populous ancestries reported in Fellows are Irish (7 | 11.3%), American (3 | 4.8%), English (3 | 4.8%), German (3 | 4.8%), and Italian (1 | 1.6%), together accounting for 27.4% of all Fellows residents.
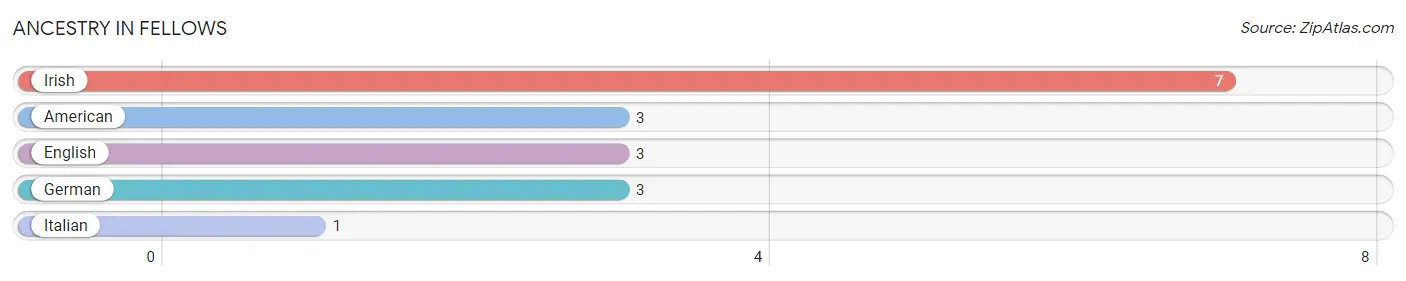
| Ancestry | # Population | % Population |
| American | 3 | 4.8% |
| English | 3 | 4.8% |
| German | 3 | 4.8% |
| Irish | 7 | 11.3% |
| Italian | 1 | 1.6% | View All 5 Rows |
Immigrants in Fellows

| Immigration Origin | # Population | % Population | View All 0 Rows |
Sex and Age in Fellows
Sex and Age in Fellows
The most populous age groups in Fellows are 20 to 24 Years (11 | 26.2%) for men and 60 to 64 Years (4 | 20.0%) for women.
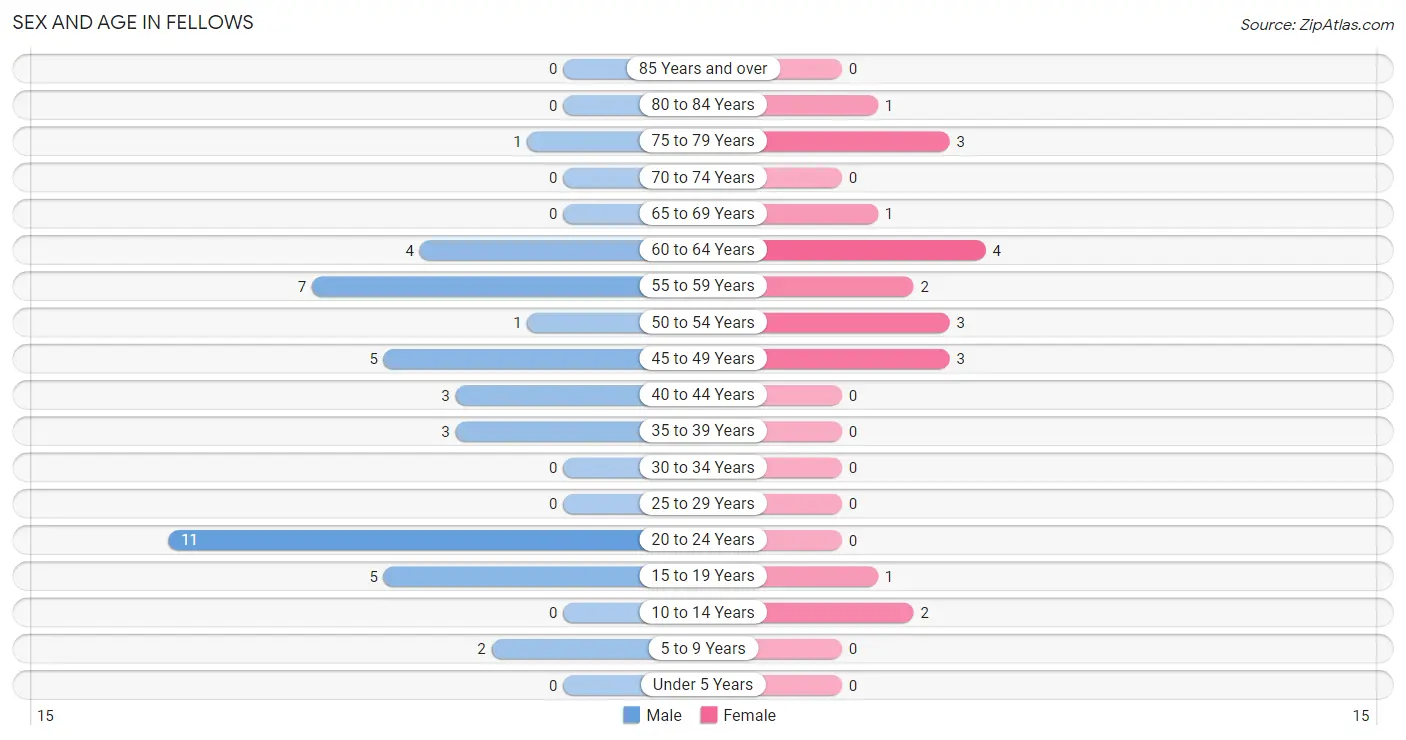
| Age Bracket | Male | Female |
| Under 5 Years | 0 (0.0%) | 0 (0.0%) |
| 5 to 9 Years | 2 (4.8%) | 0 (0.0%) |
| 10 to 14 Years | 0 (0.0%) | 2 (10.0%) |
| 15 to 19 Years | 5 (11.9%) | 1 (5.0%) |
| 20 to 24 Years | 11 (26.2%) | 0 (0.0%) |
| 25 to 29 Years | 0 (0.0%) | 0 (0.0%) |
| 30 to 34 Years | 0 (0.0%) | 0 (0.0%) |
| 35 to 39 Years | 3 (7.1%) | 0 (0.0%) |
| 40 to 44 Years | 3 (7.1%) | 0 (0.0%) |
| 45 to 49 Years | 5 (11.9%) | 3 (15.0%) |
| 50 to 54 Years | 1 (2.4%) | 3 (15.0%) |
| 55 to 59 Years | 7 (16.7%) | 2 (10.0%) |
| 60 to 64 Years | 4 (9.5%) | 4 (20.0%) |
| 65 to 69 Years | 0 (0.0%) | 1 (5.0%) |
| 70 to 74 Years | 0 (0.0%) | 0 (0.0%) |
| 75 to 79 Years | 1 (2.4%) | 3 (15.0%) |
| 80 to 84 Years | 0 (0.0%) | 1 (5.0%) |
| 85 Years and over | 0 (0.0%) | 0 (0.0%) |
| Total | 42 (100.0%) | 20 (100.0%) |
Families and Households in Fellows
Median Family Size in Fellows
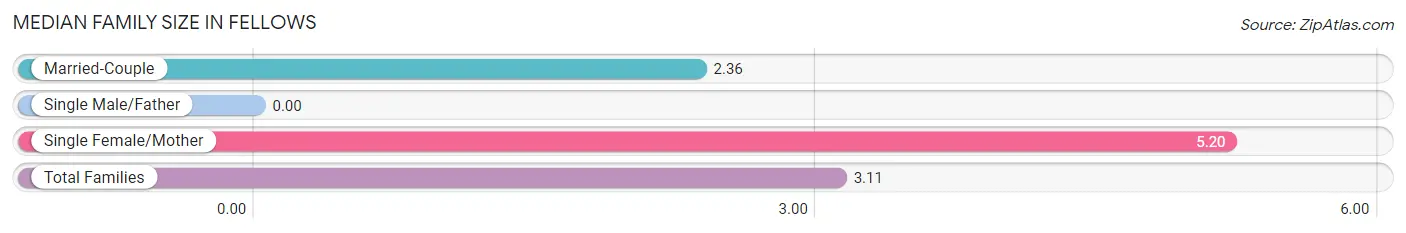
| Family Type | # Families | Family Size |
| Married-Couple | 14 (73.7%) | 2.36 |
| Single Male/Father | 0 (0.0%) | - |
| Single Female/Mother | 5 (26.3%) | 5.20 |
| Total Families | 19 (100.0%) | 3.11 |
Median Household Size in Fellows
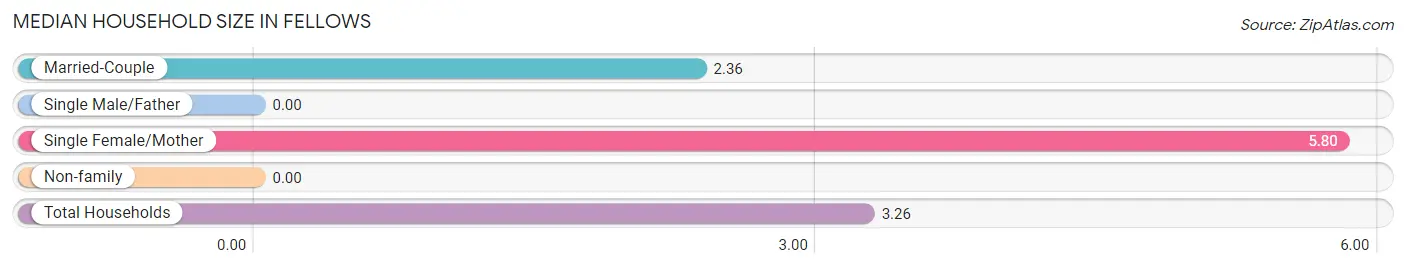
| Household Type | # Households | Household Size |
| Married-Couple | 14 (73.7%) | 2.36 |
| Single Male/Father | 0 (0.0%) | - |
| Single Female/Mother | 5 (26.3%) | 5.80 |
| Non-family | 0 (0.0%) | - |
| Total Households | 19 (100.0%) | 3.26 |
Household Size by Marriage Status in Fellows
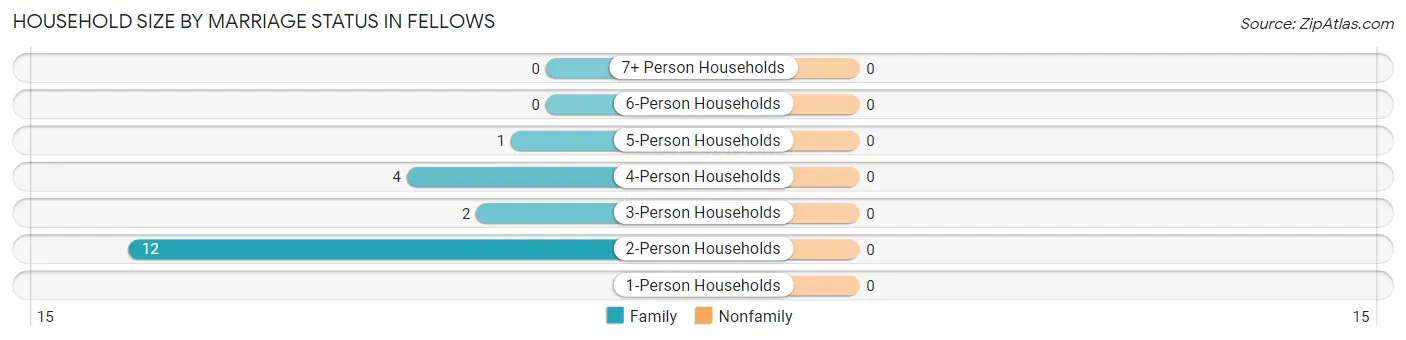
| Household Size | Family Households | Nonfamily Households |
| 1-Person Households | - | 0 (0.0%) |
| 2-Person Households | 12 (63.2%) | 0 (0.0%) |
| 3-Person Households | 2 (10.5%) | 0 (0.0%) |
| 4-Person Households | 4 (21.0%) | 0 (0.0%) |
| 5-Person Households | 1 (5.3%) | 0 (0.0%) |
| 6-Person Households | 0 (0.0%) | 0 (0.0%) |
| 7+ Person Households | 0 (0.0%) | 0 (0.0%) |
| Total | 19 (100.0%) | 0 (0.0%) |
Female Fertility in Fellows
Fertility by Age in Fellows
| Age Bracket | Women with Births | Births / 1,000 Women |
| 15 to 19 years | 0 (0.0%) | 0.0 |
| 20 to 34 years | 0 (0.0%) | 0.0 |
| 35 to 50 years | 0 (0.0%) | 0.0 |
| Total | 0 (0.0%) | 0.0 |
Fertility by Age by Marriage Status in Fellows
| Age Bracket | Married | Unmarried |
| 15 to 19 years | 0 (0.0%) | 0 (0.0%) |
| 20 to 34 years | 0 (0.0%) | 0 (0.0%) |
| 35 to 50 years | 0 (0.0%) | 0 (0.0%) |
| Total | 0 (0.0%) | 0 (0.0%) |
Fertility by Education in Fellows
| Educational Attainment | Women with Births | Births / 1,000 Women |
| Less than High School | 0 (0.0%) | 0.0 |
| High School Diploma | 0 (0.0%) | 0.0 |
| College or Associate's Degree | 0 (0.0%) | 0.0 |
| Bachelor's Degree | 0 (0.0%) | 0.0 |
| Graduate Degree | 0 (0.0%) | 0.0 |
| Total | 0 (0.0%) | 0.0 |
Fertility by Education by Marriage Status in Fellows
| Educational Attainment | Married | Unmarried |
| Less than High School | 0 (0.0%) | 0 (0.0%) |
| High School Diploma | 0 (0.0%) | 0 (0.0%) |
| College or Associate's Degree | 0 (0.0%) | 0 (0.0%) |
| Bachelor's Degree | 0 (0.0%) | 0 (0.0%) |
| Graduate Degree | 0 (0.0%) | 0 (0.0%) |
| Total | 0 (0.0%) | 0 (0.0%) |
Employment Characteristics in Fellows
Employment by Class of Employer in Fellows
Among the 25 employed individuals in Fellows, private company employees (18 | 72.0%), self-employed (incorporated) (2 | 8.0%), and self-employed (not incorporated) (2 | 8.0%) make up the most common classes of employment.
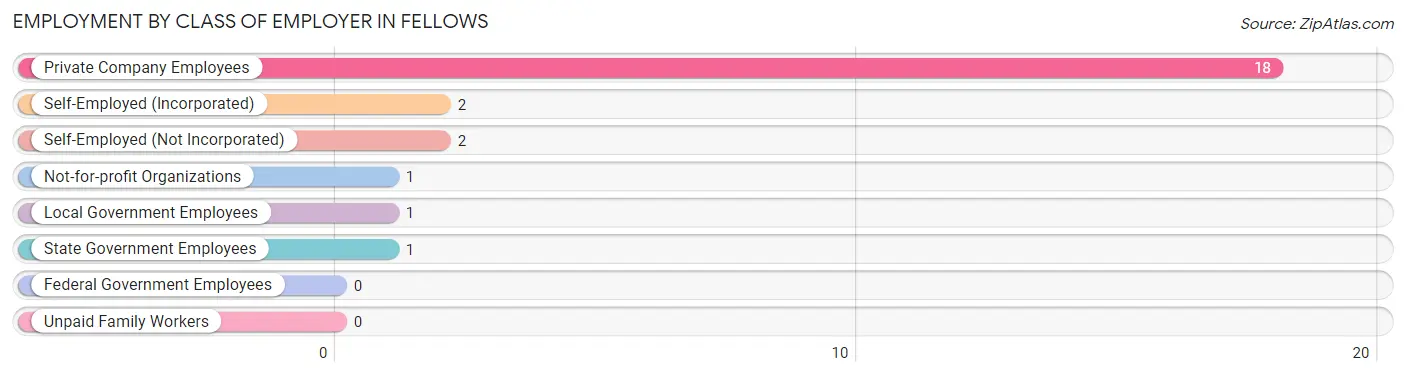
| Employer Class | # Employees | % Employees |
| Private Company Employees | 18 | 72.0% |
| Self-Employed (Incorporated) | 2 | 8.0% |
| Self-Employed (Not Incorporated) | 2 | 8.0% |
| Not-for-profit Organizations | 1 | 4.0% |
| Local Government Employees | 1 | 4.0% |
| State Government Employees | 1 | 4.0% |
| Federal Government Employees | 0 | 0.0% |
| Unpaid Family Workers | 0 | 0.0% |
| Total | 25 | 100.0% |
Employment Status by Age in Fellows
According to the labor force statistics for Fellows, out of the total population over 16 years of age (56), 55.4% or 31 individuals are in the labor force, with 19.4% or 6 of them unemployed. The age group with the highest labor force participation rate is 55 to 59 years, with 100.0% or 9 individuals in the labor force. Within the labor force, the 16 to 19 years age range has the highest percentage of unemployed individuals, with 100.0% or 3 of them being unemployed.
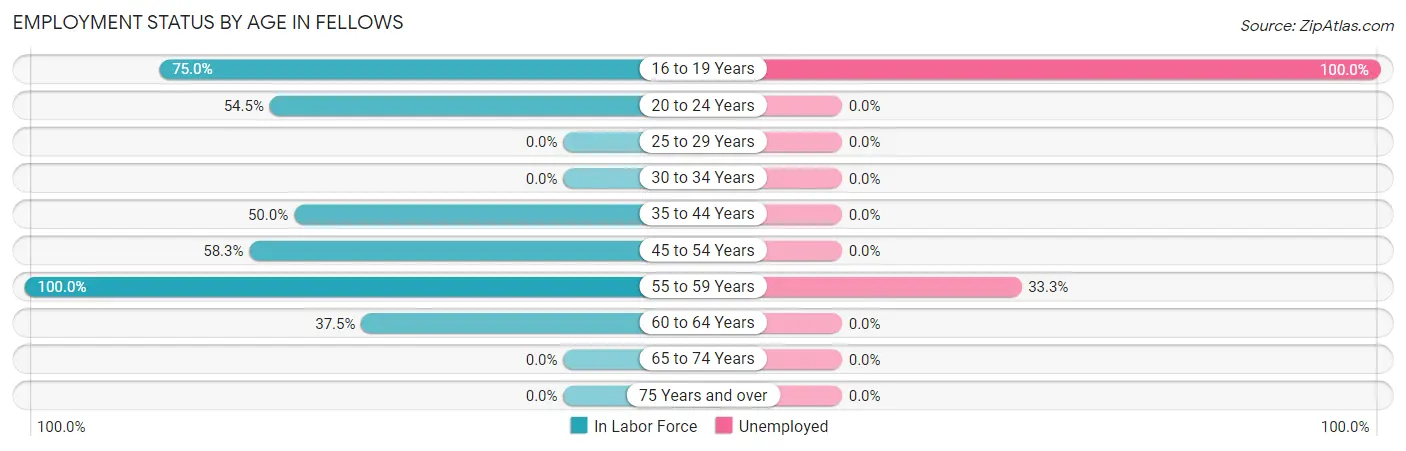
| Age Bracket | In Labor Force | Unemployed |
| 16 to 19 Years | 3 (75.0%) | 3 (100.0%) |
| 20 to 24 Years | 6 (54.5%) | 0 (0.0%) |
| 25 to 29 Years | 0 (0.0%) | 0 (0.0%) |
| 30 to 34 Years | 0 (0.0%) | 0 (0.0%) |
| 35 to 44 Years | 3 (50.0%) | 0 (0.0%) |
| 45 to 54 Years | 7 (58.3%) | 0 (0.0%) |
| 55 to 59 Years | 9 (100.0%) | 3 (33.3%) |
| 60 to 64 Years | 3 (37.5%) | 0 (0.0%) |
| 65 to 74 Years | 0 (0.0%) | 0 (0.0%) |
| 75 Years and over | 0 (0.0%) | 0 (0.0%) |
| Total | 31 (55.4%) | 6 (19.4%) |
Employment Status by Educational Attainment in Fellows
According to labor force statistics for Fellows, 62.9% of individuals (22) out of the total population between 25 and 64 years of age (35) are in the labor force, with 13.6% or 3 of them being unemployed. The group with the highest labor force participation rate are those with the educational attainment of less than high school, with 100.0% or 1 individuals in the labor force. Within the labor force, individuals with high school diploma education have the highest percentage of unemployment, with 37.5% or 3 of them being unemployed.
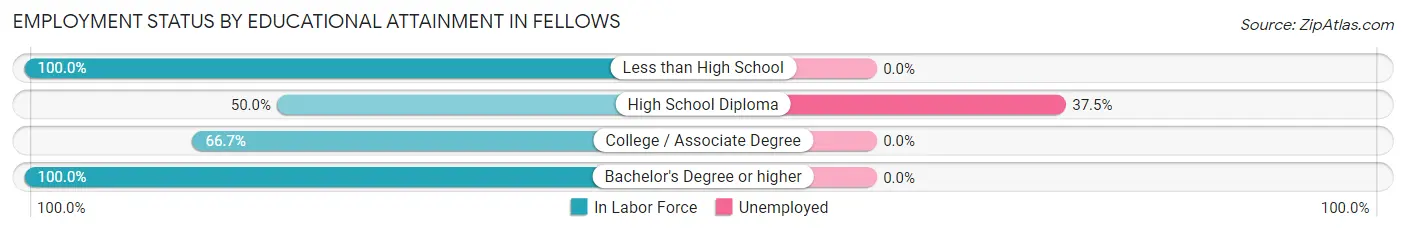
| Educational Attainment | In Labor Force | Unemployed |
| Less than High School | 1 (100.0%) | 0 (0.0%) |
| High School Diploma | 8 (50.0%) | 6 (37.5%) |
| College / Associate Degree | 10 (66.7%) | 0 (0.0%) |
| Bachelor's Degree or higher | 3 (100.0%) | 0 (0.0%) |
| Total | 22 (62.9%) | 5 (13.6%) |
Employment Occupations by Sex in Fellows
Management, Business, Science and Arts Occupations
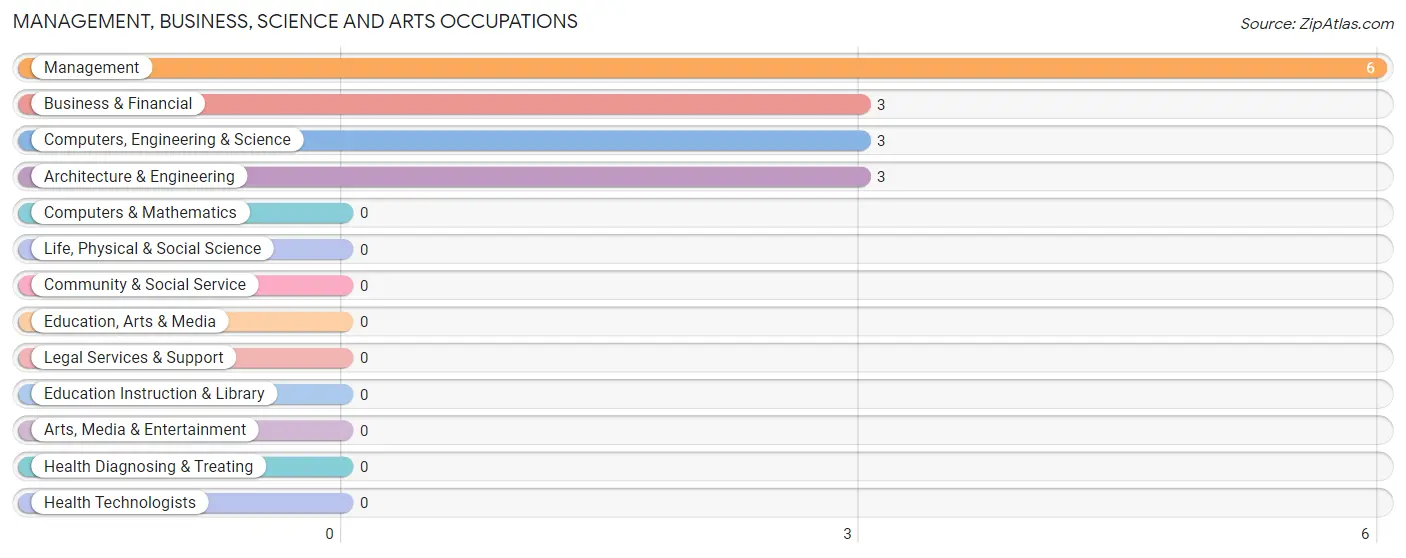
The most common Management, Business, Science and Arts occupations in Fellows are Management (6 | 24.0%), Business & Financial (3 | 12.0%), Computers, Engineering & Science (3 | 12.0%), and Architecture & Engineering (3 | 12.0%).
Management, Business, Science and Arts Occupations by Sex
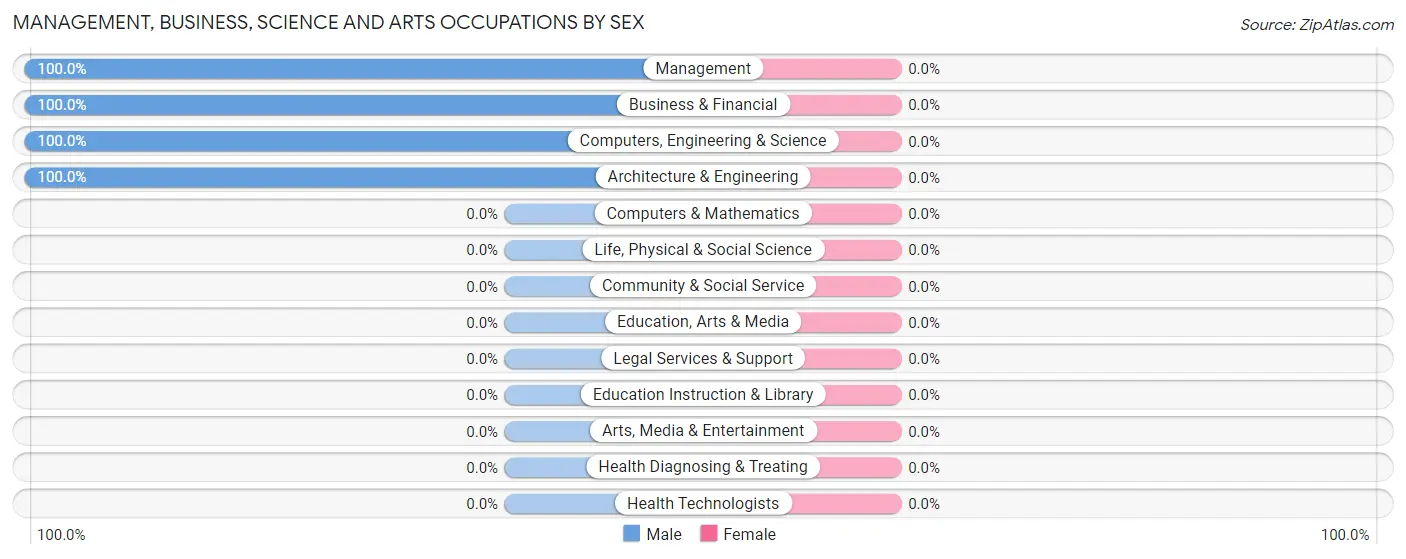
| Occupation | Male | Female |
| Management | 6 (100.0%) | 0 (0.0%) |
| Business & Financial | 3 (100.0%) | 0 (0.0%) |
| Computers, Engineering & Science | 3 (100.0%) | 0 (0.0%) |
| Computers & Mathematics | 0 (0.0%) | 0 (0.0%) |
| Architecture & Engineering | 3 (100.0%) | 0 (0.0%) |
| Life, Physical & Social Science | 0 (0.0%) | 0 (0.0%) |
| Community & Social Service | 0 (0.0%) | 0 (0.0%) |
| Education, Arts & Media | 0 (0.0%) | 0 (0.0%) |
| Legal Services & Support | 0 (0.0%) | 0 (0.0%) |
| Education Instruction & Library | 0 (0.0%) | 0 (0.0%) |
| Arts, Media & Entertainment | 0 (0.0%) | 0 (0.0%) |
| Health Diagnosing & Treating | 0 (0.0%) | 0 (0.0%) |
| Health Technologists | 0 (0.0%) | 0 (0.0%) |
| Total (Category) | 12 (100.0%) | 0 (0.0%) |
| Total (Overall) | 21 (84.0%) | 4 (16.0%) |
Services Occupations
The most common Services occupations in Fellows are Healthcare Support (2 | 8.0%), Food Preparation & Serving (1 | 4.0%), and Cleaning & Maintenance (1 | 4.0%).
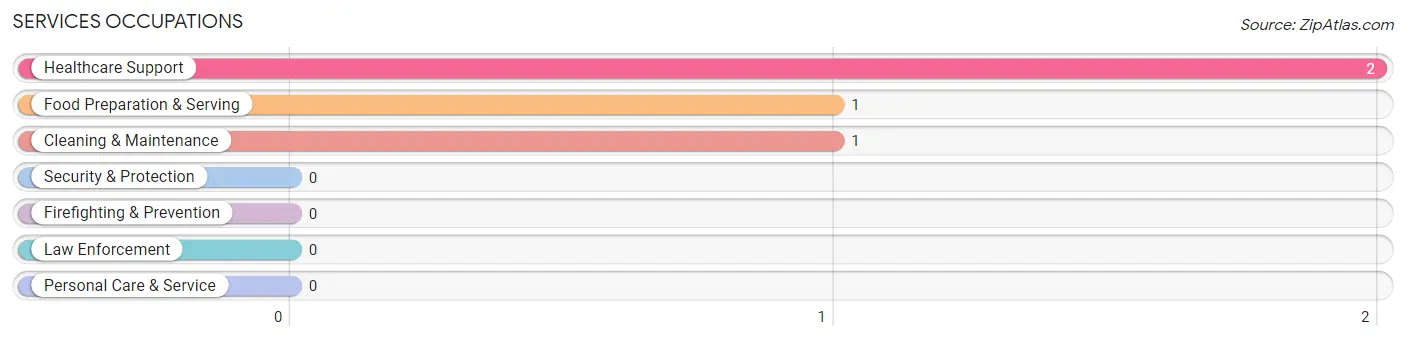
Services Occupations by Sex
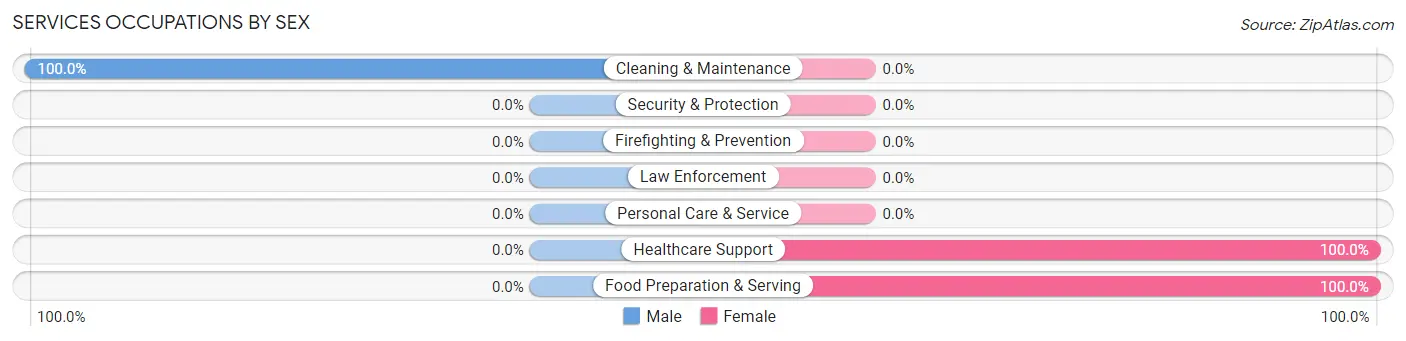
| Occupation | Male | Female |
| Healthcare Support | 0 (0.0%) | 2 (100.0%) |
| Security & Protection | 0 (0.0%) | 0 (0.0%) |
| Firefighting & Prevention | 0 (0.0%) | 0 (0.0%) |
| Law Enforcement | 0 (0.0%) | 0 (0.0%) |
| Food Preparation & Serving | 0 (0.0%) | 1 (100.0%) |
| Cleaning & Maintenance | 1 (100.0%) | 0 (0.0%) |
| Personal Care & Service | 0 (0.0%) | 0 (0.0%) |
| Total (Category) | 1 (25.0%) | 3 (75.0%) |
| Total (Overall) | 21 (84.0%) | 4 (16.0%) |
Sales and Office Occupations
The most common Sales and Office occupations in Fellows are , and Office & Administration (1 | 4.0%).
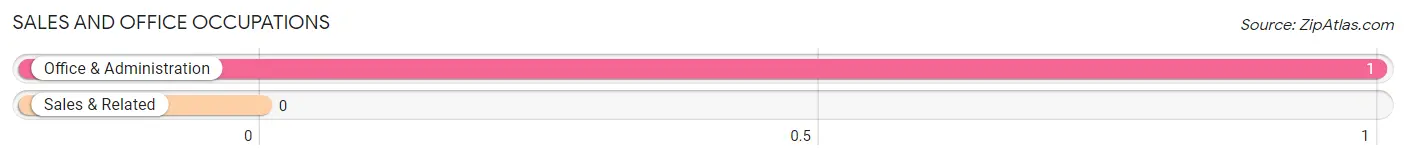
Sales and Office Occupations by Sex
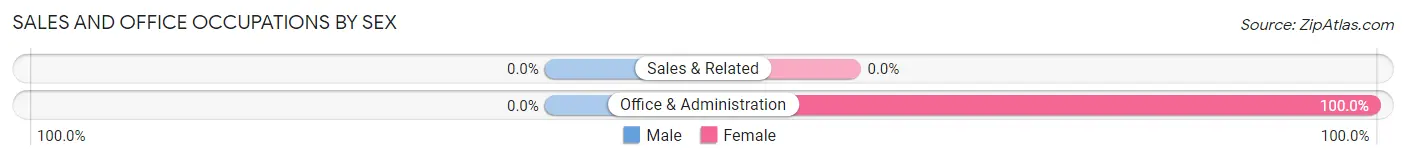
| Occupation | Male | Female |
| Sales & Related | 0 (0.0%) | 0 (0.0%) |
| Office & Administration | 0 (0.0%) | 1 (100.0%) |
| Total (Category) | 0 (0.0%) | 1 (100.0%) |
| Total (Overall) | 21 (84.0%) | 4 (16.0%) |
Natural Resources, Construction and Maintenance Occupations
The most common Natural Resources, Construction and Maintenance occupations in Fellows are Installation, Maintenance & Repair (4 | 16.0%), and Construction & Extraction (2 | 8.0%).
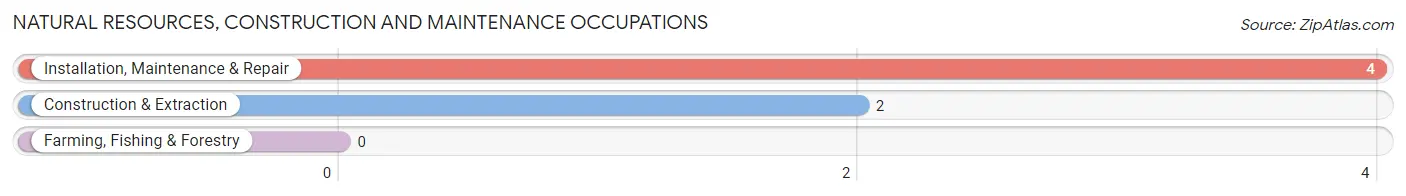
Natural Resources, Construction and Maintenance Occupations by Sex
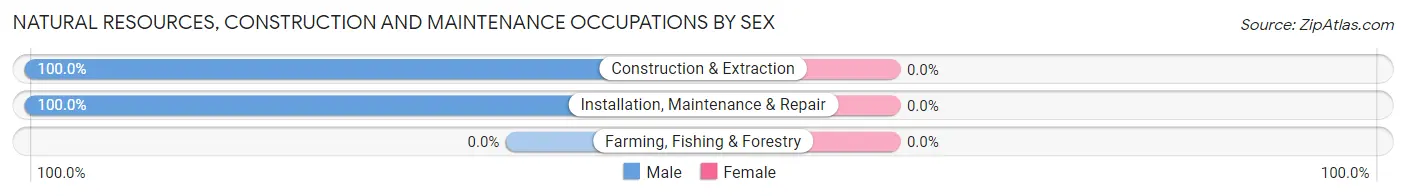
| Occupation | Male | Female |
| Farming, Fishing & Forestry | 0 (0.0%) | 0 (0.0%) |
| Construction & Extraction | 2 (100.0%) | 0 (0.0%) |
| Installation, Maintenance & Repair | 4 (100.0%) | 0 (0.0%) |
| Total (Category) | 6 (100.0%) | 0 (0.0%) |
| Total (Overall) | 21 (84.0%) | 4 (16.0%) |
Production, Transportation and Moving Occupations
The most common Production, Transportation and Moving occupations in Fellows are , and Material Moving (2 | 8.0%).
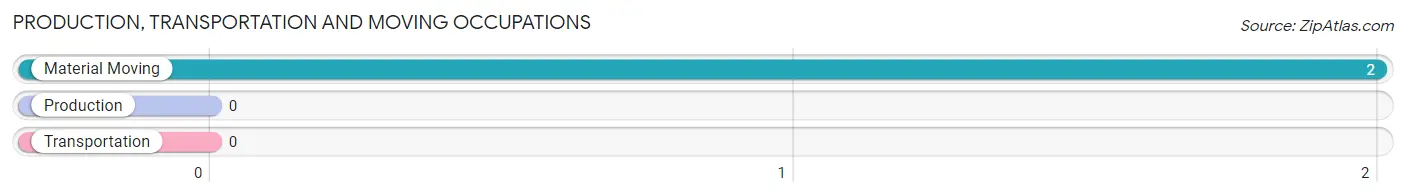
Production, Transportation and Moving Occupations by Sex
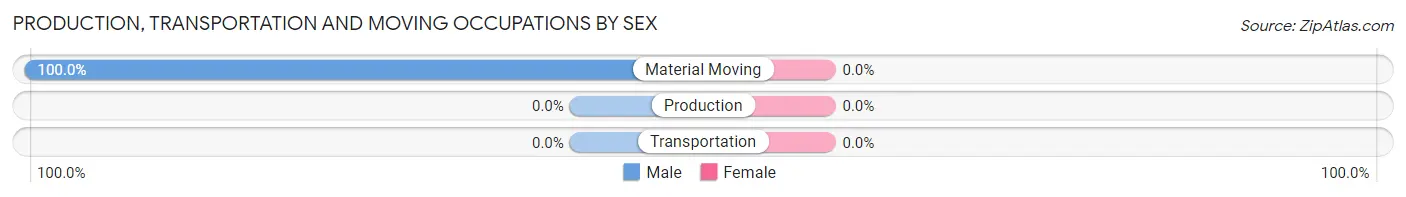
| Occupation | Male | Female |
| Production | 0 (0.0%) | 0 (0.0%) |
| Transportation | 0 (0.0%) | 0 (0.0%) |
| Material Moving | 2 (100.0%) | 0 (0.0%) |
| Total (Category) | 2 (100.0%) | 0 (0.0%) |
| Total (Overall) | 21 (84.0%) | 4 (16.0%) |
Employment Industries by Sex in Fellows
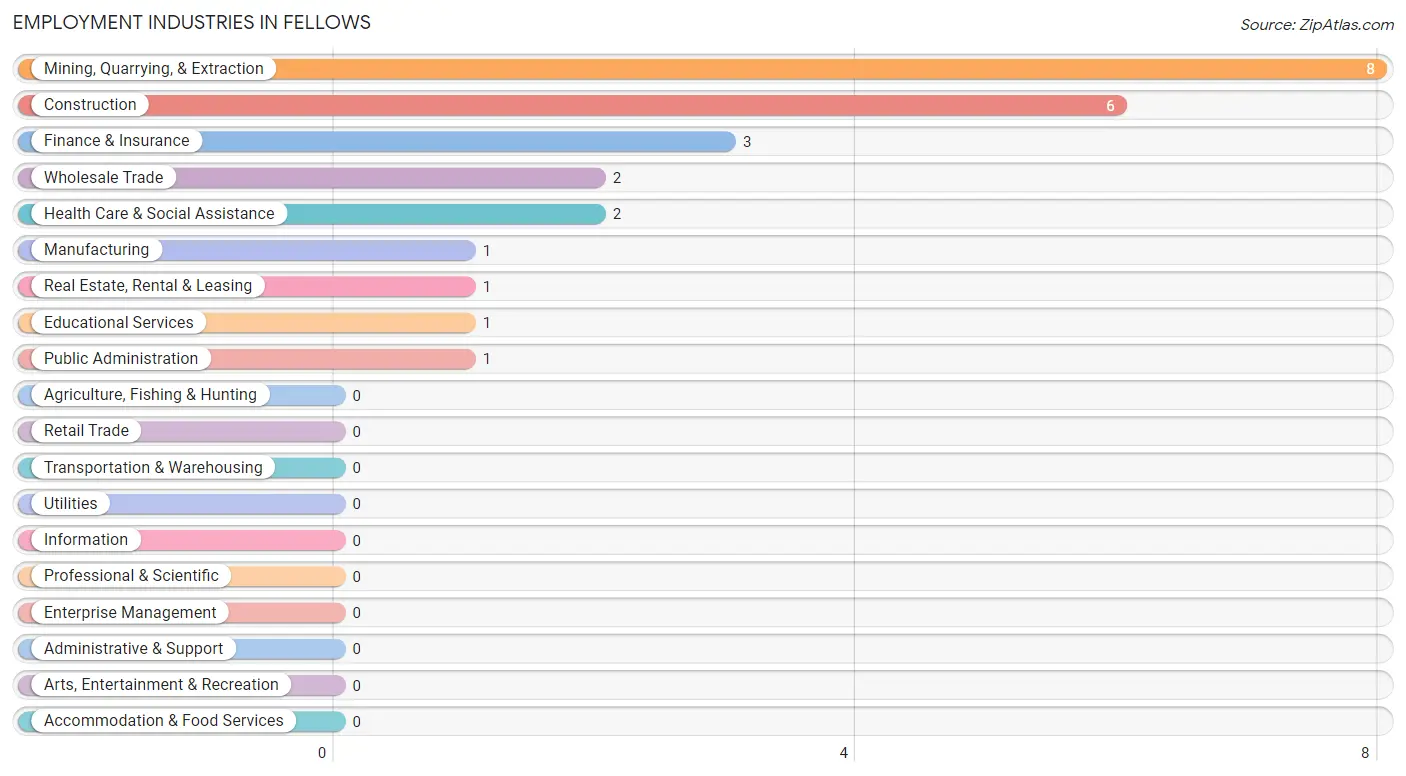
Employment Industries in Fellows
The major employment industries in Fellows include Mining, Quarrying, & Extraction (8 | 32.0%), Construction (6 | 24.0%), Finance & Insurance (3 | 12.0%), Wholesale Trade (2 | 8.0%), and Health Care & Social Assistance (2 | 8.0%).
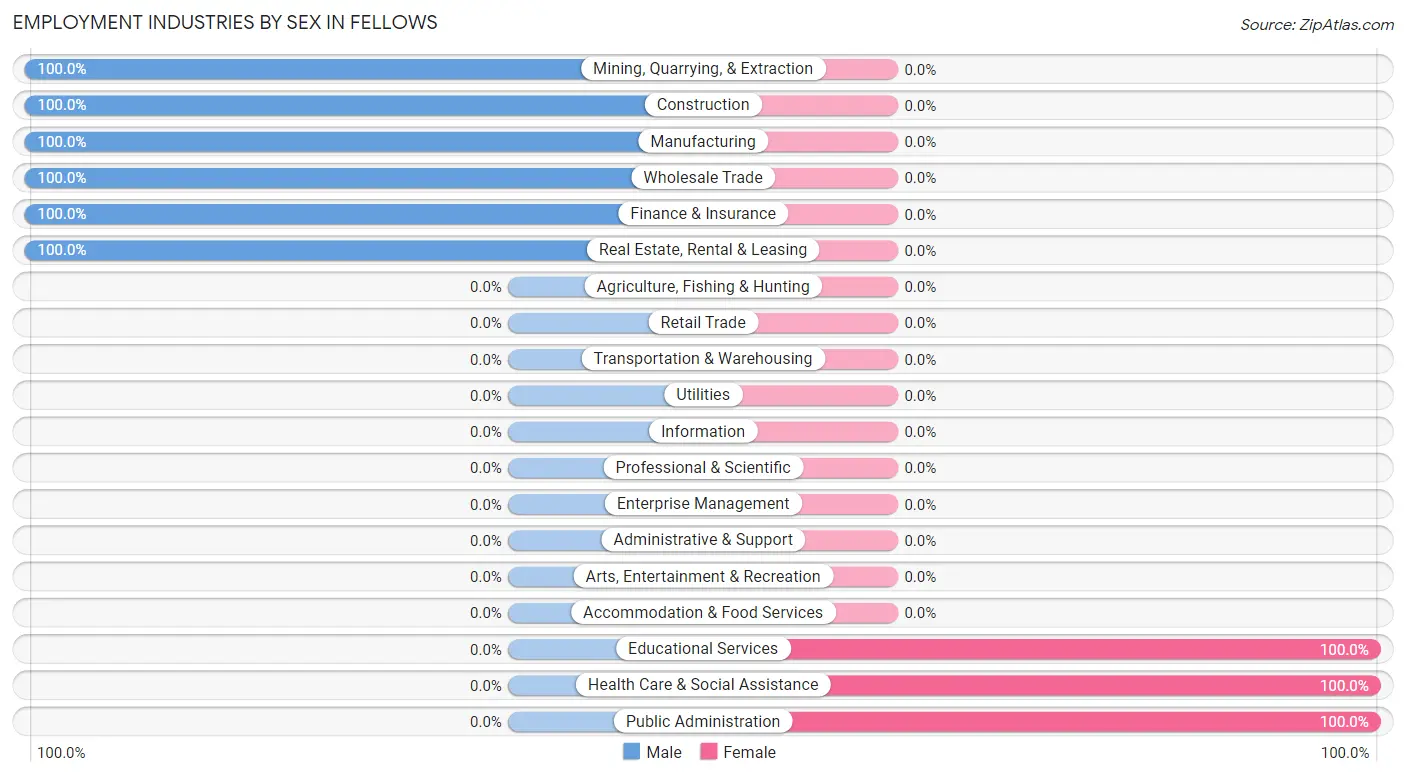
Employment Industries by Sex in Fellows
The Fellows industries that see more men than women are Mining, Quarrying, & Extraction (100.0%), Construction (100.0%), and Manufacturing (100.0%), whereas the industries that tend to have a higher number of women are Educational Services (100.0%), Health Care & Social Assistance (100.0%), and Public Administration (100.0%).
| Industry | Male | Female |
| Agriculture, Fishing & Hunting | 0 (0.0%) | 0 (0.0%) |
| Mining, Quarrying, & Extraction | 8 (100.0%) | 0 (0.0%) |
| Construction | 6 (100.0%) | 0 (0.0%) |
| Manufacturing | 1 (100.0%) | 0 (0.0%) |
| Wholesale Trade | 2 (100.0%) | 0 (0.0%) |
| Retail Trade | 0 (0.0%) | 0 (0.0%) |
| Transportation & Warehousing | 0 (0.0%) | 0 (0.0%) |
| Utilities | 0 (0.0%) | 0 (0.0%) |
| Information | 0 (0.0%) | 0 (0.0%) |
| Finance & Insurance | 3 (100.0%) | 0 (0.0%) |
| Real Estate, Rental & Leasing | 1 (100.0%) | 0 (0.0%) |
| Professional & Scientific | 0 (0.0%) | 0 (0.0%) |
| Enterprise Management | 0 (0.0%) | 0 (0.0%) |
| Administrative & Support | 0 (0.0%) | 0 (0.0%) |
| Educational Services | 0 (0.0%) | 1 (100.0%) |
| Health Care & Social Assistance | 0 (0.0%) | 2 (100.0%) |
| Arts, Entertainment & Recreation | 0 (0.0%) | 0 (0.0%) |
| Accommodation & Food Services | 0 (0.0%) | 0 (0.0%) |
| Public Administration | 0 (0.0%) | 1 (100.0%) |
| Total | 21 (84.0%) | 4 (16.0%) |
Education in Fellows
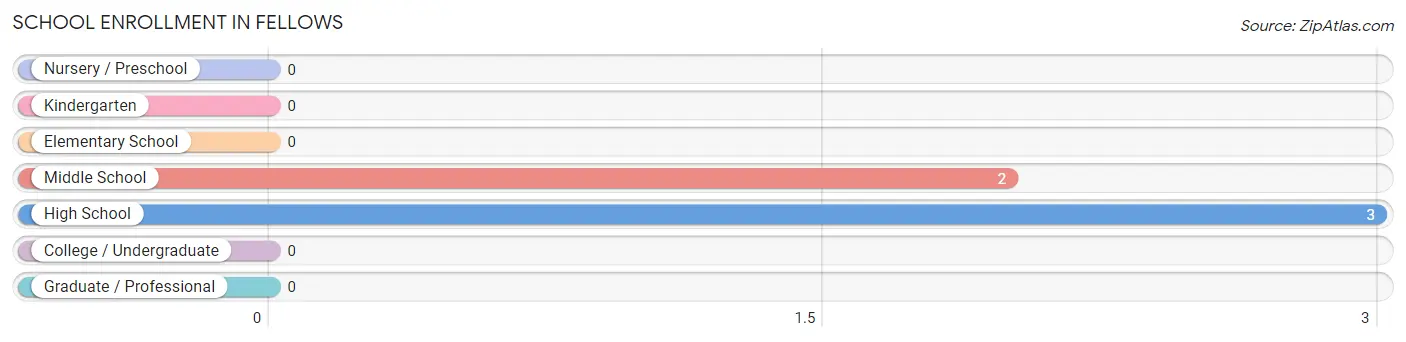
School Enrollment in Fellows
The most common levels of schooling among the 5 students in Fellows are high school (3 | 60.0%), and middle school (2 | 40.0%).
| School Level | # Students | % Students |
| Nursery / Preschool | 0 | 0.0% |
| Kindergarten | 0 | 0.0% |
| Elementary School | 0 | 0.0% |
| Middle School | 2 | 40.0% |
| High School | 3 | 60.0% |
| College / Undergraduate | 0 | 0.0% |
| Graduate / Professional | 0 | 0.0% |
| Total | 5 | 100.0% |
School Enrollment by Age by Funding Source in Fellows
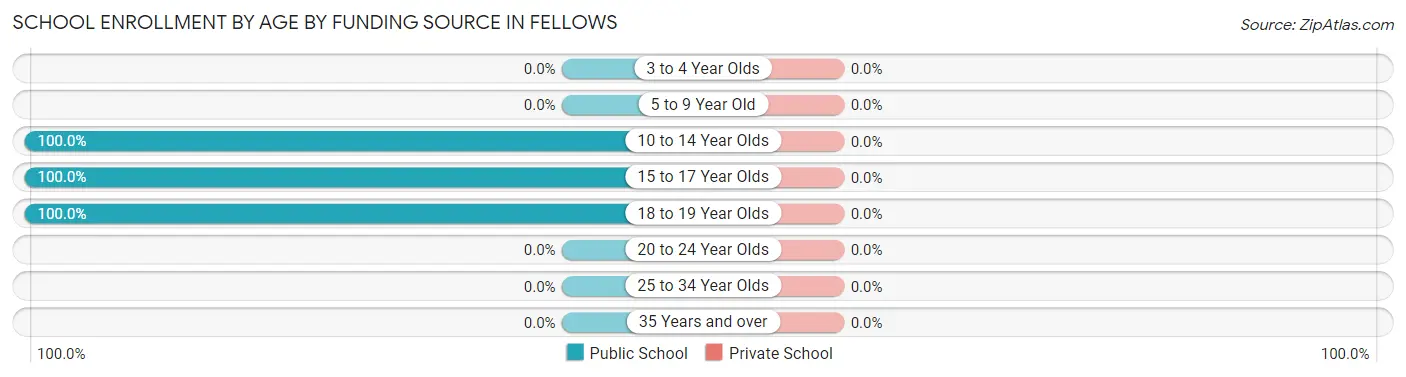
| Age Bracket | Public School | Private School |
| 3 to 4 Year Olds | 0 (0.0%) | 0 (0.0%) |
| 5 to 9 Year Old | 0 (0.0%) | 0 (0.0%) |
| 10 to 14 Year Olds | 2 (100.0%) | 0 (0.0%) |
| 15 to 17 Year Olds | 2 (100.0%) | 0 (0.0%) |
| 18 to 19 Year Olds | 1 (100.0%) | 0 (0.0%) |
| 20 to 24 Year Olds | 0 (0.0%) | 0 (0.0%) |
| 25 to 34 Year Olds | 0 (0.0%) | 0 (0.0%) |
| 35 Years and over | 0 (0.0%) | 0 (0.0%) |
| Total | 5 (100.0%) | 0 (0.0%) |
Educational Attainment by Field of Study in Fellows
, and visual & performing arts (3 | 100.0%) are the most common fields of study among 3 individuals in Fellows who have obtained a bachelor's degree or higher.
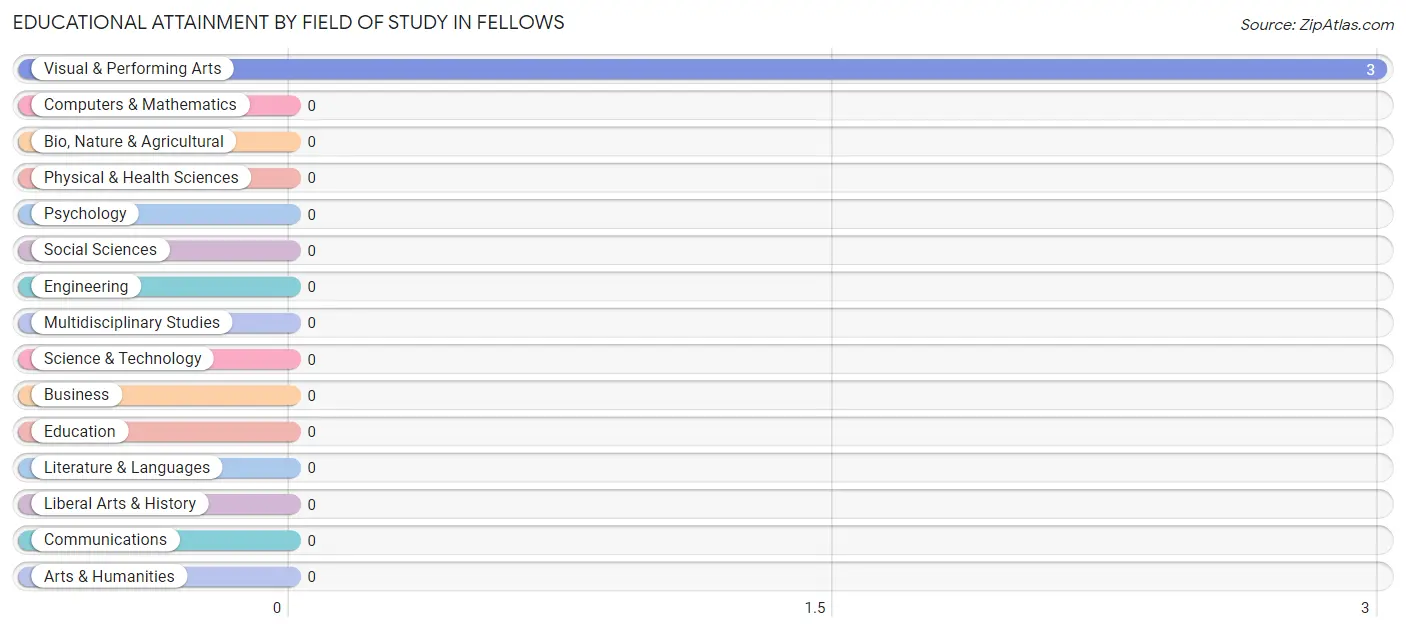
| Field of Study | # Graduates | % Graduates |
| Computers & Mathematics | 0 | 0.0% |
| Bio, Nature & Agricultural | 0 | 0.0% |
| Physical & Health Sciences | 0 | 0.0% |
| Psychology | 0 | 0.0% |
| Social Sciences | 0 | 0.0% |
| Engineering | 0 | 0.0% |
| Multidisciplinary Studies | 0 | 0.0% |
| Science & Technology | 0 | 0.0% |
| Business | 0 | 0.0% |
| Education | 0 | 0.0% |
| Literature & Languages | 0 | 0.0% |
| Liberal Arts & History | 0 | 0.0% |
| Visual & Performing Arts | 3 | 100.0% |
| Communications | 0 | 0.0% |
| Arts & Humanities | 0 | 0.0% |
| Total | 3 | 100.0% |
Transportation & Commute in Fellows
Vehicle Availability by Sex in Fellows
The most prevalent vehicle ownership categories in Fellows are males with 4 vehicles (9, accounting for 42.9%) and females with 4 vehicles (2, making up 225.0%).
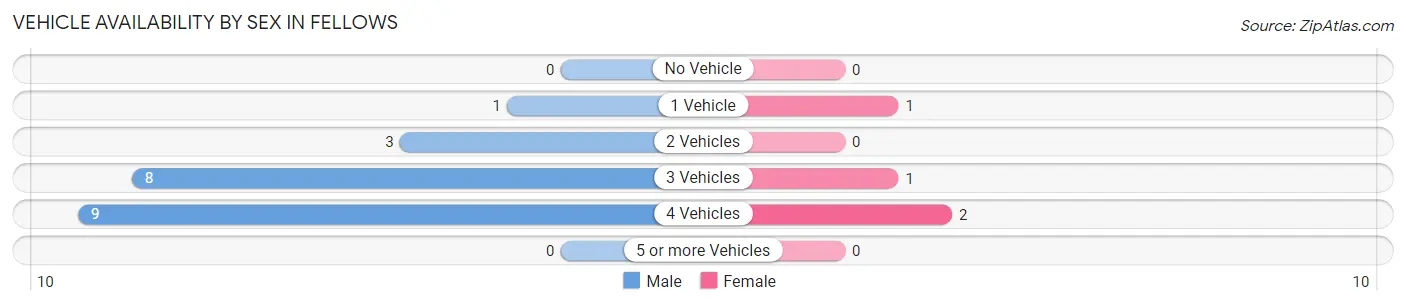
| Vehicles Available | Male | Female |
| No Vehicle | 0 (0.0%) | 0 (0.0%) |
| 1 Vehicle | 1 (4.8%) | 1 (25.0%) |
| 2 Vehicles | 3 (14.3%) | 0 (0.0%) |
| 3 Vehicles | 8 (38.1%) | 1 (25.0%) |
| 4 Vehicles | 9 (42.9%) | 2 (50.0%) |
| 5 or more Vehicles | 0 (0.0%) | 0 (0.0%) |
| Total | 21 (100.0%) | 4 (100.0%) |
Commute Time in Fellows
The most frequently occuring commute durations in Fellows are 20 to 24 minutes (8 commuters, 32.0%), 15 to 19 minutes (5 commuters, 20.0%), and 10 to 14 minutes (4 commuters, 16.0%).
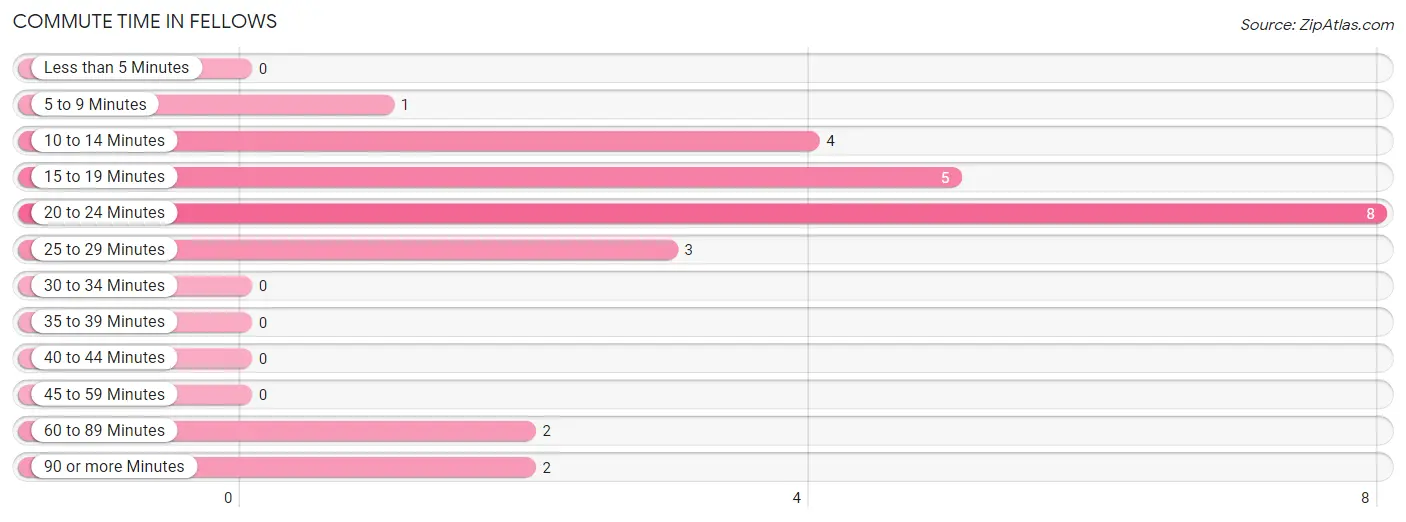
| Commute Time | # Commuters | % Commuters |
| Less than 5 Minutes | 0 | 0.0% |
| 5 to 9 Minutes | 1 | 4.0% |
| 10 to 14 Minutes | 4 | 16.0% |
| 15 to 19 Minutes | 5 | 20.0% |
| 20 to 24 Minutes | 8 | 32.0% |
| 25 to 29 Minutes | 3 | 12.0% |
| 30 to 34 Minutes | 0 | 0.0% |
| 35 to 39 Minutes | 0 | 0.0% |
| 40 to 44 Minutes | 0 | 0.0% |
| 45 to 59 Minutes | 0 | 0.0% |
| 60 to 89 Minutes | 2 | 8.0% |
| 90 or more Minutes | 2 | 8.0% |
Commute Time by Sex in Fellows
The most common commute times in Fellows are 20 to 24 minutes (6 commuters, 28.6%) for males and 20 to 24 minutes (2 commuters, 50.0%) for females.
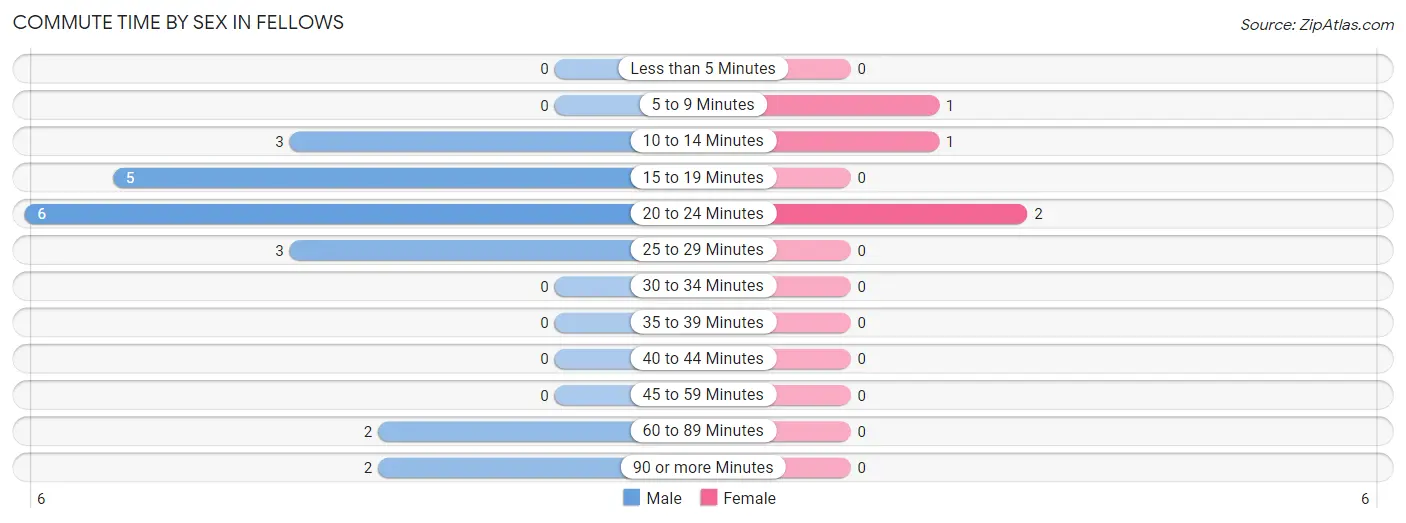
| Commute Time | Male | Female |
| Less than 5 Minutes | 0 (0.0%) | 0 (0.0%) |
| 5 to 9 Minutes | 0 (0.0%) | 1 (25.0%) |
| 10 to 14 Minutes | 3 (14.3%) | 1 (25.0%) |
| 15 to 19 Minutes | 5 (23.8%) | 0 (0.0%) |
| 20 to 24 Minutes | 6 (28.6%) | 2 (50.0%) |
| 25 to 29 Minutes | 3 (14.3%) | 0 (0.0%) |
| 30 to 34 Minutes | 0 (0.0%) | 0 (0.0%) |
| 35 to 39 Minutes | 0 (0.0%) | 0 (0.0%) |
| 40 to 44 Minutes | 0 (0.0%) | 0 (0.0%) |
| 45 to 59 Minutes | 0 (0.0%) | 0 (0.0%) |
| 60 to 89 Minutes | 2 (9.5%) | 0 (0.0%) |
| 90 or more Minutes | 2 (9.5%) | 0 (0.0%) |
Time of Departure to Work by Sex in Fellows
The most frequent times of departure to work in Fellows are 5:00 AM to 5:29 AM (9, 42.9%) for males and 6:30 AM to 6:59 AM (2, 50.0%) for females.
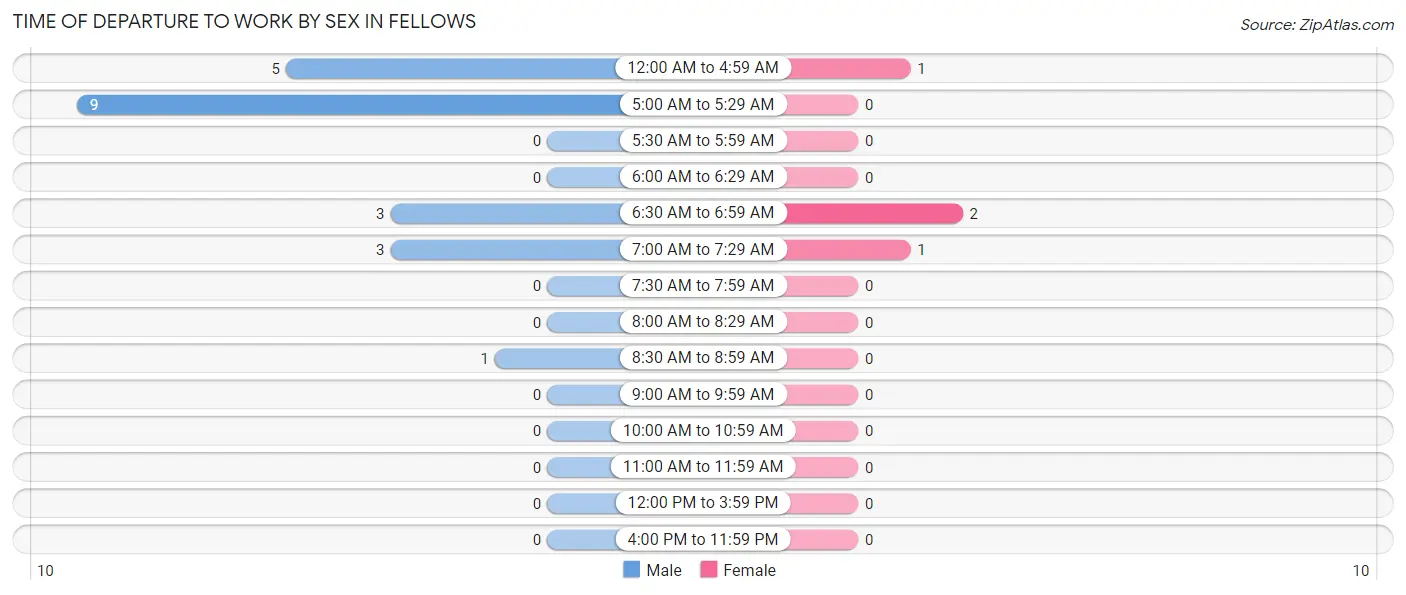
| Time of Departure | Male | Female |
| 12:00 AM to 4:59 AM | 5 (23.8%) | 1 (25.0%) |
| 5:00 AM to 5:29 AM | 9 (42.9%) | 0 (0.0%) |
| 5:30 AM to 5:59 AM | 0 (0.0%) | 0 (0.0%) |
| 6:00 AM to 6:29 AM | 0 (0.0%) | 0 (0.0%) |
| 6:30 AM to 6:59 AM | 3 (14.3%) | 2 (50.0%) |
| 7:00 AM to 7:29 AM | 3 (14.3%) | 1 (25.0%) |
| 7:30 AM to 7:59 AM | 0 (0.0%) | 0 (0.0%) |
| 8:00 AM to 8:29 AM | 0 (0.0%) | 0 (0.0%) |
| 8:30 AM to 8:59 AM | 1 (4.8%) | 0 (0.0%) |
| 9:00 AM to 9:59 AM | 0 (0.0%) | 0 (0.0%) |
| 10:00 AM to 10:59 AM | 0 (0.0%) | 0 (0.0%) |
| 11:00 AM to 11:59 AM | 0 (0.0%) | 0 (0.0%) |
| 12:00 PM to 3:59 PM | 0 (0.0%) | 0 (0.0%) |
| 4:00 PM to 11:59 PM | 0 (0.0%) | 0 (0.0%) |
| Total | 21 (100.0%) | 4 (100.0%) |
Housing Occupancy in Fellows
Occupancy by Ownership in Fellows
Of the total 19 dwellings in Fellows, owner-occupied units account for 18 (94.7%), while renter-occupied units make up 1 (5.3%).
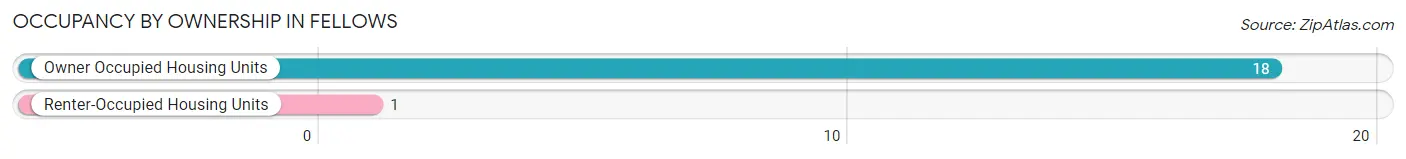
| Occupancy | # Housing Units | % Housing Units |
| Owner Occupied Housing Units | 18 | 94.7% |
| Renter-Occupied Housing Units | 1 | 5.3% |
| Total Occupied Housing Units | 19 | 100.0% |
Occupancy by Household Size in Fellows
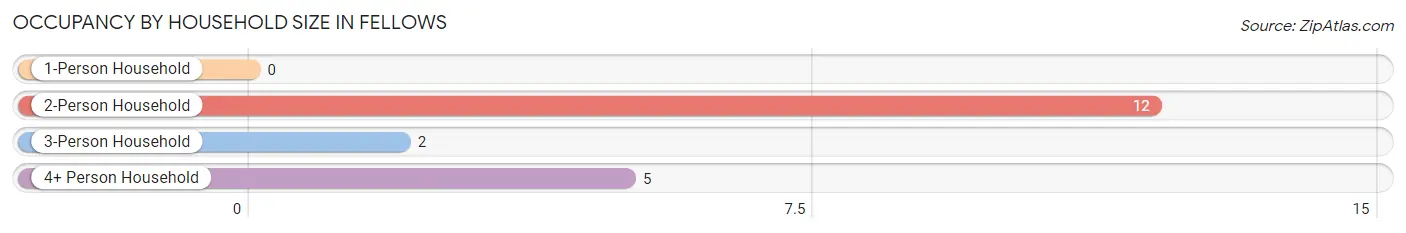
| Household Size | # Housing Units | % Housing Units |
| 1-Person Household | 0 | 0.0% |
| 2-Person Household | 12 | 63.2% |
| 3-Person Household | 2 | 10.5% |
| 4+ Person Household | 5 | 26.3% |
| Total Housing Units | 19 | 100.0% |
Occupancy by Ownership by Household Size in Fellows
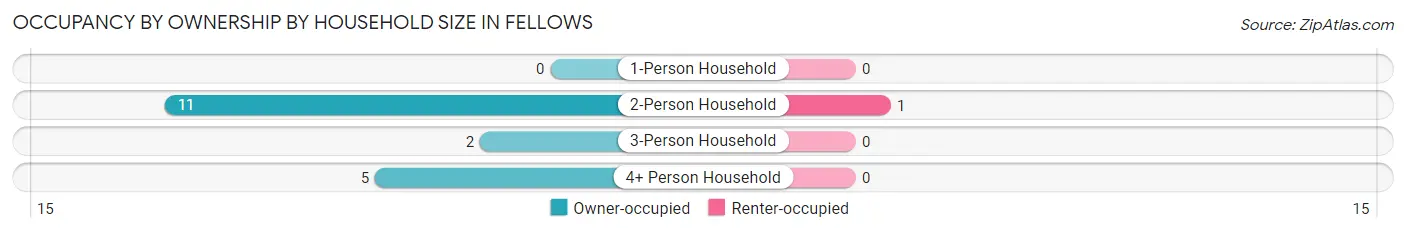
| Household Size | Owner-occupied | Renter-occupied |
| 1-Person Household | 0 (0.0%) | 0 (0.0%) |
| 2-Person Household | 11 (91.7%) | 1 (8.3%) |
| 3-Person Household | 2 (100.0%) | 0 (0.0%) |
| 4+ Person Household | 5 (100.0%) | 0 (0.0%) |
| Total Housing Units | 18 (94.7%) | 1 (5.3%) |
Occupancy by Educational Attainment in Fellows
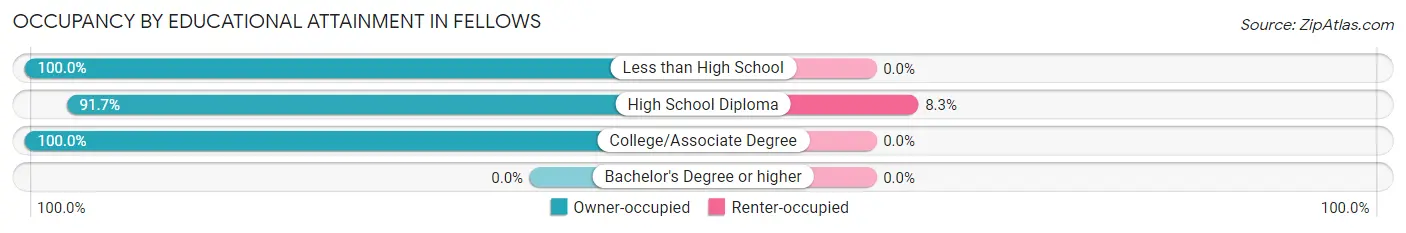
| Household Size | Owner-occupied | Renter-occupied |
| Less than High School | 2 (100.0%) | 0 (0.0%) |
| High School Diploma | 11 (91.7%) | 1 (8.3%) |
| College/Associate Degree | 5 (100.0%) | 0 (0.0%) |
| Bachelor's Degree or higher | 0 (0.0%) | 0 (0.0%) |
Occupancy by Age of Householder in Fellows
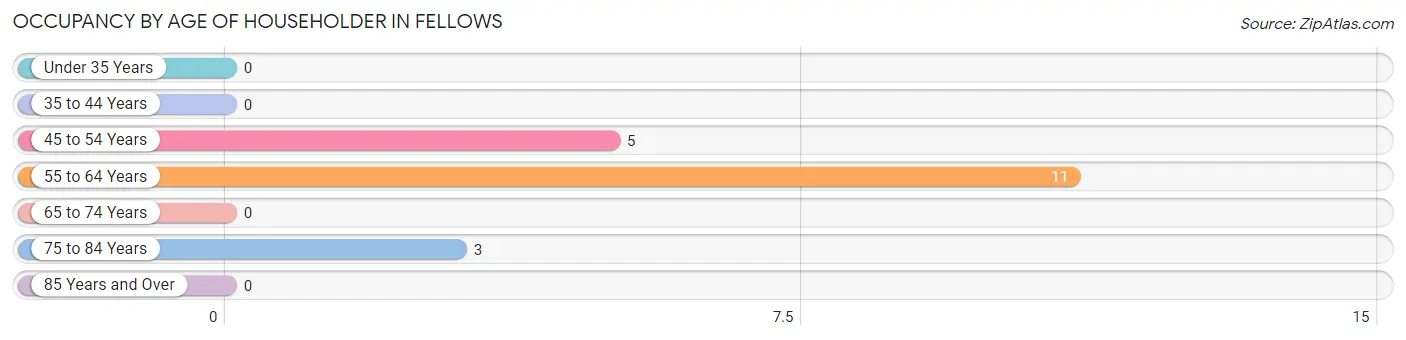
| Age Bracket | # Households | % Households |
| Under 35 Years | 0 | 0.0% |
| 35 to 44 Years | 0 | 0.0% |
| 45 to 54 Years | 5 | 26.3% |
| 55 to 64 Years | 11 | 57.9% |
| 65 to 74 Years | 0 | 0.0% |
| 75 to 84 Years | 3 | 15.8% |
| 85 Years and Over | 0 | 0.0% |
| Total | 19 | 100.0% |
Housing Finances in Fellows
Median Income by Occupancy in Fellows
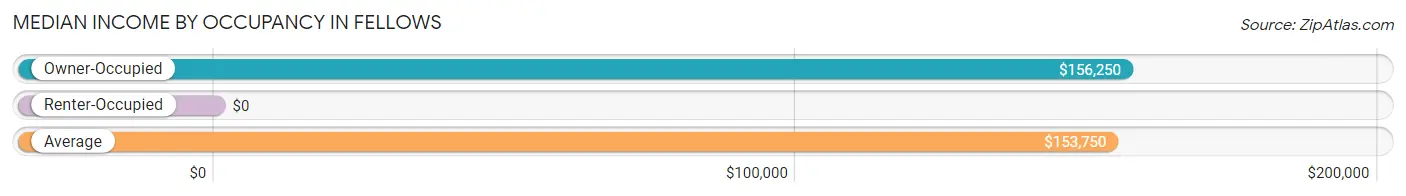
| Occupancy Type | # Households | Median Income |
| Owner-Occupied | 18 (94.7%) | $156,250 |
| Renter-Occupied | 1 (5.3%) | $0 |
| Average | 19 (100.0%) | $153,750 |
Occupancy by Householder Income Bracket in Fellows
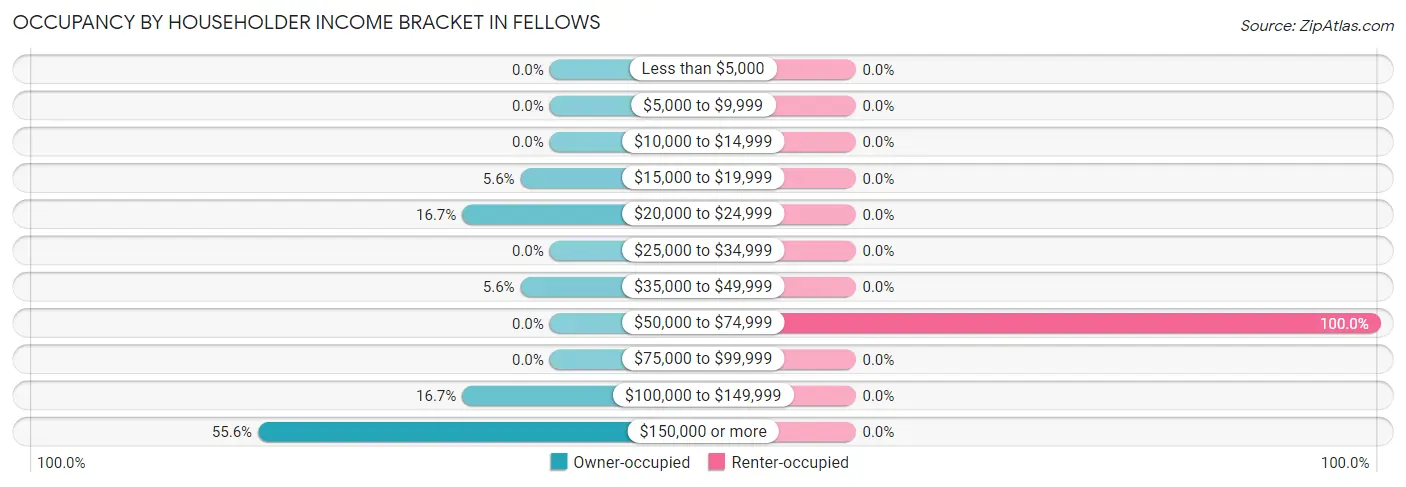
| Income Bracket | Owner-occupied | Renter-occupied |
| Less than $5,000 | 0 (0.0%) | 0 (0.0%) |
| $5,000 to $9,999 | 0 (0.0%) | 0 (0.0%) |
| $10,000 to $14,999 | 0 (0.0%) | 0 (0.0%) |
| $15,000 to $19,999 | 1 (5.6%) | 0 (0.0%) |
| $20,000 to $24,999 | 3 (16.7%) | 0 (0.0%) |
| $25,000 to $34,999 | 0 (0.0%) | 0 (0.0%) |
| $35,000 to $49,999 | 1 (5.6%) | 0 (0.0%) |
| $50,000 to $74,999 | 0 (0.0%) | 1 (100.0%) |
| $75,000 to $99,999 | 0 (0.0%) | 0 (0.0%) |
| $100,000 to $149,999 | 3 (16.7%) | 0 (0.0%) |
| $150,000 or more | 10 (55.6%) | 0 (0.0%) |
| Total | 18 (100.0%) | 1 (100.0%) |
Monthly Housing Cost Tiers in Fellows
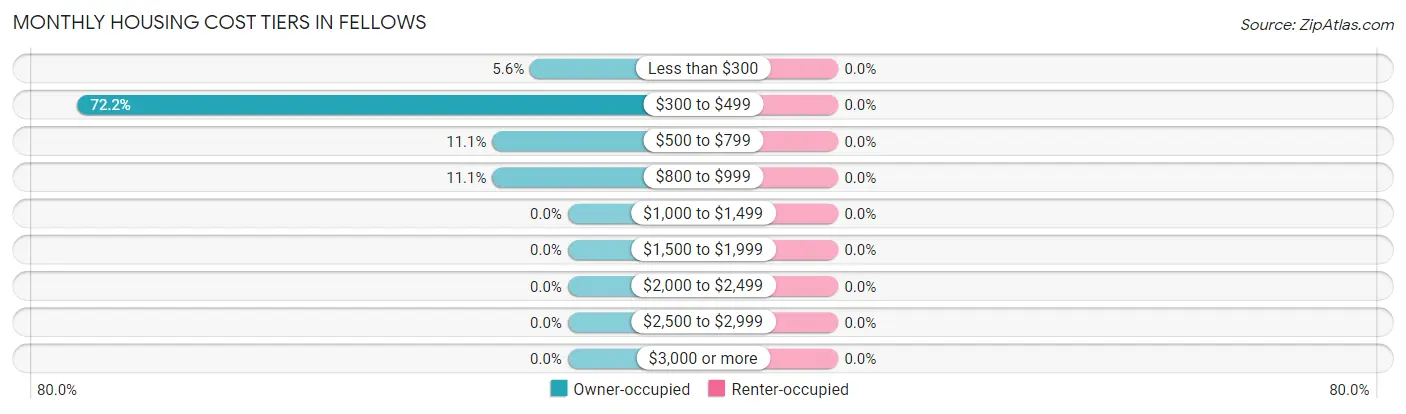
| Monthly Cost | Owner-occupied | Renter-occupied |
| Less than $300 | 1 (5.6%) | 0 (0.0%) |
| $300 to $499 | 13 (72.2%) | 0 (0.0%) |
| $500 to $799 | 2 (11.1%) | 0 (0.0%) |
| $800 to $999 | 2 (11.1%) | 0 (0.0%) |
| $1,000 to $1,499 | 0 (0.0%) | 0 (0.0%) |
| $1,500 to $1,999 | 0 (0.0%) | 0 (0.0%) |
| $2,000 to $2,499 | 0 (0.0%) | 0 (0.0%) |
| $2,500 to $2,999 | 0 (0.0%) | 0 (0.0%) |
| $3,000 or more | 0 (0.0%) | 0 (0.0%) |
| Total | 18 (100.0%) | 1 (100.0%) |
Physical Housing Characteristics in Fellows
Housing Structures in Fellows
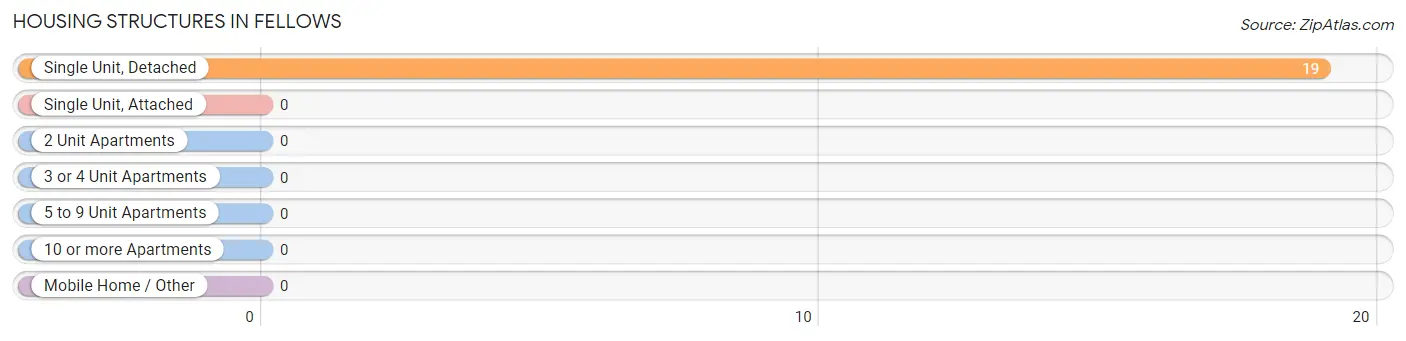
| Structure Type | # Housing Units | % Housing Units |
| Single Unit, Detached | 19 | 100.0% |
| Single Unit, Attached | 0 | 0.0% |
| 2 Unit Apartments | 0 | 0.0% |
| 3 or 4 Unit Apartments | 0 | 0.0% |
| 5 to 9 Unit Apartments | 0 | 0.0% |
| 10 or more Apartments | 0 | 0.0% |
| Mobile Home / Other | 0 | 0.0% |
| Total | 19 | 100.0% |
Housing Structures by Occupancy in Fellows
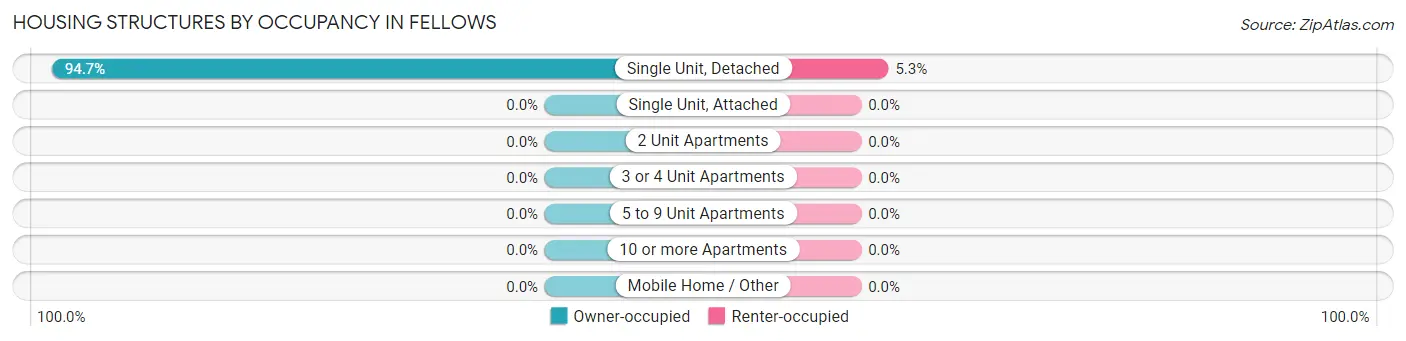
| Structure Type | Owner-occupied | Renter-occupied |
| Single Unit, Detached | 18 (94.7%) | 1 (5.3%) |
| Single Unit, Attached | 0 (0.0%) | 0 (0.0%) |
| 2 Unit Apartments | 0 (0.0%) | 0 (0.0%) |
| 3 or 4 Unit Apartments | 0 (0.0%) | 0 (0.0%) |
| 5 to 9 Unit Apartments | 0 (0.0%) | 0 (0.0%) |
| 10 or more Apartments | 0 (0.0%) | 0 (0.0%) |
| Mobile Home / Other | 0 (0.0%) | 0 (0.0%) |
| Total | 18 (94.7%) | 1 (5.3%) |
Housing Structures by Number of Rooms in Fellows
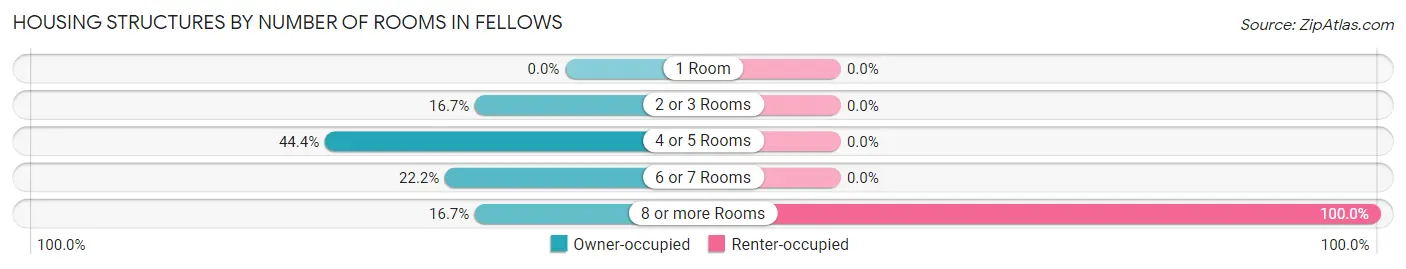
| Number of Rooms | Owner-occupied | Renter-occupied |
| 1 Room | 0 (0.0%) | 0 (0.0%) |
| 2 or 3 Rooms | 3 (16.7%) | 0 (0.0%) |
| 4 or 5 Rooms | 8 (44.4%) | 0 (0.0%) |
| 6 or 7 Rooms | 4 (22.2%) | 0 (0.0%) |
| 8 or more Rooms | 3 (16.7%) | 1 (100.0%) |
| Total | 18 (100.0%) | 1 (100.0%) |
Housing Structure by Heating Type in Fellows
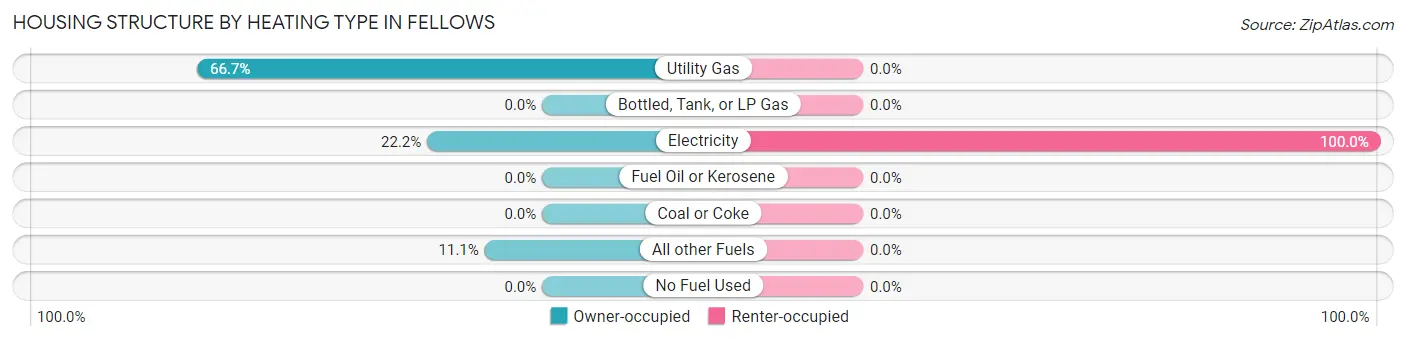
| Heating Type | Owner-occupied | Renter-occupied |
| Utility Gas | 12 (66.7%) | 0 (0.0%) |
| Bottled, Tank, or LP Gas | 0 (0.0%) | 0 (0.0%) |
| Electricity | 4 (22.2%) | 1 (100.0%) |
| Fuel Oil or Kerosene | 0 (0.0%) | 0 (0.0%) |
| Coal or Coke | 0 (0.0%) | 0 (0.0%) |
| All other Fuels | 2 (11.1%) | 0 (0.0%) |
| No Fuel Used | 0 (0.0%) | 0 (0.0%) |
| Total | 18 (100.0%) | 1 (100.0%) |
Household Vehicle Usage in Fellows
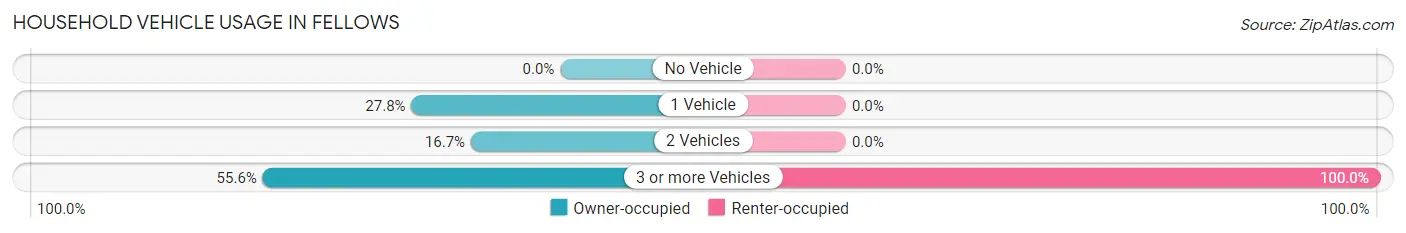
| Vehicles per Household | Owner-occupied | Renter-occupied |
| No Vehicle | 0 (0.0%) | 0 (0.0%) |
| 1 Vehicle | 5 (27.8%) | 0 (0.0%) |
| 2 Vehicles | 3 (16.7%) | 0 (0.0%) |
| 3 or more Vehicles | 10 (55.6%) | 1 (100.0%) |
| Total | 18 (100.0%) | 1 (100.0%) |
Real Estate & Mortgages in Fellows
Real Estate and Mortgage Overview in Fellows
| Characteristic | Without Mortgage | With Mortgage |
| Housing Units | 18 | 0 |
| Median Property Value | $92,500 | $0 |
| Median Household Income | $156,250 | $0 |
| Monthly Housing Costs | $381 | $0 |
| Real Estate Taxes | - | - |
Property Value by Mortgage Status in Fellows
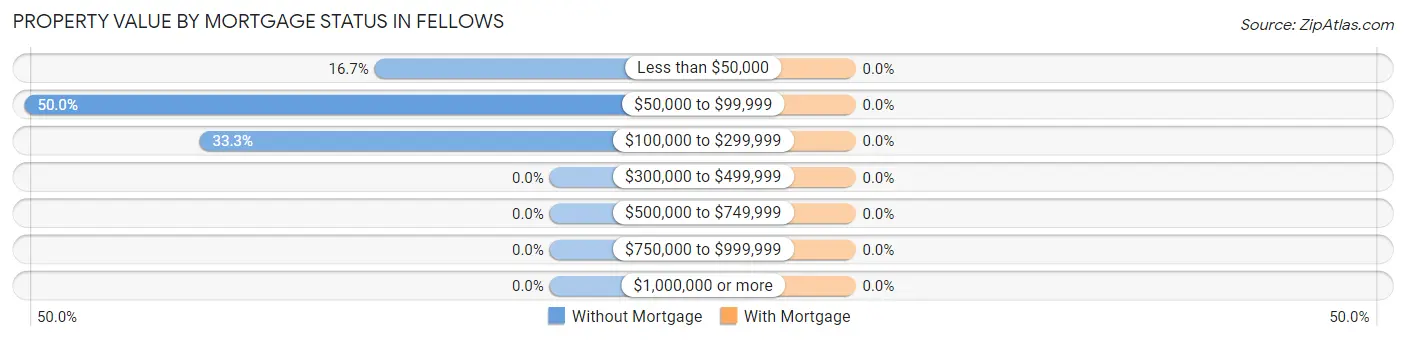
| Property Value | Without Mortgage | With Mortgage |
| Less than $50,000 | 3 (16.7%) | 0 (0.0%) |
| $50,000 to $99,999 | 9 (50.0%) | 0 (0.0%) |
| $100,000 to $299,999 | 6 (33.3%) | 0 (0.0%) |
| $300,000 to $499,999 | 0 (0.0%) | 0 (0.0%) |
| $500,000 to $749,999 | 0 (0.0%) | 0 (0.0%) |
| $750,000 to $999,999 | 0 (0.0%) | 0 (0.0%) |
| $1,000,000 or more | 0 (0.0%) | 0 (0.0%) |
| Total | 18 (100.0%) | 0 (0.0%) |
Household Income by Mortgage Status in Fellows
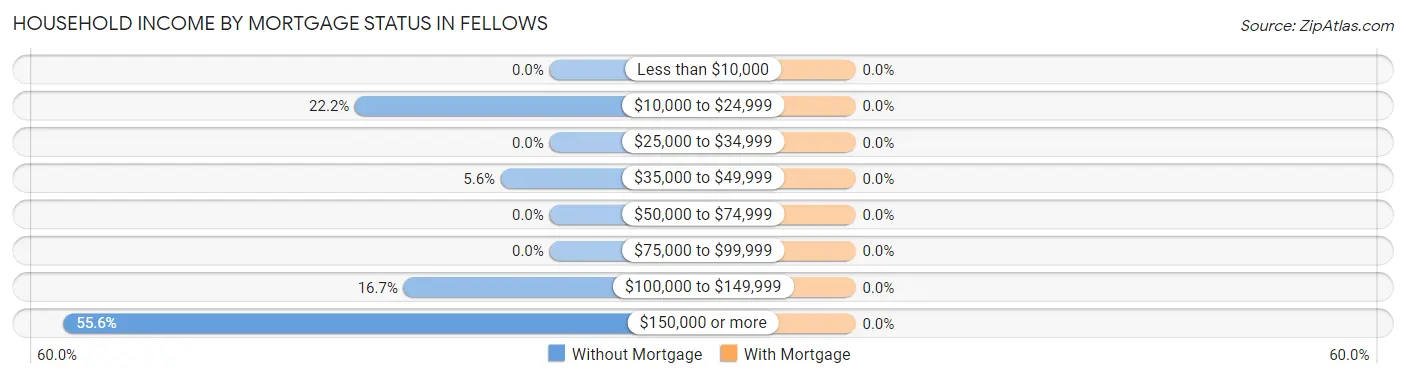
| Household Income | Without Mortgage | With Mortgage |
| Less than $10,000 | 0 (0.0%) | 0 (0.0%) |
| $10,000 to $24,999 | 4 (22.2%) | 0 (0.0%) |
| $25,000 to $34,999 | 0 (0.0%) | 0 (0.0%) |
| $35,000 to $49,999 | 1 (5.6%) | 0 (0.0%) |
| $50,000 to $74,999 | 0 (0.0%) | 0 (0.0%) |
| $75,000 to $99,999 | 0 (0.0%) | 0 (0.0%) |
| $100,000 to $149,999 | 3 (16.7%) | 0 (0.0%) |
| $150,000 or more | 10 (55.6%) | 0 (0.0%) |
| Total | 18 (100.0%) | 0 (0.0%) |
Property Value to Household Income Ratio in Fellows
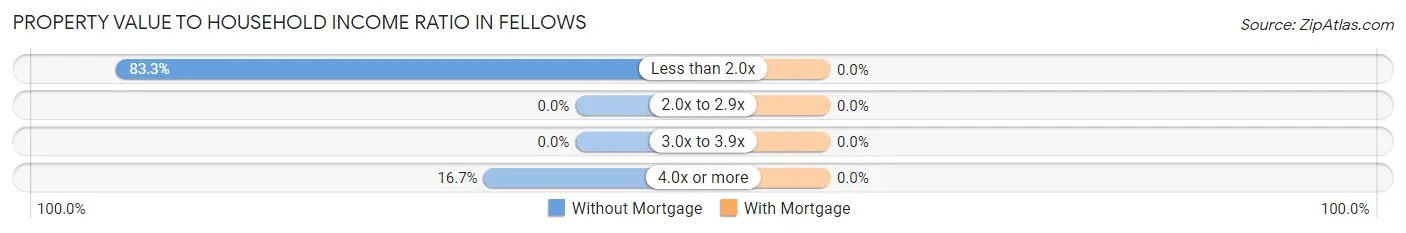
| Value-to-Income Ratio | Without Mortgage | With Mortgage |
| Less than 2.0x | 15 (83.3%) | 0 (0.0%) |
| 2.0x to 2.9x | 0 (0.0%) | 0 (0.0%) |
| 3.0x to 3.9x | 0 (0.0%) | 0 (0.0%) |
| 4.0x or more | 3 (16.7%) | 0 (0.0%) |
| Total | 18 (100.0%) | 0 (0.0%) |
Real Estate Taxes by Mortgage Status in Fellows
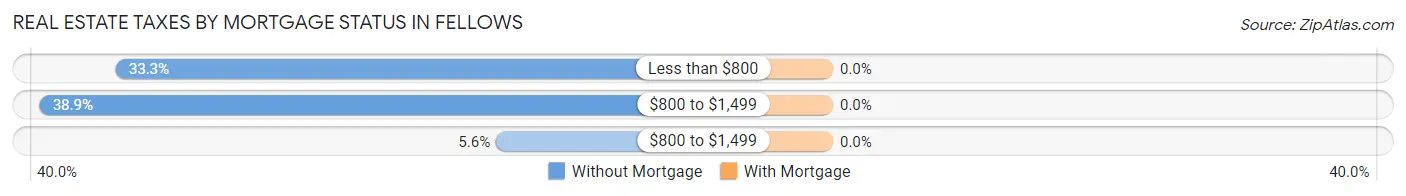
| Property Taxes | Without Mortgage | With Mortgage |
| Less than $800 | 6 (33.3%) | 0 (0.0%) |
| $800 to $1,499 | 7 (38.9%) | 0 (0.0%) |
| $800 to $1,499 | 1 (5.6%) | 0 (0.0%) |
| Total | 18 (100.0%) | 0 (0.0%) |
Health & Disability in Fellows
Health Insurance Coverage by Age in Fellows
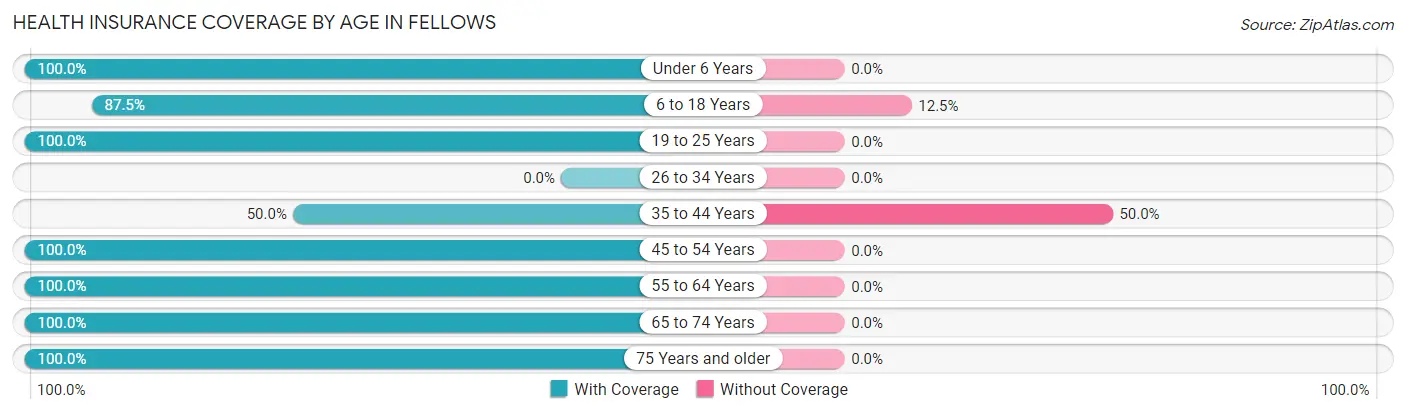
| Age Bracket | With Coverage | Without Coverage |
| Under 6 Years | 2 (100.0%) | 0 (0.0%) |
| 6 to 18 Years | 7 (87.5%) | 1 (12.5%) |
| 19 to 25 Years | 11 (100.0%) | 0 (0.0%) |
| 26 to 34 Years | 0 (0.0%) | 0 (0.0%) |
| 35 to 44 Years | 3 (50.0%) | 3 (50.0%) |
| 45 to 54 Years | 12 (100.0%) | 0 (0.0%) |
| 55 to 64 Years | 17 (100.0%) | 0 (0.0%) |
| 65 to 74 Years | 1 (100.0%) | 0 (0.0%) |
| 75 Years and older | 5 (100.0%) | 0 (0.0%) |
| Total | 58 (93.5%) | 4 (6.5%) |
Health Insurance Coverage by Citizenship Status in Fellows
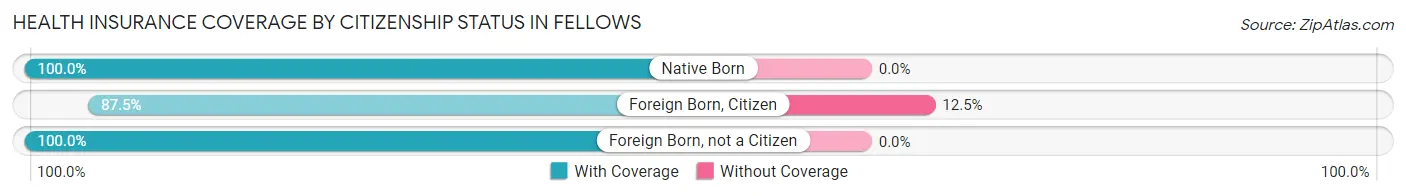
| Citizenship Status | With Coverage | Without Coverage |
| Native Born | 2 (100.0%) | 0 (0.0%) |
| Foreign Born, Citizen | 7 (87.5%) | 1 (12.5%) |
| Foreign Born, not a Citizen | 11 (100.0%) | 0 (0.0%) |
Health Insurance Coverage by Household Income in Fellows
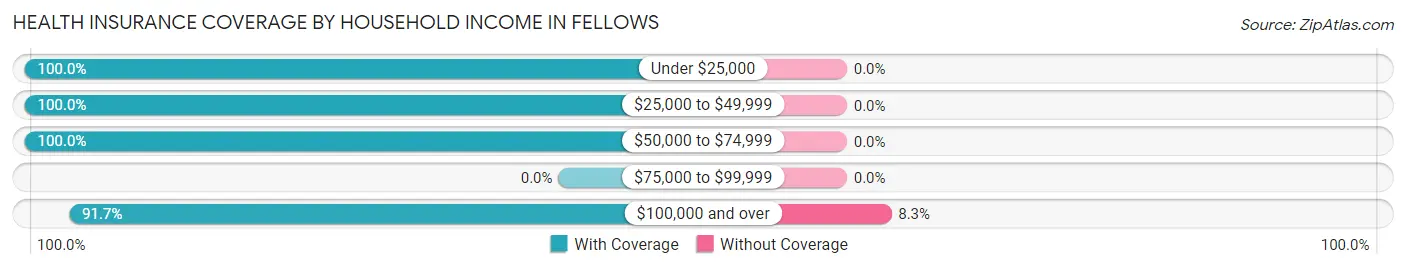
| Household Income | With Coverage | Without Coverage |
| Under $25,000 | 8 (100.0%) | 0 (0.0%) |
| $25,000 to $49,999 | 3 (100.0%) | 0 (0.0%) |
| $50,000 to $74,999 | 3 (100.0%) | 0 (0.0%) |
| $75,000 to $99,999 | 0 (0.0%) | 0 (0.0%) |
| $100,000 and over | 44 (91.7%) | 4 (8.3%) |
Public vs Private Health Insurance Coverage by Age in Fellows
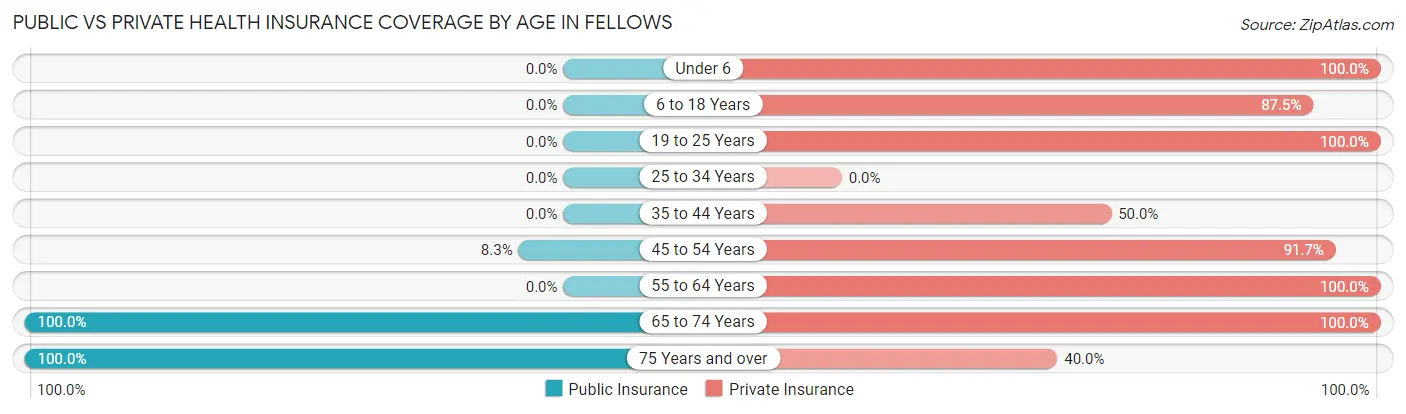
| Age Bracket | Public Insurance | Private Insurance |
| Under 6 | 0 (0.0%) | 2 (100.0%) |
| 6 to 18 Years | 0 (0.0%) | 7 (87.5%) |
| 19 to 25 Years | 0 (0.0%) | 11 (100.0%) |
| 25 to 34 Years | 0 (0.0%) | 0 (0.0%) |
| 35 to 44 Years | 0 (0.0%) | 3 (50.0%) |
| 45 to 54 Years | 1 (8.3%) | 11 (91.7%) |
| 55 to 64 Years | 0 (0.0%) | 17 (100.0%) |
| 65 to 74 Years | 1 (100.0%) | 1 (100.0%) |
| 75 Years and over | 5 (100.0%) | 2 (40.0%) |
| Total | 7 (11.3%) | 54 (87.1%) |
Disability Status by Sex by Age in Fellows
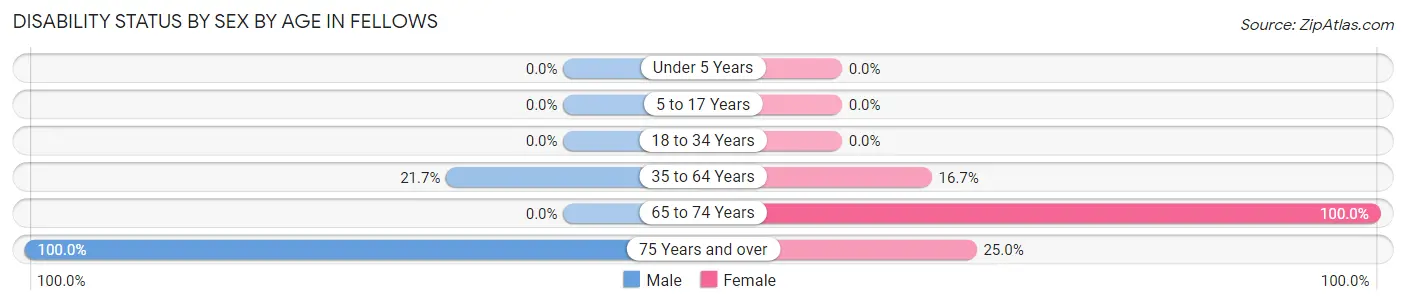
| Age Bracket | Male | Female |
| Under 5 Years | 0 (0.0%) | 0 (0.0%) |
| 5 to 17 Years | 0 (0.0%) | 0 (0.0%) |
| 18 to 34 Years | 0 (0.0%) | 0 (0.0%) |
| 35 to 64 Years | 5 (21.7%) | 2 (16.7%) |
| 65 to 74 Years | 0 (0.0%) | 1 (100.0%) |
| 75 Years and over | 1 (100.0%) | 1 (25.0%) |
Disability Class by Sex by Age in Fellows
Disability Class: Hearing Difficulty
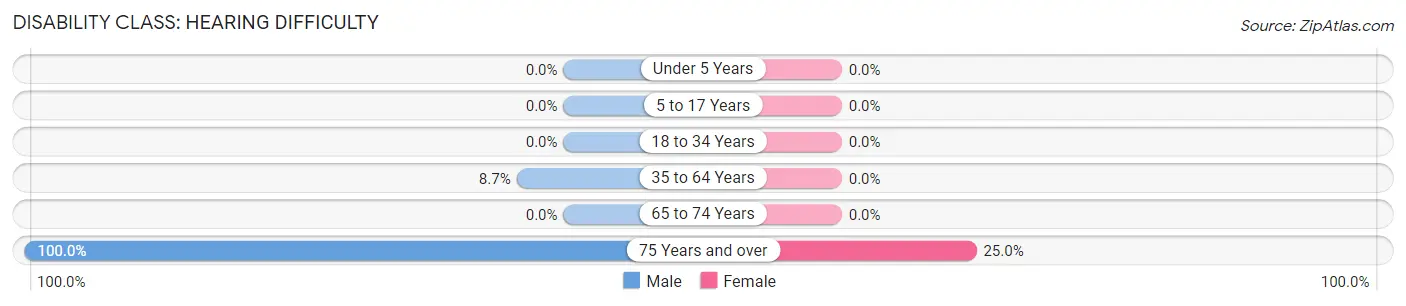
| Age Bracket | Male | Female |
| Under 5 Years | 0 (0.0%) | 0 (0.0%) |
| 5 to 17 Years | 0 (0.0%) | 0 (0.0%) |
| 18 to 34 Years | 0 (0.0%) | 0 (0.0%) |
| 35 to 64 Years | 2 (8.7%) | 0 (0.0%) |
| 65 to 74 Years | 0 (0.0%) | 0 (0.0%) |
| 75 Years and over | 1 (100.0%) | 1 (25.0%) |
Disability Class: Vision Difficulty
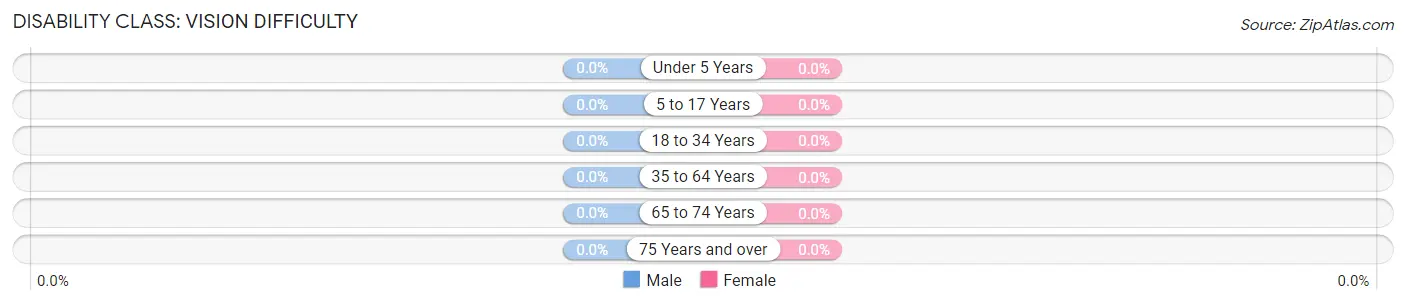
| Age Bracket | Male | Female |
| Under 5 Years | 0 (0.0%) | 0 (0.0%) |
| 5 to 17 Years | 0 (0.0%) | 0 (0.0%) |
| 18 to 34 Years | 0 (0.0%) | 0 (0.0%) |
| 35 to 64 Years | 0 (0.0%) | 0 (0.0%) |
| 65 to 74 Years | 0 (0.0%) | 0 (0.0%) |
| 75 Years and over | 0 (0.0%) | 0 (0.0%) |
Disability Class: Cognitive Difficulty
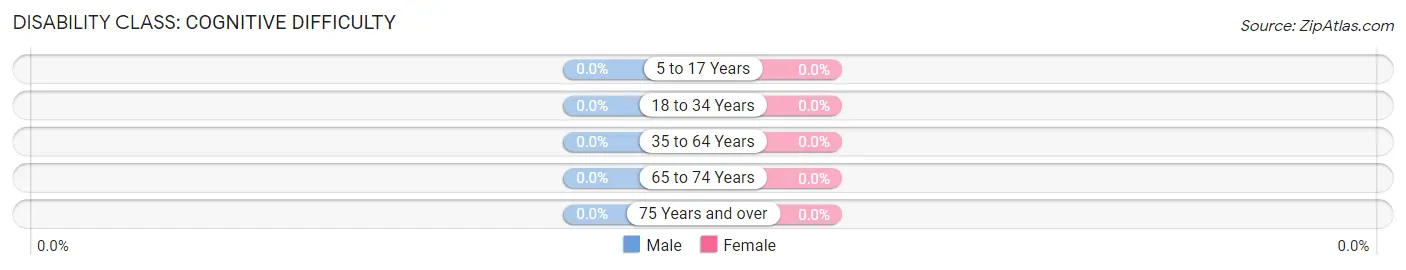
| Age Bracket | Male | Female |
| 5 to 17 Years | 0 (0.0%) | 0 (0.0%) |
| 18 to 34 Years | 0 (0.0%) | 0 (0.0%) |
| 35 to 64 Years | 0 (0.0%) | 0 (0.0%) |
| 65 to 74 Years | 0 (0.0%) | 0 (0.0%) |
| 75 Years and over | 0 (0.0%) | 0 (0.0%) |
Disability Class: Ambulatory Difficulty
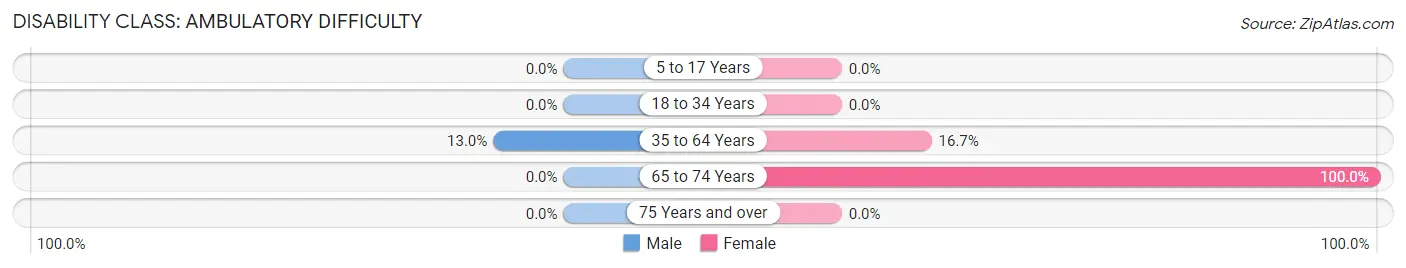
| Age Bracket | Male | Female |
| 5 to 17 Years | 0 (0.0%) | 0 (0.0%) |
| 18 to 34 Years | 0 (0.0%) | 0 (0.0%) |
| 35 to 64 Years | 3 (13.0%) | 2 (16.7%) |
| 65 to 74 Years | 0 (0.0%) | 1 (100.0%) |
| 75 Years and over | 0 (0.0%) | 0 (0.0%) |
Disability Class: Self-Care Difficulty
| Age Bracket | Male | Female |
| 5 to 17 Years | 0 (0.0%) | 0 (0.0%) |
| 18 to 34 Years | 0 (0.0%) | 0 (0.0%) |
| 35 to 64 Years | 0 (0.0%) | 0 (0.0%) |
| 65 to 74 Years | 0 (0.0%) | 0 (0.0%) |
| 75 Years and over | 0 (0.0%) | 0 (0.0%) |
Technology Access in Fellows
Computing Device Access in Fellows
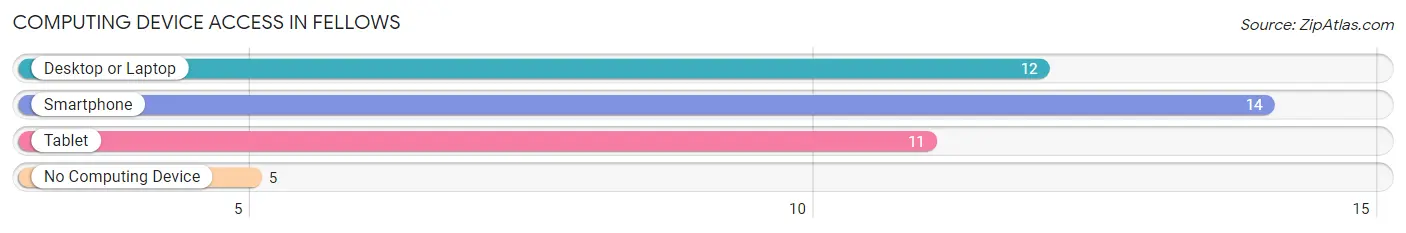
| Device Type | # Households | % Households |
| Desktop or Laptop | 12 | 63.2% |
| Smartphone | 14 | 73.7% |
| Tablet | 11 | 57.9% |
| No Computing Device | 5 | 26.3% |
| Total | 19 | 100.0% |
Internet Access in Fellows
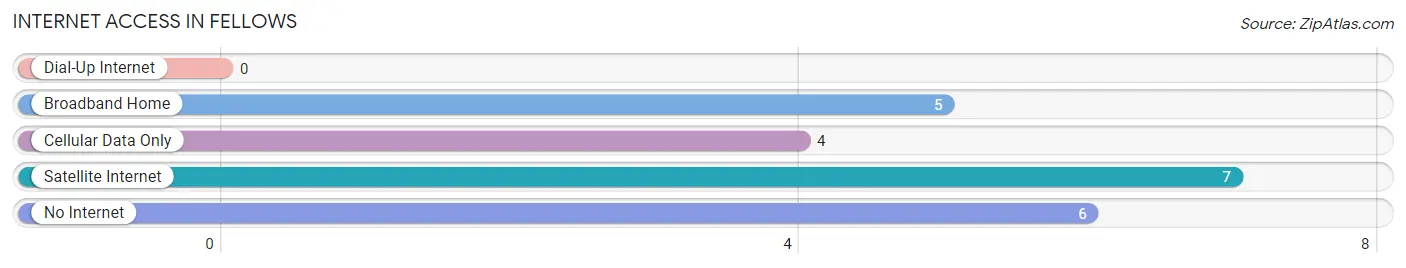
| Internet Type | # Households | % Households |
| Dial-Up Internet | 0 | 0.0% |
| Broadband Home | 5 | 26.3% |
| Cellular Data Only | 4 | 21.0% |
| Satellite Internet | 7 | 36.8% |
| No Internet | 6 | 31.6% |
| Total | 19 | 100.0% |
Fellows Summary
California is a state located on the western coast of the United States. It is the most populous state in the country, with a population of over 39 million people as of 2019. California is known for its diverse geography, ranging from the Pacific Coast to the Sierra Nevada Mountains, and its vibrant economy, which is the largest in the United States. California is also home to a variety of cultures, with a large Hispanic population and a large Asian population.
Geography
California is the third largest state in the United States, covering an area of 163,696 square miles. It is bordered by Oregon to the north, Nevada and Arizona to the east, and the Pacific Ocean to the west. California is divided into four distinct geographic regions: the Coastal Region, the Central Valley, the Sierra Nevada Mountains, and the Desert Region.
The Coastal Region is located along the Pacific Coast and is home to some of the most iconic cities in the United States, such as Los Angeles, San Francisco, and San Diego. This region is characterized by its mild climate and its beautiful beaches.
The Central Valley is located in the center of the state and is home to the state’s agricultural industry. This region is characterized by its flat terrain and its hot, dry summers.
The Sierra Nevada Mountains are located in the eastern part of the state and are home to some of the highest peaks in the United States. This region is characterized by its rugged terrain and its cold, snowy winters.
The Desert Region is located in the southeastern part of the state and is home to some of the driest and hottest climates in the United States. This region is characterized by its arid climate and its sparse vegetation.
Economy
California has the largest economy in the United States, with a gross domestic product (GDP) of $2.9 trillion in 2019. The state’s economy is driven by its diverse industries, including agriculture, technology, entertainment, and tourism.
Agriculture is a major industry in California, with the state producing a variety of crops, including grapes, almonds, and oranges. California is also the leading producer of dairy products in the United States.
Technology is another major industry in California, with Silicon Valley being home to some of the world’s largest technology companies, such as Apple, Google, and Facebook.
Entertainment is also a major industry in California, with Hollywood being home to some of the world’s largest movie and television studios.
Tourism is also a major industry in California, with the state being home to some of the most popular tourist destinations in the United States, such as Disneyland, Universal Studios, and Yosemite National Park.
Demographics
As of 2019, California had a population of 39.5 million people, making it the most populous state in the United States. The state is racially and ethnically diverse, with a large Hispanic population (38.9%) and a large Asian population (15.5%). The state is also home to a large African American population (6.5%) and a large Native American population (1.5%).
California is also home to a large immigrant population, with over 10 million immigrants living in the state as of 2019. The majority of these immigrants come from Mexico (47.3%), followed by China (7.2%), India (6.2%), and the Philippines (4.7%).
Conclusion
California is a state located on the western coast of the United States. It is the most populous state in the country, with a population of over 39 million people as of 2019. California is known for its diverse geography, ranging from the Pacific Coast to the Sierra Nevada Mountains, and its vibrant economy, which is the largest in the United States. California is also home to a variety of cultures, with a large Hispanic population and a large Asian population. The state’s economy is driven by its diverse industries, including agriculture, technology, entertainment, and tourism. California is also home to a large immigrant population, with over 10 million immigrants living in the state as of 2019.
Common Questions
What is Per Capita Income in Fellows?
Per Capita income in Fellows is $58,382.
What is the Median Family Income in Fellows?
Median Family Income in Fellows is $123,125.
What is the Median Household income in Fellows?
Median Household Income in Fellows is $153,750.
What is Income or Wage Gap in Fellows?
Income or Wage Gap in Fellows is 58.7%.
Women in Fellows earn 41.3 cents for every dollar earned by a man.
What is Inequality or Gini Index in Fellows?
Inequality or Gini Index in Fellows is 0.46.
What is the Total Population of Fellows?
Total Population of Fellows is 62.
What is the Total Male Population of Fellows?
Total Male Population of Fellows is 42.
What is the Total Female Population of Fellows?
Total Female Population of Fellows is 20.
What is the Ratio of Males per 100 Females in Fellows?
There are 210.00 Males per 100 Females in Fellows.
What is the Ratio of Females per 100 Males in Fellows?
There are 47.62 Females per 100 Males in Fellows.
What is the Median Population Age in Fellows?
Median Population Age in Fellows is 46.8 Years.
What is the Average Family Size in Fellows
Average Family Size in Fellows is 3.1 People.
What is the Average Household Size in Fellows
Average Household Size in Fellows is 3.3 People.
How Large is the Labor Force in Fellows?
There are 31 People in the Labor Forcein in Fellows.
What is the Percentage of People in the Labor Force in Fellows?
55.4% of People are in the Labor Force in Fellows.
What is the Unemployment Rate in Fellows?
Unemployment Rate in Fellows is 19.4%.