Cities with the Highest Percentage of Immigrants from Micronesia in California
RELATED REPORTS & OPTIONS
Micronesia
California
Compare Cities
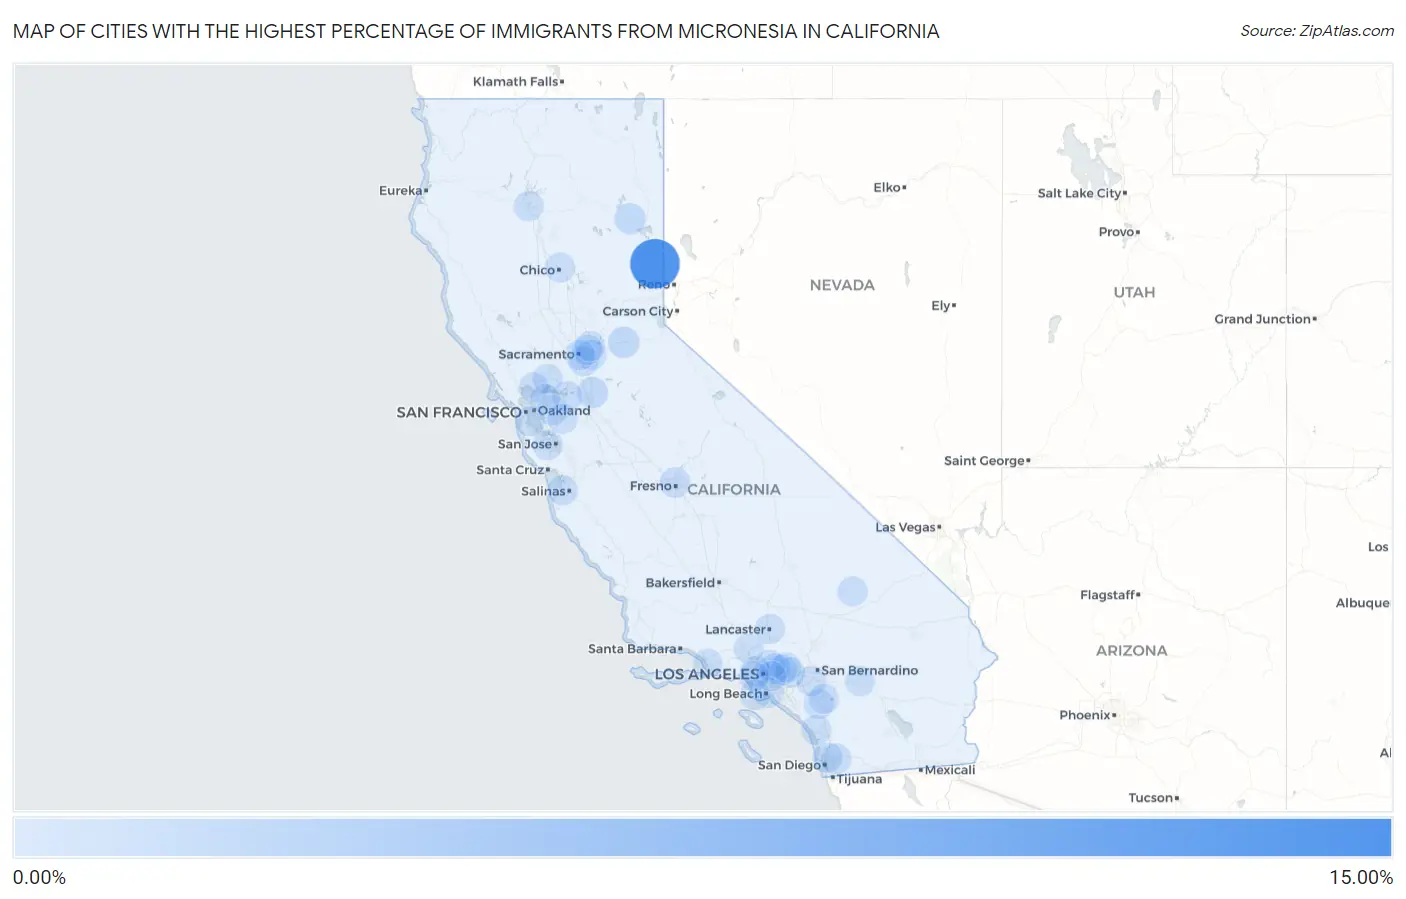
Map of Cities with the Highest Percentage of Immigrants from Micronesia in California
0.00%
15.00%
Cities with the Highest Percentage of Immigrants from Micronesia in California
| City | Micronesia | vs State | vs National | |
| 1. | Chilcoot Vinton | 10.70% | 0.0037%(+10.7)#-1 | 0.0099%(+10.7)#0 |
| 2. | Camino | 0.70% | 0.0037%(+0.696)#0 | 0.0099%(+0.689)#1 |
| 3. | Morada | 0.63% | 0.0037%(+0.626)#1 | 0.0099%(+0.620)#2 |
| 4. | Susanville | 0.58% | 0.0037%(+0.581)#2 | 0.0099%(+0.575)#3 |
| 5. | Vincent | 0.29% | 0.0037%(+0.291)#3 | 0.0099%(+0.285)#4 |
| 6. | Arcadia | 0.25% | 0.0037%(+0.251)#4 | 0.0099%(+0.245)#5 |
| 7. | Old Fig Garden | 0.23% | 0.0037%(+0.229)#5 | 0.0099%(+0.223)#6 |
| 8. | El Cajon | 0.12% | 0.0037%(+0.116)#9 | 0.0099%(+0.109)#294 |
| 9. | Rancho Cordova | 0.096% | 0.0037%(+0.092)#10 | 0.0099%(+0.086)#295 |
| 10. | West Hollywood | 0.091% | 0.0037%(+0.087)#11 | 0.0099%(+0.081)#296 |
| 11. | Marina | 0.090% | 0.0037%(+0.086)#12 | 0.0099%(+0.080)#297 |
| 12. | Oakley | 0.071% | 0.0037%(+0.068)#13 | 0.0099%(+0.061)#298 |
| 13. | Desert Hot Springs | 0.068% | 0.0037%(+0.064)#14 | 0.0099%(+0.058)#299 |
| 14. | Fort Irwin | 0.067% | 0.0037%(+0.063)#15 | 0.0099%(+0.057)#300 |
| 15. | Redding | 0.059% | 0.0037%(+0.055)#16 | 0.0099%(+0.049)#301 |
| 16. | Cupertino | 0.054% | 0.0037%(+0.050)#17 | 0.0099%(+0.044)#302 |
| 17. | South San Francisco | 0.046% | 0.0037%(+0.042)#18 | 0.0099%(+0.036)#303 |
| 18. | Oxnard | 0.045% | 0.0037%(+0.041)#19 | 0.0099%(+0.035)#304 |
| 19. | Vallejo | 0.042% | 0.0037%(+0.038)#20 | 0.0099%(+0.032)#305 |
| 20. | Danville | 0.035% | 0.0037%(+0.031)#21 | 0.0099%(+0.025)#306 |
| 21. | Pasadena | 0.033% | 0.0037%(+0.030)#22 | 0.0099%(+0.024)#307 |
| 22. | Florin | 0.030% | 0.0037%(+0.026)#23 | 0.0099%(+0.020)#308 |
| 23. | Carmichael | 0.029% | 0.0037%(+0.026)#24 | 0.0099%(+0.020)#309 |
| 24. | Sacramento | 0.023% | 0.0037%(+0.020)#25 | 0.0099%(+0.014)#310 |
| 25. | Chico | 0.018% | 0.0037%(+0.015)#26 | 0.0099%(+0.009)#311 |
| 26. | Livermore | 0.018% | 0.0037%(+0.015)#27 | 0.0099%(+0.008)#312 |
| 27. | Wildomar | 0.016% | 0.0037%(+0.013)#28 | 0.0099%(+0.006)#313 |
| 28. | Fairfield | 0.013% | 0.0037%(+0.009)#29 | 0.0099%(+0.003)#314 |
| 29. | Citrus Heights | 0.011% | 0.0037%(+0.008)#30 | 0.0099%(+0.002)#315 |
| 30. | Oceanside | 0.011% | 0.0037%(+0.007)#31 | 0.0099%(+0.001)#316 |
| 31. | Pomona | 0.0093% | 0.0037%(+0.006)#32 | 0.0099%(-0.001)#317 |
| 32. | Riverside | 0.0073% | 0.0037%(+0.004)#33 | 0.0099%(-0.003)#318 |
| 33. | Glendora | 0.0058% | 0.0037%(+0.002)#34 | 0.0099%(-0.004)#319 |
| 34. | Santa Clarita | 0.0053% | 0.0037%(+0.002)#35 | 0.0099%(-0.005)#320 |
| 35. | San Diego | 0.0048% | 0.0037%(+0.001)#36 | 0.0099%(-0.005)#356 |
| 36. | Long Beach | 0.0032% | 0.0037%(-0.000)#37 | 0.0099%(-0.007)#357 |
| 37. | Pleasant Hill | 0.0029% | 0.0037%(-0.001)#38 | 0.0099%(-0.007)#358 |
| 38. | Rancho Palos Verdes | 0.0024% | 0.0037%(-0.001)#39 | 0.0099%(-0.007)#359 |
| 39. | Montebello | 0.0016% | 0.0037%(-0.002)#40 | 0.0099%(-0.008)#360 |
| 40. | Los Angeles | 0.0012% | 0.0037%(-0.003)#41 | 0.0099%(-0.009)#361 |
| 41. | Menifee | 0.00096% | 0.0037%(-0.003)#42 | 0.0099%(-0.009)#362 |
| 42. | Lancaster | 0.00058% | 0.0037%(-0.003)#43 | 0.0099%(-0.009)#363 |
Common Questions
What are the Top 10 Cities with the Highest Percentage of Immigrants from Micronesia in California?
Top 10 Cities with the Highest Percentage of Immigrants from Micronesia in California are:
#1
10.70%
#2
0.70%
#3
0.63%
#4
0.58%
#5
0.29%
#6
0.25%
#7
0.23%
#8
0.12%
#9
0.096%
#10
0.091%
What city has the Highest Percentage of Immigrants from Micronesia in California?
Chilcoot Vinton has the Highest Percentage of Immigrants from Micronesia in California with 10.70%.
What is the Percentage of Immigrants from Micronesia in the State of California?
Percentage of Immigrants from Micronesia in California is 0.0037%.
What is the Percentage of Immigrants from Micronesia in the United States?
Percentage of Immigrants from Micronesia in the United States is 0.0099%.