Cities with the Highest Costs of Housing as Percentage of Income in California
RELATED REPORTS & OPTIONS
Highest Housing Costs / Income
California
Compare Cities
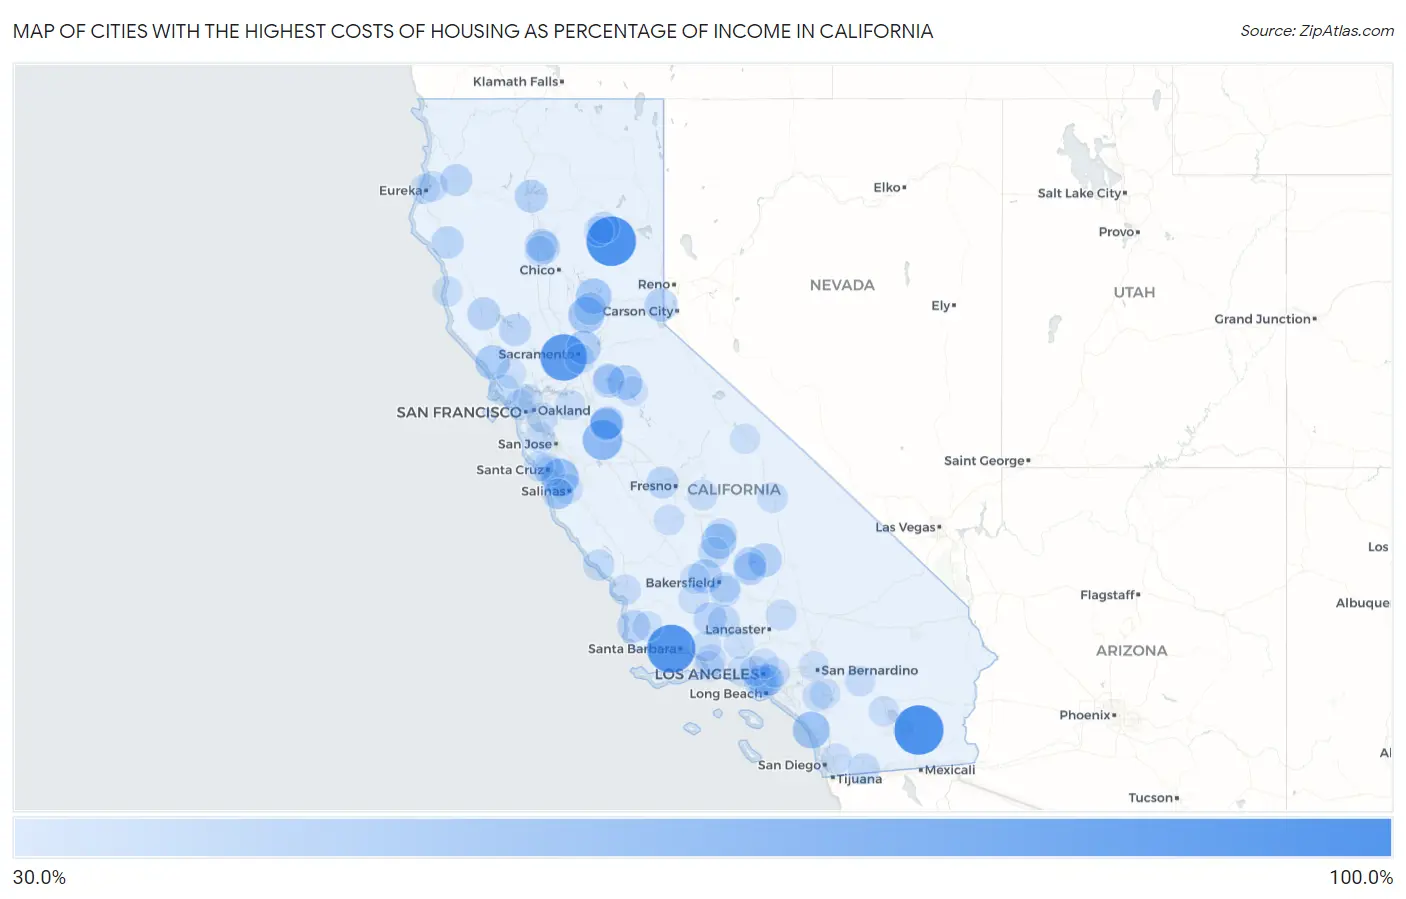
Map of Cities with the Highest Costs of Housing as Percentage of Income in California
0.0%
100.0%
Cities with the Highest Costs of Housing as Percentage of Income in California
| City | Housing Costs / Income | vs State | vs National | |
| 1. | Niland | 100.0% | 25.4%(+74.6)#1 | 20.4%(+79.6)#3 |
| 2. | Crescent Mills | 100.0% | 25.4%(+74.6)#2 | 20.4%(+79.6)#10 |
| 3. | Isla Vista | 95.3% | 25.4%(+69.9)#3 | 20.4%(+75.0)#17 |
| 4. | University Of California Davis | 89.2% | 25.4%(+63.8)#4 | 20.4%(+68.9)#19 |
| 5. | Camp Pendleton Mainside | 65.6% | 25.4%(+40.2)#5 | 20.4%(+45.3)#37 |
| 6. | Crows Landing | 64.4% | 25.4%(+39.0)#6 | 20.4%(+44.0)#39 |
| 7. | La Grange | 57.2% | 25.4%(+31.8)#7 | 20.4%(+36.9)#54 |
| 8. | Pajaro Dunes | 57.1% | 25.4%(+31.7)#8 | 20.4%(+36.7)#56 |
| 9. | Camp Pendleton South | 54.5% | 25.4%(+29.0)#9 | 20.4%(+34.1)#63 |
| 10. | Beale Afb | 51.0% | 25.4%(+25.6)#10 | 20.4%(+30.7)#74 |
| 11. | Dobbins | 49.8% | 25.4%(+24.3)#11 | 20.4%(+29.4)#80 |
| 12. | Terra Bella | 49.0% | 25.4%(+23.5)#12 | 20.4%(+28.6)#84 |
| 13. | Monte Rio | 45.9% | 25.4%(+20.5)#13 | 20.4%(+25.6)#105 |
| 14. | San Andreas | 45.9% | 25.4%(+20.5)#14 | 20.4%(+25.5)#106 |
| 15. | El Adobe | 45.3% | 25.4%(+19.9)#15 | 20.4%(+25.0)#110 |
| 16. | Mcclellan Park | 45.3% | 25.4%(+19.9)#16 | 20.4%(+24.9)#111 |
| 17. | Cherokee Strip | 43.7% | 25.4%(+18.3)#17 | 20.4%(+23.3)#132 |
| 18. | Onyx | 43.1% | 25.4%(+17.7)#18 | 20.4%(+22.8)#139 |
| 19. | Kings Beach | 41.7% | 25.4%(+16.3)#19 | 20.4%(+21.3)#156 |
| 20. | Lake Isabella | 41.6% | 25.4%(+16.2)#20 | 20.4%(+21.2)#157 |
| 21. | Mountain Gate | 41.1% | 25.4%(+15.7)#21 | 20.4%(+20.7)#164 |
| 22. | Talmage | 40.9% | 25.4%(+15.5)#22 | 20.4%(+20.5)#168 |
| 23. | Airport | 40.5% | 25.4%(+15.1)#23 | 20.4%(+20.2)#178 |
| 24. | Pine Mountain Club | 40.5% | 25.4%(+15.1)#24 | 20.4%(+20.1)#183 |
| 25. | Bodfish | 40.3% | 25.4%(+14.8)#25 | 20.4%(+19.9)#188 |
| 26. | Vandenberg Afb | 40.2% | 25.4%(+14.8)#26 | 20.4%(+19.8)#191 |
| 27. | Wallace | 40.1% | 25.4%(+14.7)#27 | 20.4%(+19.7)#192 |
| 28. | Smartsville | 39.9% | 25.4%(+14.5)#28 | 20.4%(+19.6)#194 |
| 29. | Los Molinos | 39.9% | 25.4%(+14.5)#29 | 20.4%(+19.5)#197 |
| 30. | Gerber | 39.3% | 25.4%(+13.9)#30 | 20.4%(+18.9)#209 |
| 31. | Bret Harte | 39.3% | 25.4%(+13.9)#31 | 20.4%(+18.9)#210 |
| 32. | Rouse | 39.1% | 25.4%(+13.6)#32 | 20.4%(+18.7)#219 |
| 33. | Garberville | 38.9% | 25.4%(+13.5)#33 | 20.4%(+18.6)#223 |
| 34. | Cudahy | 38.5% | 25.4%(+13.1)#34 | 20.4%(+18.1)#230 |
| 35. | Biola | 37.9% | 25.4%(+12.5)#35 | 20.4%(+17.5)#251 |
| 36. | Lower Lake | 37.7% | 25.4%(+12.3)#36 | 20.4%(+17.3)#258 |
| 37. | Willow Creek | 37.6% | 25.4%(+12.2)#37 | 20.4%(+17.3)#260 |
| 38. | Westmont | 37.4% | 25.4%(+12.0)#38 | 20.4%(+17.1)#272 |
| 39. | Frazier Park | 37.4% | 25.4%(+12.0)#39 | 20.4%(+17.1)#275 |
| 40. | Sage | 36.9% | 25.4%(+11.5)#40 | 20.4%(+16.6)#301 |
| 41. | Clear Creek | 36.7% | 25.4%(+11.3)#41 | 20.4%(+16.3)#311 |
| 42. | East Bakersfield | 36.7% | 25.4%(+11.2)#42 | 20.4%(+16.3)#315 |
| 43. | Whitmore | 36.4% | 25.4%(+11.0)#43 | 20.4%(+16.1)#327 |
| 44. | Petaluma Center | 36.0% | 25.4%(+10.6)#44 | 20.4%(+15.6)#349 |
| 45. | Campo | 35.7% | 25.4%(+10.3)#45 | 20.4%(+15.4)#366 |
| 46. | San Simeon | 35.5% | 25.4%(+10.1)#46 | 20.4%(+15.1)#371 |
| 47. | Willowbrook | 35.1% | 25.4%(+9.72)#47 | 20.4%(+14.8)#394 |
| 48. | Weedpatch | 35.0% | 25.4%(+9.55)#48 | 20.4%(+14.6)#407 |
| 49. | East Porterville | 34.8% | 25.4%(+9.39)#49 | 20.4%(+14.4)#419 |
| 50. | Point Reyes Station | 34.8% | 25.4%(+9.38)#50 | 20.4%(+14.4)#420 |
| 51. | Richgrove | 34.8% | 25.4%(+9.38)#51 | 20.4%(+14.4)#421 |
| 52. | Sand City | 34.5% | 25.4%(+9.12)#52 | 20.4%(+14.2)#433 |
| 53. | Marin City | 34.2% | 25.4%(+8.80)#53 | 20.4%(+13.8)#454 |
| 54. | Topanga | 34.0% | 25.4%(+8.54)#54 | 20.4%(+13.6)#477 |
| 55. | San Luis Obispo | 34.0% | 25.4%(+8.53)#55 | 20.4%(+13.6)#479 |
| 56. | Edwards Afb | 33.9% | 25.4%(+8.44)#56 | 20.4%(+13.5)#481 |
| 57. | Las Flores Cdp Tehama County | 33.8% | 25.4%(+8.34)#57 | 20.4%(+13.4)#492 |
| 58. | Arcata | 33.7% | 25.4%(+8.30)#58 | 20.4%(+13.4)#495 |
| 59. | Bell Gardens | 33.6% | 25.4%(+8.13)#59 | 20.4%(+13.2)#506 |
| 60. | Boronda | 33.5% | 25.4%(+8.07)#60 | 20.4%(+13.1)#510 |
| 61. | El Rio | 33.4% | 25.4%(+8.00)#61 | 20.4%(+13.0)#516 |
| 62. | Camanche North Shore | 33.2% | 25.4%(+7.80)#62 | 20.4%(+12.9)#530 |
| 63. | Orange Cove | 33.2% | 25.4%(+7.79)#63 | 20.4%(+12.8)#532 |
| 64. | El Centro Naval Air Facility | 33.1% | 25.4%(+7.63)#64 | 20.4%(+12.7)#549 |
| 65. | Lone Pine | 33.0% | 25.4%(+7.62)#65 | 20.4%(+12.7)#551 |
| 66. | South Taft | 32.9% | 25.4%(+7.49)#66 | 20.4%(+12.5)#567 |
| 67. | Richfield | 32.9% | 25.4%(+7.48)#67 | 20.4%(+12.5)#569 |
| 68. | Port Hueneme | 32.9% | 25.4%(+7.47)#68 | 20.4%(+12.5)#571 |
| 69. | Romoland | 32.9% | 25.4%(+7.44)#69 | 20.4%(+12.5)#574 |
| 70. | Stanford | 32.8% | 25.4%(+7.43)#70 | 20.4%(+12.5)#578 |
| 71. | Byron | 32.8% | 25.4%(+7.38)#71 | 20.4%(+12.4)#580 |
| 72. | Desert Hot Springs | 32.5% | 25.4%(+7.10)#72 | 20.4%(+12.1)#608 |
| 73. | Angels | 32.4% | 25.4%(+6.94)#73 | 20.4%(+12.0)#624 |
| 74. | Lemoore Station | 32.4% | 25.4%(+6.93)#74 | 20.4%(+12.0)#625 |
| 75. | Oasis | 32.4% | 25.4%(+6.93)#75 | 20.4%(+12.0)#626 |
| 76. | Beverly Hills | 32.3% | 25.4%(+6.91)#76 | 20.4%(+12.0)#628 |
| 77. | El Cajon | 32.3% | 25.4%(+6.84)#77 | 20.4%(+11.9)#639 |
| 78. | Fort Bragg | 32.1% | 25.4%(+6.65)#78 | 20.4%(+11.7)#656 |
| 79. | Pasatiempo | 32.0% | 25.4%(+6.62)#79 | 20.4%(+11.7)#659 |
| 80. | Twin Lakes | 31.9% | 25.4%(+6.50)#80 | 20.4%(+11.5)#673 |
| 81. | Ashland | 31.9% | 25.4%(+6.48)#81 | 20.4%(+11.5)#675 |
| 82. | Fuller Acres | 31.9% | 25.4%(+6.45)#82 | 20.4%(+11.5)#682 |
| 83. | Lake Almanor Country Club | 31.8% | 25.4%(+6.38)#83 | 20.4%(+11.4)#686 |
| 84. | Ojai | 31.8% | 25.4%(+6.38)#84 | 20.4%(+11.4)#688 |
| 85. | Meadowbrook | 31.8% | 25.4%(+6.36)#85 | 20.4%(+11.4)#689 |
| 86. | Lemon Hill | 31.8% | 25.4%(+6.36)#86 | 20.4%(+11.4)#691 |
| 87. | Davenport | 31.7% | 25.4%(+6.23)#87 | 20.4%(+11.3)#708 |
| 88. | Spring Valley Cdp Lake County | 31.6% | 25.4%(+6.22)#88 | 20.4%(+11.3)#709 |
| 89. | Los Alamos | 31.6% | 25.4%(+6.21)#89 | 20.4%(+11.3)#712 |
| 90. | Round Valley | 31.6% | 25.4%(+6.18)#90 | 20.4%(+11.2)#715 |
| 91. | Penngrove | 31.5% | 25.4%(+6.12)#91 | 20.4%(+11.2)#720 |
| 92. | El Monte | 31.5% | 25.4%(+6.12)#92 | 20.4%(+11.2)#721 |
| 93. | Glendale | 31.5% | 25.4%(+6.09)#93 | 20.4%(+11.1)#724 |
| 94. | North Richmond | 31.5% | 25.4%(+6.06)#94 | 20.4%(+11.1)#726 |
| 95. | Buttonwillow | 31.5% | 25.4%(+6.04)#95 | 20.4%(+11.1)#729 |
| 96. | Muscoy | 31.4% | 25.4%(+5.97)#96 | 20.4%(+11.0)#737 |
| 97. | Seaside | 31.4% | 25.4%(+5.94)#97 | 20.4%(+11.0)#742 |
| 98. | La Cresta | 31.3% | 25.4%(+5.88)#98 | 20.4%(+10.9)#748 |
| 99. | Hasley Canyon | 31.2% | 25.4%(+5.80)#99 | 20.4%(+10.8)#760 |
| 100. | Samoa | 31.2% | 25.4%(+5.77)#100 | 20.4%(+10.8)#765 |
Common Questions
What are the Top 10 Cities with the Highest Costs of Housing as Percentage of Income in California?
Top 10 Cities with the Highest Costs of Housing as Percentage of Income in California are:
#1
100.0%
#2
100.0%
#3
95.3%
#4
89.2%
#5
64.4%
#6
57.1%
#7
54.5%
#8
51.0%
#9
49.8%
#10
49.0%
What city has the Highest Costs of Housing as Percentage of Income in California?
Niland has the Highest Costs of Housing as Percentage of Income in California with 100.0%.
What is the Average Housing Costs as Percentage of Income in the State of California?
Average Housing Costs as Percentage of Income in California is 25.4%.
What is the Average Housing Costs as Percentage of Income in the United States?
Average Housing Costs as Percentage of Income in the United States is 20.4%.