Cities with the Most Immigrants from Scotland in California
RELATED REPORTS & OPTIONS
Scotland
California
Compare Cities
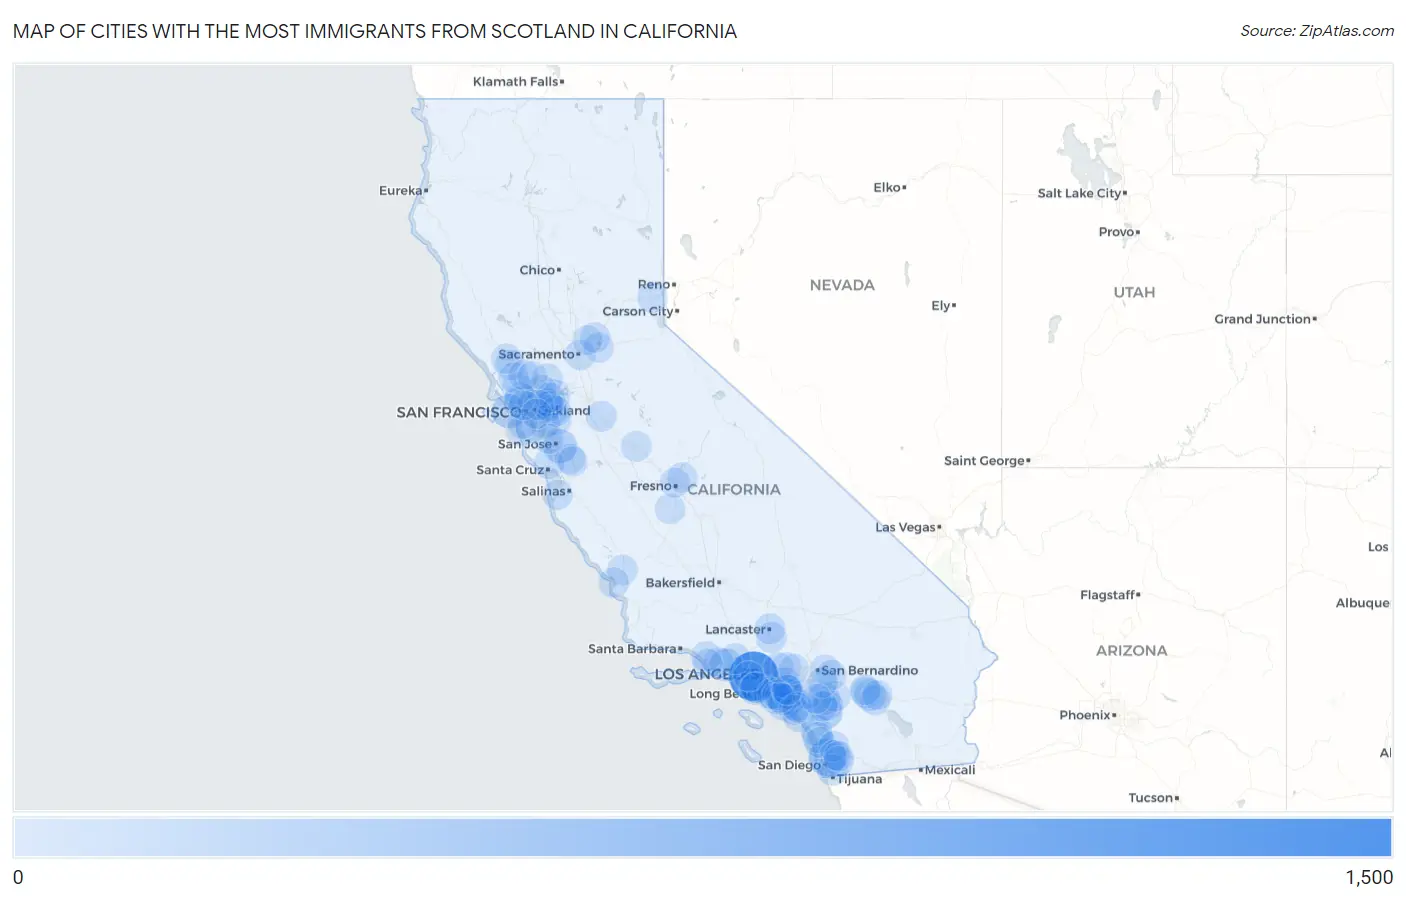
Map of Cities with the Most Immigrants from Scotland in California
0
1,500
Cities with the Most Immigrants from Scotland in California
| City | Scotland | vs State | vs National | |
| 1. | Los Angeles | 1,065 | 8,444(12.61%)#1 | 57,530(1.85%)#2 |
| 2. | San Diego | 412 | 8,444(4.88%)#2 | 57,530(0.72%)#4 |
| 3. | San Francisco | 214 | 8,444(2.53%)#3 | 57,530(0.37%)#8 |
| 4. | San Jose | 213 | 8,444(2.52%)#4 | 57,530(0.37%)#9 |
| 5. | Temecula | 161 | 8,444(1.91%)#5 | 57,530(0.28%)#24 |
| 6. | Thousand Oaks | 152 | 8,444(1.80%)#6 | 57,530(0.26%)#25 |
| 7. | Menifee | 130 | 8,444(1.54%)#7 | 57,530(0.23%)#34 |
| 8. | Long Beach | 113 | 8,444(1.34%)#8 | 57,530(0.20%)#44 |
| 9. | Torrance | 103 | 8,444(1.22%)#9 | 57,530(0.18%)#53 |
| 10. | Orange | 102 | 8,444(1.21%)#10 | 57,530(0.18%)#54 |
| 11. | Palm Desert | 101 | 8,444(1.20%)#11 | 57,530(0.18%)#57 |
| 12. | Irvine | 88 | 8,444(1.04%)#12 | 57,530(0.15%)#69 |
| 13. | Newport Beach | 83 | 8,444(0.98%)#13 | 57,530(0.14%)#75 |
| 14. | San Clemente | 81 | 8,444(0.96%)#14 | 57,530(0.14%)#78 |
| 15. | Oceanside | 79 | 8,444(0.94%)#15 | 57,530(0.14%)#84 |
| 16. | Huntington Beach | 78 | 8,444(0.92%)#16 | 57,530(0.14%)#86 |
| 17. | Rancho Mirage | 75 | 8,444(0.89%)#17 | 57,530(0.13%)#90 |
| 18. | Carlsbad | 73 | 8,444(0.86%)#18 | 57,530(0.13%)#94 |
| 19. | Mission Viejo | 72 | 8,444(0.85%)#19 | 57,530(0.13%)#96 |
| 20. | Redondo Beach | 71 | 8,444(0.84%)#20 | 57,530(0.12%)#98 |
| 21. | Novato | 68 | 8,444(0.81%)#21 | 57,530(0.12%)#105 |
| 22. | French Valley | 67 | 8,444(0.79%)#22 | 57,530(0.12%)#108 |
| 23. | Seal Beach | 67 | 8,444(0.79%)#23 | 57,530(0.12%)#109 |
| 24. | Chula Vista | 64 | 8,444(0.76%)#24 | 57,530(0.11%)#116 |
| 25. | Tustin | 63 | 8,444(0.75%)#25 | 57,530(0.11%)#120 |
| 26. | Simi Valley | 59 | 8,444(0.70%)#26 | 57,530(0.10%)#138 |
| 27. | Camarillo | 57 | 8,444(0.68%)#27 | 57,530(0.10%)#149 |
| 28. | Encinitas | 56 | 8,444(0.66%)#28 | 57,530(0.10%)#154 |
| 29. | La Quinta | 56 | 8,444(0.66%)#29 | 57,530(0.10%)#155 |
| 30. | Mill Valley | 54 | 8,444(0.64%)#30 | 57,530(0.09%)#164 |
| 31. | Pittsburg | 53 | 8,444(0.63%)#31 | 57,530(0.09%)#169 |
| 32. | Walnut Creek | 53 | 8,444(0.63%)#32 | 57,530(0.09%)#170 |
| 33. | Danville | 53 | 8,444(0.63%)#33 | 57,530(0.09%)#171 |
| 34. | Palmdale | 52 | 8,444(0.62%)#34 | 57,530(0.09%)#174 |
| 35. | Highland | 50 | 8,444(0.59%)#35 | 57,530(0.09%)#188 |
| 36. | Poway | 50 | 8,444(0.59%)#36 | 57,530(0.09%)#189 |
| 37. | Lancaster | 49 | 8,444(0.58%)#37 | 57,530(0.09%)#192 |
| 38. | Costa Mesa | 46 | 8,444(0.54%)#38 | 57,530(0.08%)#208 |
| 39. | Salida | 45 | 8,444(0.53%)#39 | 57,530(0.08%)#215 |
| 40. | Sacramento | 44 | 8,444(0.52%)#40 | 57,530(0.08%)#217 |
| 41. | Pleasanton | 44 | 8,444(0.52%)#41 | 57,530(0.08%)#220 |
| 42. | Scotts Valley | 44 | 8,444(0.52%)#42 | 57,530(0.08%)#223 |
| 43. | Templeton | 43 | 8,444(0.51%)#43 | 57,530(0.07%)#232 |
| 44. | Anaheim | 42 | 8,444(0.50%)#44 | 57,530(0.07%)#234 |
| 45. | Berkeley | 42 | 8,444(0.50%)#45 | 57,530(0.07%)#237 |
| 46. | Fairfield | 41 | 8,444(0.49%)#46 | 57,530(0.07%)#243 |
| 47. | Folsom | 41 | 8,444(0.49%)#47 | 57,530(0.07%)#244 |
| 48. | Merced | 40 | 8,444(0.47%)#48 | 57,530(0.07%)#251 |
| 49. | Morgan Hill | 40 | 8,444(0.47%)#49 | 57,530(0.07%)#252 |
| 50. | Benicia | 40 | 8,444(0.47%)#50 | 57,530(0.07%)#253 |
| 51. | Camino Tassajara | 40 | 8,444(0.47%)#51 | 57,530(0.07%)#256 |
| 52. | San Rafael | 39 | 8,444(0.46%)#52 | 57,530(0.07%)#260 |
| 53. | North Tustin | 37 | 8,444(0.44%)#53 | 57,530(0.06%)#283 |
| 54. | Santa Rosa | 36 | 8,444(0.43%)#54 | 57,530(0.06%)#289 |
| 55. | Hemet | 36 | 8,444(0.43%)#55 | 57,530(0.06%)#290 |
| 56. | Petaluma | 35 | 8,444(0.41%)#56 | 57,530(0.06%)#297 |
| 57. | Alamo | 34 | 8,444(0.40%)#57 | 57,530(0.06%)#311 |
| 58. | Larkfield Wikiup | 34 | 8,444(0.40%)#58 | 57,530(0.06%)#313 |
| 59. | Loomis | 34 | 8,444(0.40%)#59 | 57,530(0.06%)#314 |
| 60. | Westminster | 33 | 8,444(0.39%)#60 | 57,530(0.06%)#316 |
| 61. | Hayward | 32 | 8,444(0.38%)#61 | 57,530(0.06%)#325 |
| 62. | San Buenaventura Ventura | 32 | 8,444(0.38%)#62 | 57,530(0.06%)#326 |
| 63. | San Mateo | 32 | 8,444(0.38%)#63 | 57,530(0.06%)#327 |
| 64. | Brea | 32 | 8,444(0.38%)#64 | 57,530(0.06%)#329 |
| 65. | Temescal Valley | 32 | 8,444(0.38%)#65 | 57,530(0.06%)#332 |
| 66. | Laguna Niguel | 31 | 8,444(0.37%)#66 | 57,530(0.05%)#344 |
| 67. | Cathedral City | 31 | 8,444(0.37%)#67 | 57,530(0.05%)#347 |
| 68. | Murrieta | 30 | 8,444(0.36%)#68 | 57,530(0.05%)#354 |
| 69. | Sonoma | 30 | 8,444(0.36%)#69 | 57,530(0.05%)#365 |
| 70. | Yucaipa | 29 | 8,444(0.34%)#70 | 57,530(0.05%)#375 |
| 71. | Moreno Valley | 28 | 8,444(0.33%)#71 | 57,530(0.05%)#382 |
| 72. | Clovis | 28 | 8,444(0.33%)#72 | 57,530(0.05%)#383 |
| 73. | Monterey | 28 | 8,444(0.33%)#73 | 57,530(0.05%)#387 |
| 74. | Truckee | 28 | 8,444(0.33%)#74 | 57,530(0.05%)#389 |
| 75. | Riverdale | 28 | 8,444(0.33%)#75 | 57,530(0.05%)#396 |
| 76. | Oxnard | 27 | 8,444(0.32%)#76 | 57,530(0.05%)#401 |
| 77. | Morro Bay | 27 | 8,444(0.32%)#77 | 57,530(0.05%)#419 |
| 78. | Santa Monica | 26 | 8,444(0.31%)#78 | 57,530(0.05%)#423 |
| 79. | Ladera Ranch | 26 | 8,444(0.31%)#79 | 57,530(0.05%)#429 |
| 80. | Fountain Valley | 25 | 8,444(0.30%)#80 | 57,530(0.04%)#441 |
| 81. | Glendora | 24 | 8,444(0.28%)#81 | 57,530(0.04%)#451 |
| 82. | Fresno | 23 | 8,444(0.27%)#82 | 57,530(0.04%)#466 |
| 83. | Concord | 23 | 8,444(0.27%)#83 | 57,530(0.04%)#473 |
| 84. | Indio | 23 | 8,444(0.27%)#84 | 57,530(0.04%)#474 |
| 85. | Santee | 23 | 8,444(0.27%)#85 | 57,530(0.04%)#478 |
| 86. | Monrovia | 23 | 8,444(0.27%)#86 | 57,530(0.04%)#483 |
| 87. | Sunnyvale | 22 | 8,444(0.26%)#87 | 57,530(0.04%)#499 |
| 88. | Roseville | 22 | 8,444(0.26%)#88 | 57,530(0.04%)#500 |
| 89. | Rancho San Diego | 22 | 8,444(0.26%)#89 | 57,530(0.04%)#507 |
| 90. | San Martin | 22 | 8,444(0.26%)#90 | 57,530(0.04%)#515 |
| 91. | Claremont | 21 | 8,444(0.25%)#91 | 57,530(0.04%)#528 |
| 92. | Moss Beach | 21 | 8,444(0.25%)#92 | 57,530(0.04%)#540 |
| 93. | Napa | 20 | 8,444(0.24%)#93 | 57,530(0.03%)#546 |
| 94. | Lake Elsinore | 20 | 8,444(0.24%)#94 | 57,530(0.03%)#548 |
| 95. | Pacifica | 20 | 8,444(0.24%)#95 | 57,530(0.03%)#552 |
| 96. | Winter Gardens | 20 | 8,444(0.24%)#96 | 57,530(0.03%)#557 |
| 97. | Orinda | 20 | 8,444(0.24%)#97 | 57,530(0.03%)#558 |
| 98. | Tiburon | 20 | 8,444(0.24%)#98 | 57,530(0.03%)#566 |
| 99. | Villa Park | 20 | 8,444(0.24%)#99 | 57,530(0.03%)#571 |
| 100. | Oakland | 19 | 8,444(0.23%)#100 | 57,530(0.03%)#578 |
Common Questions
What are the Top 10 Cities with the Most Immigrants from Scotland in California?
Top 10 Cities with the Most Immigrants from Scotland in California are:
#1
1,065
#2
412
#3
214
#4
213
#5
161
#6
152
#7
130
#8
113
#9
103
#10
102
What city has the Most Immigrants from Scotland in California?
Los Angeles has the Most Immigrants from Scotland in California with 1,065.
What is the Total Immigrants from Scotland in the State of California?
Total Immigrants from Scotland in California is 8,444.
What is the Total Immigrants from Scotland in the United States?
Total Immigrants from Scotland in the United States is 57,530.