Cities with the Highest Percentage of Ghanaian Population in California
RELATED REPORTS & OPTIONS
Ghanaian
California
Compare Cities
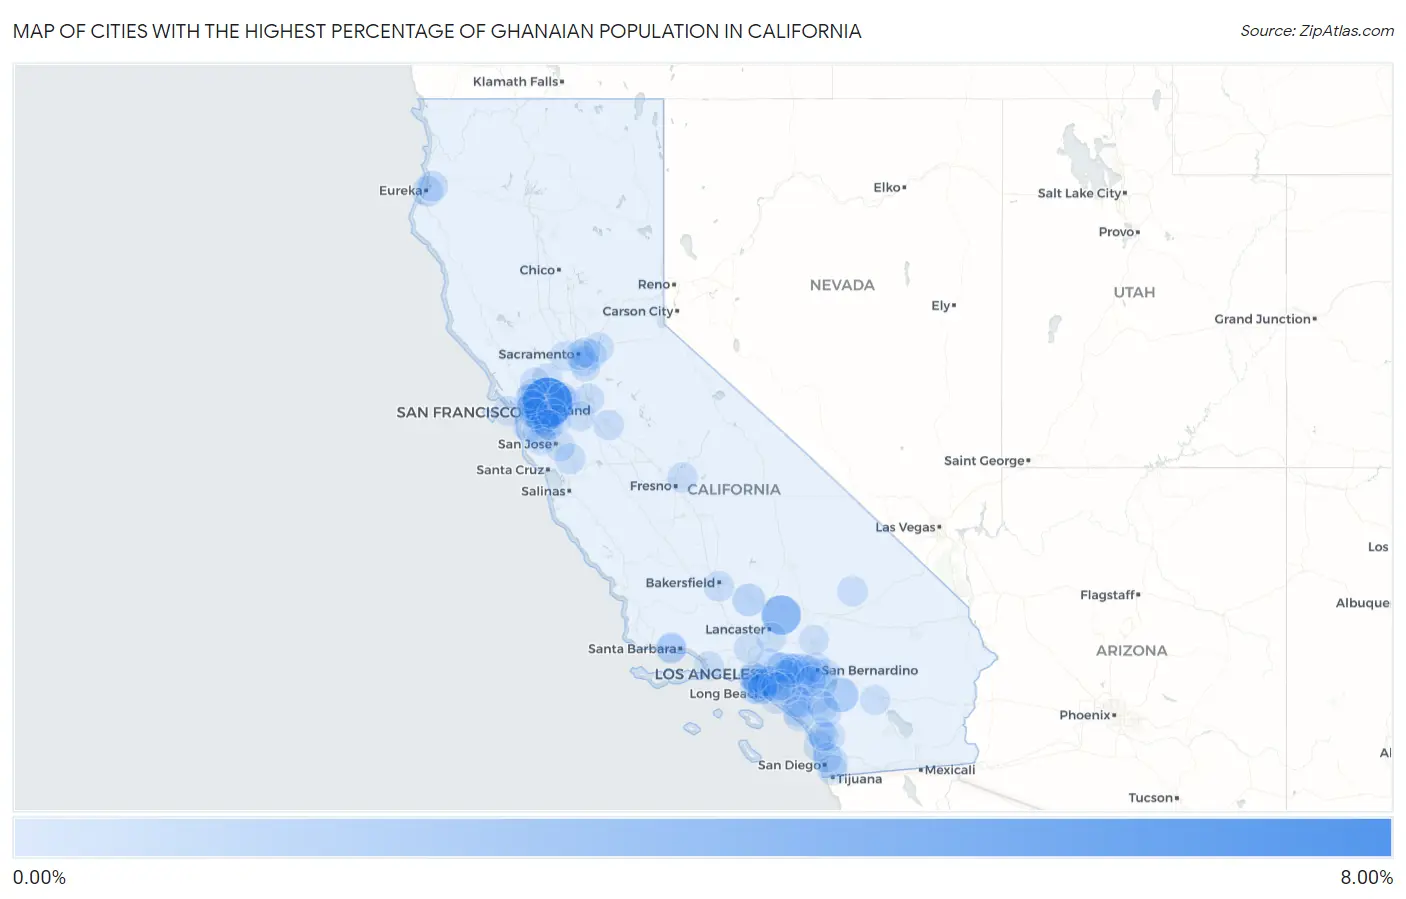
Map of Cities with the Highest Percentage of Ghanaian Population in California
0.00%
8.00%
Cities with the Highest Percentage of Ghanaian Population in California
| City | Ghanaian | vs State | vs National | |
| 1. | Shell Ridge | 6.92% | 0.024%(+6.89)#1 | 0.056%(+6.86)#3 |
| 2. | Edwards Afb | 3.19% | 0.024%(+3.17)#2 | 0.056%(+3.14)#28 |
| 3. | Valle Vista | 1.41% | 0.024%(+1.39)#3 | 0.056%(+1.36)#82 |
| 4. | Ashland | 1.12% | 0.024%(+1.10)#4 | 0.056%(+1.07)#119 |
| 5. | Tehachapi | 0.85% | 0.024%(+0.824)#5 | 0.056%(+0.792)#152 |
| 6. | Camp Pendleton Mainside | 0.53% | 0.024%(+0.507)#6 | 0.056%(+0.475)#244 |
| 7. | Emeryville | 0.49% | 0.024%(+0.467)#7 | 0.056%(+0.435)#268 |
| 8. | Burlingame | 0.32% | 0.024%(+0.299)#8 | 0.056%(+0.267)#369 |
| 9. | Eureka | 0.27% | 0.024%(+0.244)#9 | 0.056%(+0.212)#416 |
| 10. | Morgan Hill | 0.23% | 0.024%(+0.210)#10 | 0.056%(+0.178)#454 |
| 11. | Gardena | 0.22% | 0.024%(+0.191)#11 | 0.056%(+0.159)#482 |
| 12. | Eastvale | 0.19% | 0.024%(+0.166)#12 | 0.056%(+0.134)#517 |
| 13. | Arcata | 0.18% | 0.024%(+0.160)#13 | 0.056%(+0.127)#527 |
| 14. | Fort Irwin | 0.18% | 0.024%(+0.155)#14 | 0.056%(+0.122)#531 |
| 15. | Castro Valley | 0.17% | 0.024%(+0.146)#15 | 0.056%(+0.114)#546 |
| 16. | Lake Elsinore | 0.17% | 0.024%(+0.143)#16 | 0.056%(+0.111)#553 |
| 17. | Brentwood | 0.16% | 0.024%(+0.136)#17 | 0.056%(+0.104)#566 |
| 18. | Concord | 0.15% | 0.024%(+0.129)#18 | 0.056%(+0.097)#582 |
| 19. | La Mesa | 0.14% | 0.024%(+0.117)#19 | 0.056%(+0.085)#605 |
| 20. | Corona | 0.13% | 0.024%(+0.103)#20 | 0.056%(+0.071)#638 |
| 21. | Bakersfield | 0.12% | 0.024%(+0.097)#21 | 0.056%(+0.065)#653 |
| 22. | Hayward | 0.12% | 0.024%(+0.093)#22 | 0.056%(+0.061)#667 |
| 23. | Inglewood | 0.11% | 0.024%(+0.090)#23 | 0.056%(+0.058)#675 |
| 24. | Rancho Cucamonga | 0.11% | 0.024%(+0.083)#24 | 0.056%(+0.051)#690 |
| 25. | Stockton | 0.11% | 0.024%(+0.083)#25 | 0.056%(+0.051)#691 |
| 26. | Elk Grove | 0.096% | 0.024%(+0.072)#26 | 0.056%(+0.040)#723 |
| 27. | Solana Beach | 0.093% | 0.024%(+0.069)#27 | 0.056%(+0.037)#737 |
| 28. | Lake Forest | 0.088% | 0.024%(+0.064)#28 | 0.056%(+0.032)#762 |
| 29. | Fairfield | 0.087% | 0.024%(+0.063)#29 | 0.056%(+0.031)#769 |
| 30. | Upland | 0.086% | 0.024%(+0.062)#30 | 0.056%(+0.030)#772 |
| 31. | Ceres | 0.083% | 0.024%(+0.060)#31 | 0.056%(+0.027)#782 |
| 32. | Redlands | 0.083% | 0.024%(+0.059)#32 | 0.056%(+0.027)#783 |
| 33. | Ontario | 0.079% | 0.024%(+0.056)#33 | 0.056%(+0.023)#800 |
| 34. | Paramount | 0.079% | 0.024%(+0.055)#34 | 0.056%(+0.023)#805 |
| 35. | Alameda | 0.076% | 0.024%(+0.052)#35 | 0.056%(+0.020)#817 |
| 36. | Rancho Santa Margarita | 0.075% | 0.024%(+0.052)#36 | 0.056%(+0.019)#821 |
| 37. | Goleta | 0.074% | 0.024%(+0.050)#37 | 0.056%(+0.018)#826 |
| 38. | Clovis | 0.069% | 0.024%(+0.045)#38 | 0.056%(+0.013)#844 |
| 39. | West Carson | 0.067% | 0.024%(+0.044)#39 | 0.056%(+0.011)#850 |
| 40. | Hawthorne | 0.066% | 0.024%(+0.042)#40 | 0.056%(+0.010)#862 |
| 41. | Chula Vista | 0.062% | 0.024%(+0.038)#41 | 0.056%(+0.006)#882 |
| 42. | Claremont | 0.060% | 0.024%(+0.036)#42 | 0.056%(+0.004)#889 |
| 43. | Antioch | 0.057% | 0.024%(+0.034)#43 | 0.056%(+0.001)#898 |
| 44. | Los Angeles | 0.057% | 0.024%(+0.033)#44 | 0.056%(+0.001)#900 |
| 45. | American Canyon | 0.055% | 0.024%(+0.032)#45 | 0.056%(-0.001)#905 |
| 46. | Davis | 0.051% | 0.024%(+0.027)#46 | 0.056%(-0.005)#924 |
| 47. | Altadena | 0.049% | 0.024%(+0.025)#47 | 0.056%(-0.007)#933 |
| 48. | Redwood City | 0.046% | 0.024%(+0.022)#48 | 0.056%(-0.010)#953 |
| 49. | West Rancho Dominguez | 0.045% | 0.024%(+0.021)#49 | 0.056%(-0.011)#958 |
| 50. | Moreno Valley | 0.043% | 0.024%(+0.019)#50 | 0.056%(-0.013)#970 |
| 51. | La Verne | 0.042% | 0.024%(+0.018)#51 | 0.056%(-0.014)#977 |
| 52. | Downey | 0.037% | 0.024%(+0.013)#52 | 0.056%(-0.019)#1,005 |
| 53. | Escondido | 0.037% | 0.024%(+0.013)#53 | 0.056%(-0.019)#1,006 |
| 54. | San Juan Capistrano | 0.037% | 0.024%(+0.013)#54 | 0.056%(-0.019)#1,007 |
| 55. | Victorville | 0.035% | 0.024%(+0.011)#55 | 0.056%(-0.021)#1,025 |
| 56. | Vista | 0.035% | 0.024%(+0.011)#56 | 0.056%(-0.021)#1,029 |
| 57. | San Clemente | 0.034% | 0.024%(+0.010)#57 | 0.056%(-0.022)#1,031 |
| 58. | Rancho Cordova | 0.034% | 0.024%(+0.010)#58 | 0.056%(-0.022)#1,033 |
| 59. | Florin | 0.034% | 0.024%(+0.010)#59 | 0.056%(-0.022)#1,035 |
| 60. | San Bernardino | 0.032% | 0.024%(+0.008)#60 | 0.056%(-0.024)#1,046 |
| 61. | Port Hueneme | 0.032% | 0.024%(+0.008)#61 | 0.056%(-0.024)#1,047 |
| 62. | Torrance | 0.031% | 0.024%(+0.007)#62 | 0.056%(-0.025)#1,053 |
| 63. | Hercules | 0.031% | 0.024%(+0.007)#63 | 0.056%(-0.025)#1,055 |
| 64. | South Gate | 0.030% | 0.024%(+0.006)#64 | 0.056%(-0.026)#1,058 |
| 65. | Azusa | 0.030% | 0.024%(+0.006)#65 | 0.056%(-0.026)#1,060 |
| 66. | Colton | 0.030% | 0.024%(+0.006)#66 | 0.056%(-0.026)#1,063 |
| 67. | Folsom | 0.030% | 0.024%(+0.006)#67 | 0.056%(-0.026)#1,064 |
| 68. | Pleasanton | 0.029% | 0.024%(+0.005)#68 | 0.056%(-0.027)#1,070 |
| 69. | Palmdale | 0.026% | 0.024%(+0.003)#69 | 0.056%(-0.030)#1,088 |
| 70. | Oakland | 0.025% | 0.024%(+0.002)#70 | 0.056%(-0.031)#1,094 |
| 71. | San Jose | 0.025% | 0.024%(+0.001)#71 | 0.056%(-0.031)#1,098 |
| 72. | El Sobrante Cdp Riverside County | 0.025% | 0.024%(+0.001)#72 | 0.056%(-0.031)#1,100 |
| 73. | Sacramento | 0.024% | 0.024%(+0.000)#73 | 0.056%(-0.032)#1,106 |
| 74. | Huntington Beach | 0.024% | 0.024%(-0.000)#74 | 0.056%(-0.032)#1,107 |
| 75. | Palo Alto | 0.024% | 0.024%(-0.000)#75 | 0.056%(-0.032)#1,110 |
| 76. | Richmond | 0.022% | 0.024%(-0.002)#76 | 0.056%(-0.034)#1,122 |
| 77. | Walnut | 0.021% | 0.024%(-0.003)#77 | 0.056%(-0.035)#1,126 |
| 78. | Berkeley | 0.021% | 0.024%(-0.003)#78 | 0.056%(-0.035)#1,128 |
| 79. | Isla Vista | 0.020% | 0.024%(-0.003)#79 | 0.056%(-0.036)#1,131 |
| 80. | San Francisco | 0.020% | 0.024%(-0.004)#80 | 0.056%(-0.036)#1,132 |
| 81. | Culver City | 0.020% | 0.024%(-0.004)#81 | 0.056%(-0.036)#1,134 |
| 82. | Monrovia | 0.019% | 0.024%(-0.005)#82 | 0.056%(-0.037)#1,147 |
| 83. | Anaheim | 0.018% | 0.024%(-0.005)#83 | 0.056%(-0.038)#1,149 |
| 84. | Cerritos | 0.018% | 0.024%(-0.005)#84 | 0.056%(-0.038)#1,150 |
| 85. | Fontana | 0.018% | 0.024%(-0.006)#85 | 0.056%(-0.038)#1,152 |
| 86. | La Quinta | 0.016% | 0.024%(-0.008)#86 | 0.056%(-0.040)#1,170 |
| 87. | Union City | 0.014% | 0.024%(-0.009)#87 | 0.056%(-0.042)#1,181 |
| 88. | Fullerton | 0.013% | 0.024%(-0.010)#88 | 0.056%(-0.043)#1,189 |
| 89. | Tracy | 0.013% | 0.024%(-0.011)#89 | 0.056%(-0.043)#1,194 |
| 90. | Arden Arcade | 0.012% | 0.024%(-0.011)#90 | 0.056%(-0.043)#1,196 |
| 91. | Pomona | 0.012% | 0.024%(-0.012)#91 | 0.056%(-0.044)#1,201 |
| 92. | San Ramon | 0.010% | 0.024%(-0.013)#92 | 0.056%(-0.046)#1,216 |
| 93. | Santa Clarita | 0.010% | 0.024%(-0.014)#93 | 0.056%(-0.046)#1,219 |
| 94. | San Diego | 0.0096% | 0.024%(-0.014)#94 | 0.056%(-0.046)#1,222 |
| 95. | San Marcos | 0.0095% | 0.024%(-0.014)#95 | 0.056%(-0.046)#1,223 |
| 96. | Carson | 0.0095% | 0.024%(-0.014)#96 | 0.056%(-0.046)#1,224 |
| 97. | Murrieta | 0.0089% | 0.024%(-0.015)#97 | 0.056%(-0.047)#1,228 |
| 98. | Buena Park | 0.0084% | 0.024%(-0.015)#98 | 0.056%(-0.048)#1,231 |
| 99. | Temecula | 0.0082% | 0.024%(-0.016)#99 | 0.056%(-0.048)#1,232 |
| 100. | Riverside | 0.0079% | 0.024%(-0.016)#100 | 0.056%(-0.048)#1,236 |
Common Questions
What are the Top 10 Cities with the Highest Percentage of Ghanaian Population in California?
Top 10 Cities with the Highest Percentage of Ghanaian Population in California are:
#1
6.92%
#2
3.19%
#3
1.41%
#4
1.12%
#5
0.85%
#6
0.49%
#7
0.32%
#8
0.27%
#9
0.23%
#10
0.22%
What city has the Highest Percentage of Ghanaian Population in California?
Shell Ridge has the Highest Percentage of Ghanaian Population in California with 6.92%.
What is the Percentage of Ghanaian Population in the State of California?
Percentage of Ghanaian Population in California is 0.024%.
What is the Percentage of Ghanaian Population in the United States?
Percentage of Ghanaian Population in the United States is 0.056%.