Cities with the Highest Percentage of Hawaiian / Pacific Population in California
RELATED REPORTS & OPTIONS
Hawaiian / Pacific
California
Compare Cities
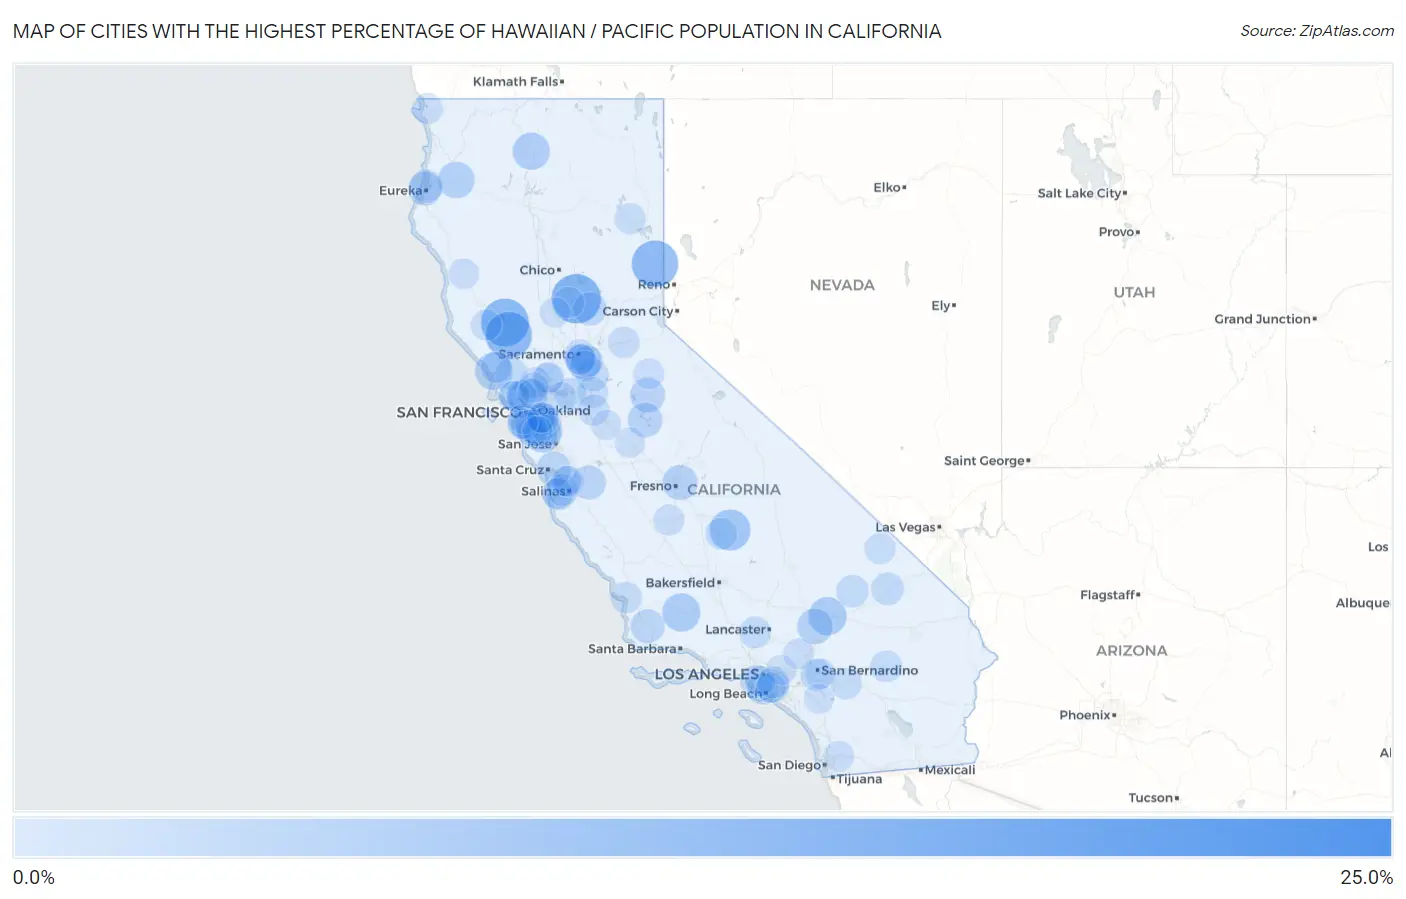
Map of Cities with the Highest Percentage of Hawaiian / Pacific Population in California
0.0%
25.0%
Cities with the Highest Percentage of Hawaiian / Pacific Population in California
| City | Hawaiian / Pacific | vs State | vs National | |
| 1. | Post Mountain | 21.8% | 0.38%(+21.4)#1 | 0.19%(+21.6)#34 |
| 2. | Honcut | 12.5% | 0.38%(+12.1)#2 | 0.19%(+12.3)#71 |
| 3. | Soda Bay | 11.5% | 0.38%(+11.1)#3 | 0.19%(+11.3)#79 |
| 4. | Chilcoot Vinton | 10.7% | 0.38%(+10.3)#4 | 0.19%(+10.5)#85 |
| 5. | Cobb | 10.7% | 0.38%(+10.3)#5 | 0.19%(+10.5)#86 |
| 6. | Springville | 7.3% | 0.38%(+6.90)#6 | 0.19%(+7.09)#136 |
| 7. | North Richmond | 6.6% | 0.38%(+6.18)#7 | 0.19%(+6.37)#149 |
| 8. | Del Dios | 6.0% | 0.38%(+5.57)#8 | 0.19%(+5.76)#163 |
| 9. | New Cuyama | 5.7% | 0.38%(+5.30)#9 | 0.19%(+5.49)#167 |
| 10. | Lenwood | 5.7% | 0.38%(+5.29)#10 | 0.19%(+5.49)#168 |
| 11. | Bodega | 5.3% | 0.38%(+4.92)#11 | 0.19%(+5.11)#184 |
| 12. | East Palo Alto | 5.3% | 0.38%(+4.92)#12 | 0.19%(+5.11)#185 |
| 13. | Mount Shasta | 5.0% | 0.38%(+4.66)#13 | 0.19%(+4.85)#194 |
| 14. | Willow Creek | 4.7% | 0.38%(+4.36)#14 | 0.19%(+4.55)#202 |
| 15. | Jones Valley | 4.4% | 0.38%(+4.06)#15 | 0.19%(+4.25)#216 |
| 16. | Silver Lakes | 4.1% | 0.38%(+3.70)#16 | 0.19%(+3.90)#234 |
| 17. | Florin | 4.0% | 0.38%(+3.62)#17 | 0.19%(+3.81)#235 |
| 18. | Tarpey Village | 4.0% | 0.38%(+3.57)#18 | 0.19%(+3.76)#237 |
| 19. | Mono Vista | 3.7% | 0.38%(+3.35)#19 | 0.19%(+3.54)#251 |
| 20. | Lake Don Pedro | 3.6% | 0.38%(+3.24)#20 | 0.19%(+3.43)#256 |
| 21. | Seacliff | 3.5% | 0.38%(+3.14)#21 | 0.19%(+3.33)#264 |
| 22. | Tres Pinos | 3.4% | 0.38%(+3.00)#22 | 0.19%(+3.19)#270 |
| 23. | Los Alamos | 3.2% | 0.38%(+2.85)#23 | 0.19%(+3.05)#287 |
| 24. | Samoa | 3.1% | 0.38%(+2.76)#24 | 0.19%(+2.95)#294 |
| 25. | Woody | 3.1% | 0.38%(+2.74)#25 | 0.19%(+2.94)#295 |
| 26. | San Bruno | 3.1% | 0.38%(+2.72)#26 | 0.19%(+2.91)#300 |
| 27. | Smartsville | 2.9% | 0.38%(+2.52)#27 | 0.19%(+2.71)#318 |
| 28. | Manila | 2.7% | 0.38%(+2.33)#28 | 0.19%(+2.53)#335 |
| 29. | Seaside | 2.7% | 0.38%(+2.27)#29 | 0.19%(+2.47)#340 |
| 30. | Artesia | 2.6% | 0.38%(+2.22)#30 | 0.19%(+2.41)#344 |
| 31. | Baker | 2.5% | 0.38%(+2.15)#31 | 0.19%(+2.34)#351 |
| 32. | Penngrove | 2.4% | 0.38%(+2.04)#32 | 0.19%(+2.24)#366 |
| 33. | Herald | 2.4% | 0.38%(+2.00)#33 | 0.19%(+2.19)#371 |
| 34. | Hayward | 2.4% | 0.38%(+1.97)#34 | 0.19%(+2.17)#372 |
| 35. | Lennox | 2.4% | 0.38%(+1.97)#35 | 0.19%(+2.17)#373 |
| 36. | Fort Irwin | 2.3% | 0.38%(+1.95)#36 | 0.19%(+2.14)#378 |
| 37. | Marina | 2.1% | 0.38%(+1.73)#37 | 0.19%(+1.92)#407 |
| 38. | Menlo Park | 2.0% | 0.38%(+1.62)#38 | 0.19%(+1.81)#431 |
| 39. | Grand Terrace | 2.0% | 0.38%(+1.59)#39 | 0.19%(+1.78)#438 |
| 40. | Bethel Island | 2.0% | 0.38%(+1.57)#40 | 0.19%(+1.77)#440 |
| 41. | East Porterville | 1.9% | 0.38%(+1.53)#41 | 0.19%(+1.73)#451 |
| 42. | Carson | 1.9% | 0.38%(+1.51)#42 | 0.19%(+1.71)#457 |
| 43. | El Sobrante Cdp Contra Costa County | 1.9% | 0.38%(+1.50)#43 | 0.19%(+1.70)#459 |
| 44. | Twentynine Palms | 1.9% | 0.38%(+1.50)#44 | 0.19%(+1.69)#460 |
| 45. | Elizabeth Lake | 1.9% | 0.38%(+1.49)#45 | 0.19%(+1.68)#462 |
| 46. | Camino | 1.8% | 0.38%(+1.47)#46 | 0.19%(+1.66)#465 |
| 47. | Pismo Beach | 1.8% | 0.38%(+1.44)#47 | 0.19%(+1.64)#469 |
| 48. | Sacramento | 1.8% | 0.38%(+1.43)#48 | 0.19%(+1.62)#473 |
| 49. | San Lorenzo | 1.8% | 0.38%(+1.43)#49 | 0.19%(+1.62)#474 |
| 50. | Santa Fe Springs | 1.8% | 0.38%(+1.42)#50 | 0.19%(+1.61)#478 |
| 51. | Cherryland | 1.8% | 0.38%(+1.38)#51 | 0.19%(+1.57)#488 |
| 52. | Morada | 1.7% | 0.38%(+1.30)#52 | 0.19%(+1.49)#509 |
| 53. | Cabazon | 1.6% | 0.38%(+1.26)#53 | 0.19%(+1.46)#519 |
| 54. | Pinon Hills | 1.6% | 0.38%(+1.24)#54 | 0.19%(+1.43)#524 |
| 55. | Tecopa | 1.6% | 0.38%(+1.22)#55 | 0.19%(+1.42)#533 |
| 56. | Live Oak | 1.6% | 0.38%(+1.21)#56 | 0.19%(+1.41)#535 |
| 57. | Susanville | 1.6% | 0.38%(+1.21)#57 | 0.19%(+1.40)#536 |
| 58. | Manteca | 1.6% | 0.38%(+1.19)#58 | 0.19%(+1.39)#538 |
| 59. | Vineyard | 1.6% | 0.38%(+1.19)#59 | 0.19%(+1.39)#539 |
| 60. | Millbrae | 1.6% | 0.38%(+1.17)#60 | 0.19%(+1.36)#547 |
| 61. | Prunedale | 1.5% | 0.38%(+1.17)#61 | 0.19%(+1.36)#549 |
| 62. | American Canyon | 1.5% | 0.38%(+1.13)#62 | 0.19%(+1.32)#555 |
| 63. | Occidental | 1.5% | 0.38%(+1.13)#63 | 0.19%(+1.32)#556 |
| 64. | Fairfax | 1.5% | 0.38%(+1.12)#64 | 0.19%(+1.32)#557 |
| 65. | Elk Grove | 1.5% | 0.38%(+1.11)#65 | 0.19%(+1.31)#558 |
| 66. | Hopland | 1.5% | 0.38%(+1.08)#66 | 0.19%(+1.27)#565 |
| 67. | Green Valley Cdp Solano County | 1.5% | 0.38%(+1.07)#67 | 0.19%(+1.26)#567 |
| 68. | San Mateo | 1.4% | 0.38%(+1.06)#68 | 0.19%(+1.26)#569 |
| 69. | Wrightwood | 1.4% | 0.38%(+1.03)#69 | 0.19%(+1.22)#577 |
| 70. | Dorrington | 1.4% | 0.38%(+1.02)#70 | 0.19%(+1.22)#580 |
| 71. | Lemoore Station | 1.4% | 0.38%(+1.02)#71 | 0.19%(+1.22)#581 |
| 72. | Fort Dick | 1.4% | 0.38%(+1.01)#72 | 0.19%(+1.20)#586 |
| 73. | Lemon Hill | 1.4% | 0.38%(+1.01)#73 | 0.19%(+1.20)#587 |
| 74. | Fairfield | 1.4% | 0.38%(+0.998)#74 | 0.19%(+1.19)#591 |
| 75. | Newark | 1.4% | 0.38%(+0.976)#75 | 0.19%(+1.17)#601 |
| 76. | Parkway | 1.3% | 0.38%(+0.947)#76 | 0.19%(+1.14)#613 |
| 77. | San Leandro | 1.3% | 0.38%(+0.911)#77 | 0.19%(+1.11)#624 |
| 78. | Winter Gardens | 1.3% | 0.38%(+0.903)#78 | 0.19%(+1.10)#627 |
| 79. | Antioch | 1.3% | 0.38%(+0.890)#79 | 0.19%(+1.08)#633 |
| 80. | Suisun City | 1.3% | 0.38%(+0.888)#80 | 0.19%(+1.08)#635 |
| 81. | Laytonville | 1.3% | 0.38%(+0.886)#81 | 0.19%(+1.08)#636 |
| 82. | Sand City | 1.3% | 0.38%(+0.871)#82 | 0.19%(+1.07)#638 |
| 83. | Belmont | 1.3% | 0.38%(+0.868)#83 | 0.19%(+1.06)#639 |
| 84. | Loma Linda | 1.2% | 0.38%(+0.867)#84 | 0.19%(+1.06)#640 |
| 85. | Woodacre | 1.2% | 0.38%(+0.841)#85 | 0.19%(+1.04)#645 |
| 86. | Daly City | 1.2% | 0.38%(+0.836)#86 | 0.19%(+1.03)#648 |
| 87. | Ashland | 1.2% | 0.38%(+0.809)#87 | 0.19%(+1.00)#656 |
| 88. | Elkhorn | 1.2% | 0.38%(+0.785)#88 | 0.19%(+0.979)#664 |
| 89. | Pacifica | 1.2% | 0.38%(+0.774)#89 | 0.19%(+0.968)#668 |
| 90. | Meridian | 1.1% | 0.38%(+0.681)#90 | 0.19%(+0.875)#709 |
| 91. | Santa Venetia | 1.1% | 0.38%(+0.674)#91 | 0.19%(+0.868)#711 |
| 92. | Atwater | 1.1% | 0.38%(+0.670)#92 | 0.19%(+0.863)#713 |
| 93. | Modesto | 1.0% | 0.38%(+0.666)#93 | 0.19%(+0.860)#716 |
| 94. | Westmont | 1.0% | 0.38%(+0.664)#94 | 0.19%(+0.858)#717 |
| 95. | Hercules | 1.0% | 0.38%(+0.651)#95 | 0.19%(+0.844)#722 |
| 96. | Canyon Lake | 1.0% | 0.38%(+0.644)#96 | 0.19%(+0.838)#725 |
| 97. | Vincent | 1.0% | 0.38%(+0.626)#97 | 0.19%(+0.820)#733 |
| 98. | Lakewood | 1.00% | 0.38%(+0.614)#98 | 0.19%(+0.808)#744 |
| 99. | Vallejo | 0.99% | 0.38%(+0.611)#99 | 0.19%(+0.805)#745 |
| 100. | Redwood City | 0.99% | 0.38%(+0.603)#100 | 0.19%(+0.797)#748 |
Common Questions
What are the Top 10 Cities with the Highest Percentage of Hawaiian / Pacific Population in California?
Top 10 Cities with the Highest Percentage of Hawaiian / Pacific Population in California are:
#1
12.5%
#2
11.5%
#3
10.7%
#4
10.7%
#5
7.3%
#6
6.6%
#7
5.7%
#8
5.7%
#9
5.3%
#10
5.3%
What city has the Highest Percentage of Hawaiian / Pacific Population in California?
Honcut has the Highest Percentage of Hawaiian / Pacific Population in California with 12.5%.
What is the Percentage of Hawaiian / Pacific Population in the State of California?
Percentage of Hawaiian / Pacific Population in California is 0.38%.
What is the Percentage of Hawaiian / Pacific Population in the United States?
Percentage of Hawaiian / Pacific Population in the United States is 0.19%.