Cities with the Largest Mexican American Indian Community in California
RELATED REPORTS & OPTIONS
Mexican American Indian
California
Compare Cities
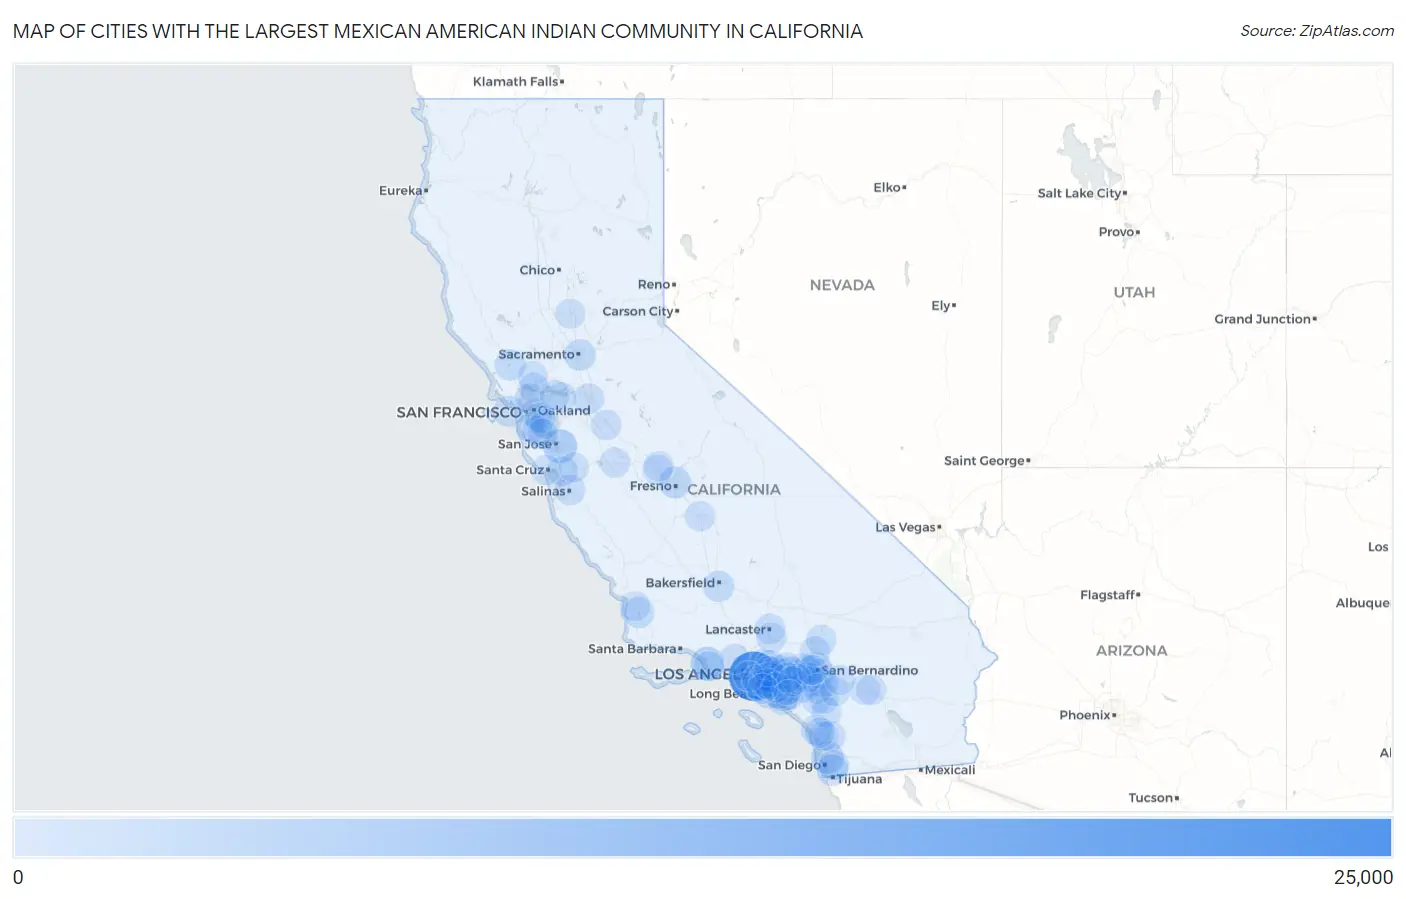
Map of Cities with the Largest Mexican American Indian Community in California
0
25,000
Cities with the Largest Mexican American Indian Community in California
| City | Mexican American Indian | vs State | vs National | |
| 1. | Los Angeles | 24,074 | 190,892(12.61%)#1 | 517,224(4.65%)#1 |
| 2. | San Jose | 5,024 | 190,892(2.63%)#2 | 517,224(0.97%)#6 |
| 3. | Oxnard | 4,602 | 190,892(2.41%)#3 | 517,224(0.89%)#8 |
| 4. | San Diego | 3,420 | 190,892(1.79%)#4 | 517,224(0.66%)#11 |
| 5. | Long Beach | 2,947 | 190,892(1.54%)#5 | 517,224(0.57%)#13 |
| 6. | Fresno | 2,550 | 190,892(1.34%)#6 | 517,224(0.49%)#15 |
| 7. | Santa Ana | 2,415 | 190,892(1.27%)#7 | 517,224(0.47%)#17 |
| 8. | Baldwin Park | 2,372 | 190,892(1.24%)#8 | 517,224(0.46%)#19 |
| 9. | Pomona | 2,130 | 190,892(1.12%)#9 | 517,224(0.41%)#20 |
| 10. | Oakland | 1,988 | 190,892(1.04%)#10 | 517,224(0.38%)#21 |
| 11. | Sacramento | 1,977 | 190,892(1.04%)#11 | 517,224(0.38%)#22 |
| 12. | Chula Vista | 1,972 | 190,892(1.03%)#12 | 517,224(0.38%)#23 |
| 13. | East Los Angeles | 1,832 | 190,892(0.96%)#13 | 517,224(0.35%)#27 |
| 14. | Bakersfield | 1,803 | 190,892(0.94%)#14 | 517,224(0.35%)#29 |
| 15. | San Francisco | 1,801 | 190,892(0.94%)#15 | 517,224(0.35%)#30 |
| 16. | El Monte | 1,772 | 190,892(0.93%)#16 | 517,224(0.34%)#31 |
| 17. | Santa Rosa | 1,767 | 190,892(0.93%)#17 | 517,224(0.34%)#32 |
| 18. | Santa Maria | 1,763 | 190,892(0.92%)#18 | 517,224(0.34%)#33 |
| 19. | San Bernardino | 1,727 | 190,892(0.90%)#19 | 517,224(0.33%)#34 |
| 20. | Anaheim | 1,682 | 190,892(0.88%)#20 | 517,224(0.33%)#35 |
| 21. | Ontario | 1,596 | 190,892(0.84%)#21 | 517,224(0.31%)#37 |
| 22. | Hawthorne | 1,508 | 190,892(0.79%)#22 | 517,224(0.29%)#38 |
| 23. | Riverside | 1,374 | 190,892(0.72%)#23 | 517,224(0.27%)#40 |
| 24. | Stockton | 1,307 | 190,892(0.68%)#24 | 517,224(0.25%)#43 |
| 25. | Rancho Cucamonga | 1,286 | 190,892(0.67%)#25 | 517,224(0.25%)#45 |
| 26. | Oceanside | 1,207 | 190,892(0.63%)#26 | 517,224(0.23%)#47 |
| 27. | Downey | 1,159 | 190,892(0.61%)#27 | 517,224(0.22%)#50 |
| 28. | Pico Rivera | 1,145 | 190,892(0.60%)#28 | 517,224(0.22%)#51 |
| 29. | Redwood City | 1,129 | 190,892(0.59%)#29 | 517,224(0.22%)#52 |
| 30. | Corona | 1,101 | 190,892(0.58%)#30 | 517,224(0.21%)#54 |
| 31. | Salinas | 1,092 | 190,892(0.57%)#31 | 517,224(0.21%)#55 |
| 32. | Moreno Valley | 1,055 | 190,892(0.55%)#32 | 517,224(0.20%)#58 |
| 33. | Escondido | 1,038 | 190,892(0.54%)#33 | 517,224(0.20%)#59 |
| 34. | Montebello | 1,028 | 190,892(0.54%)#34 | 517,224(0.20%)#62 |
| 35. | Lake Elsinore | 1,004 | 190,892(0.53%)#35 | 517,224(0.19%)#63 |
| 36. | Norwalk | 935 | 190,892(0.49%)#36 | 517,224(0.18%)#66 |
| 37. | San Leandro | 914 | 190,892(0.48%)#37 | 517,224(0.18%)#67 |
| 38. | Modesto | 912 | 190,892(0.48%)#38 | 517,224(0.18%)#69 |
| 39. | Garden Grove | 876 | 190,892(0.46%)#39 | 517,224(0.17%)#70 |
| 40. | Lancaster | 872 | 190,892(0.46%)#40 | 517,224(0.17%)#72 |
| 41. | Florence Graham | 868 | 190,892(0.45%)#41 | 517,224(0.17%)#73 |
| 42. | South Gate | 865 | 190,892(0.45%)#42 | 517,224(0.17%)#74 |
| 43. | Huntington Park | 860 | 190,892(0.45%)#43 | 517,224(0.17%)#76 |
| 44. | Fontana | 833 | 190,892(0.44%)#44 | 517,224(0.16%)#77 |
| 45. | Richmond | 758 | 190,892(0.40%)#45 | 517,224(0.15%)#87 |
| 46. | Palmdale | 742 | 190,892(0.39%)#46 | 517,224(0.14%)#89 |
| 47. | Apple Valley | 740 | 190,892(0.39%)#47 | 517,224(0.14%)#90 |
| 48. | Whittier | 722 | 190,892(0.38%)#48 | 517,224(0.14%)#93 |
| 49. | Los Banos | 719 | 190,892(0.38%)#49 | 517,224(0.14%)#94 |
| 50. | Simi Valley | 715 | 190,892(0.37%)#50 | 517,224(0.14%)#95 |
| 51. | Lynwood | 715 | 190,892(0.37%)#51 | 517,224(0.14%)#96 |
| 52. | Inglewood | 705 | 190,892(0.37%)#52 | 517,224(0.14%)#98 |
| 53. | West Covina | 695 | 190,892(0.36%)#53 | 517,224(0.13%)#102 |
| 54. | Napa | 690 | 190,892(0.36%)#54 | 517,224(0.13%)#103 |
| 55. | Gardena | 681 | 190,892(0.36%)#55 | 517,224(0.13%)#107 |
| 56. | Costa Mesa | 672 | 190,892(0.35%)#56 | 517,224(0.13%)#110 |
| 57. | San Mateo | 669 | 190,892(0.35%)#57 | 517,224(0.13%)#111 |
| 58. | East Palo Alto | 650 | 190,892(0.34%)#58 | 517,224(0.13%)#113 |
| 59. | Visalia | 648 | 190,892(0.34%)#59 | 517,224(0.13%)#114 |
| 60. | Hayward | 631 | 190,892(0.33%)#60 | 517,224(0.12%)#117 |
| 61. | Commerce | 630 | 190,892(0.33%)#61 | 517,224(0.12%)#118 |
| 62. | Orange | 627 | 190,892(0.33%)#62 | 517,224(0.12%)#121 |
| 63. | Bellflower | 627 | 190,892(0.33%)#63 | 517,224(0.12%)#122 |
| 64. | Cathedral City | 619 | 190,892(0.32%)#64 | 517,224(0.12%)#124 |
| 65. | Loma Linda | 618 | 190,892(0.32%)#65 | 517,224(0.12%)#125 |
| 66. | Glendale | 615 | 190,892(0.32%)#66 | 517,224(0.12%)#126 |
| 67. | Pasadena | 613 | 190,892(0.32%)#67 | 517,224(0.12%)#127 |
| 68. | Paramount | 611 | 190,892(0.32%)#68 | 517,224(0.12%)#128 |
| 69. | Watsonville | 609 | 190,892(0.32%)#69 | 517,224(0.12%)#132 |
| 70. | Vallejo | 598 | 190,892(0.31%)#70 | 517,224(0.12%)#134 |
| 71. | Glendora | 589 | 190,892(0.31%)#71 | 517,224(0.11%)#135 |
| 72. | Thousand Palms | 587 | 190,892(0.31%)#72 | 517,224(0.11%)#136 |
| 73. | Menifee | 585 | 190,892(0.31%)#73 | 517,224(0.11%)#137 |
| 74. | Jurupa Valley | 574 | 190,892(0.30%)#74 | 517,224(0.11%)#142 |
| 75. | Chino | 571 | 190,892(0.30%)#75 | 517,224(0.11%)#143 |
| 76. | Santa Cruz | 570 | 190,892(0.30%)#76 | 517,224(0.11%)#144 |
| 77. | La Presa | 569 | 190,892(0.30%)#77 | 517,224(0.11%)#145 |
| 78. | Hesperia | 566 | 190,892(0.30%)#78 | 517,224(0.11%)#146 |
| 79. | Mead Valley | 551 | 190,892(0.29%)#79 | 517,224(0.11%)#153 |
| 80. | Alhambra | 548 | 190,892(0.29%)#80 | 517,224(0.11%)#154 |
| 81. | Temecula | 547 | 190,892(0.29%)#81 | 517,224(0.11%)#155 |
| 82. | San Marcos | 527 | 190,892(0.28%)#82 | 517,224(0.10%)#157 |
| 83. | Gilroy | 527 | 190,892(0.28%)#83 | 517,224(0.10%)#158 |
| 84. | Madera | 521 | 190,892(0.27%)#84 | 517,224(0.10%)#161 |
| 85. | Port Hueneme | 518 | 190,892(0.27%)#85 | 517,224(0.10%)#164 |
| 86. | Antioch | 515 | 190,892(0.27%)#86 | 517,224(0.10%)#165 |
| 87. | Madera Acres | 505 | 190,892(0.26%)#87 | 517,224(0.10%)#168 |
| 88. | Nipomo | 504 | 190,892(0.26%)#88 | 517,224(0.10%)#170 |
| 89. | Pittsburg | 498 | 190,892(0.26%)#89 | 517,224(0.10%)#172 |
| 90. | Buena Park | 496 | 190,892(0.26%)#90 | 517,224(0.10%)#173 |
| 91. | Diamond Bar | 484 | 190,892(0.25%)#91 | 517,224(0.09%)#178 |
| 92. | Vista | 477 | 190,892(0.25%)#92 | 517,224(0.09%)#181 |
| 93. | Santa Monica | 477 | 190,892(0.25%)#93 | 517,224(0.09%)#182 |
| 94. | Chino Hills | 477 | 190,892(0.25%)#94 | 517,224(0.09%)#183 |
| 95. | San Jacinto | 477 | 190,892(0.25%)#95 | 517,224(0.09%)#184 |
| 96. | Banning | 474 | 190,892(0.25%)#96 | 517,224(0.09%)#185 |
| 97. | Yuba City | 473 | 190,892(0.25%)#97 | 517,224(0.09%)#186 |
| 98. | Rialto | 460 | 190,892(0.24%)#98 | 517,224(0.09%)#189 |
| 99. | Carson | 455 | 190,892(0.24%)#99 | 517,224(0.09%)#191 |
| 100. | Tustin | 449 | 190,892(0.24%)#100 | 517,224(0.09%)#193 |
Common Questions
What are the Top 10 Cities with the Largest Mexican American Indian Community in California?
Top 10 Cities with the Largest Mexican American Indian Community in California are:
#1
24,074
#2
5,024
#3
4,602
#4
3,420
#5
2,947
#6
2,550
#7
2,415
#8
2,372
#9
2,130
#10
1,988
What city has the Largest Mexican American Indian Community in California?
Los Angeles has the Largest Mexican American Indian Community in California with 24,074.
What is the Total Mexican American Indian Population in the State of California?
Total Mexican American Indian Population in California is 190,892.
What is the Total Mexican American Indian Population in the United States?
Total Mexican American Indian Population in the United States is 517,224.