Cities with the Lowest Poverty Level Among Seniors Over the Age of 75 in California
RELATED REPORTS & OPTIONS
Lowest Poverty | Seniors 75+
California
Compare Cities
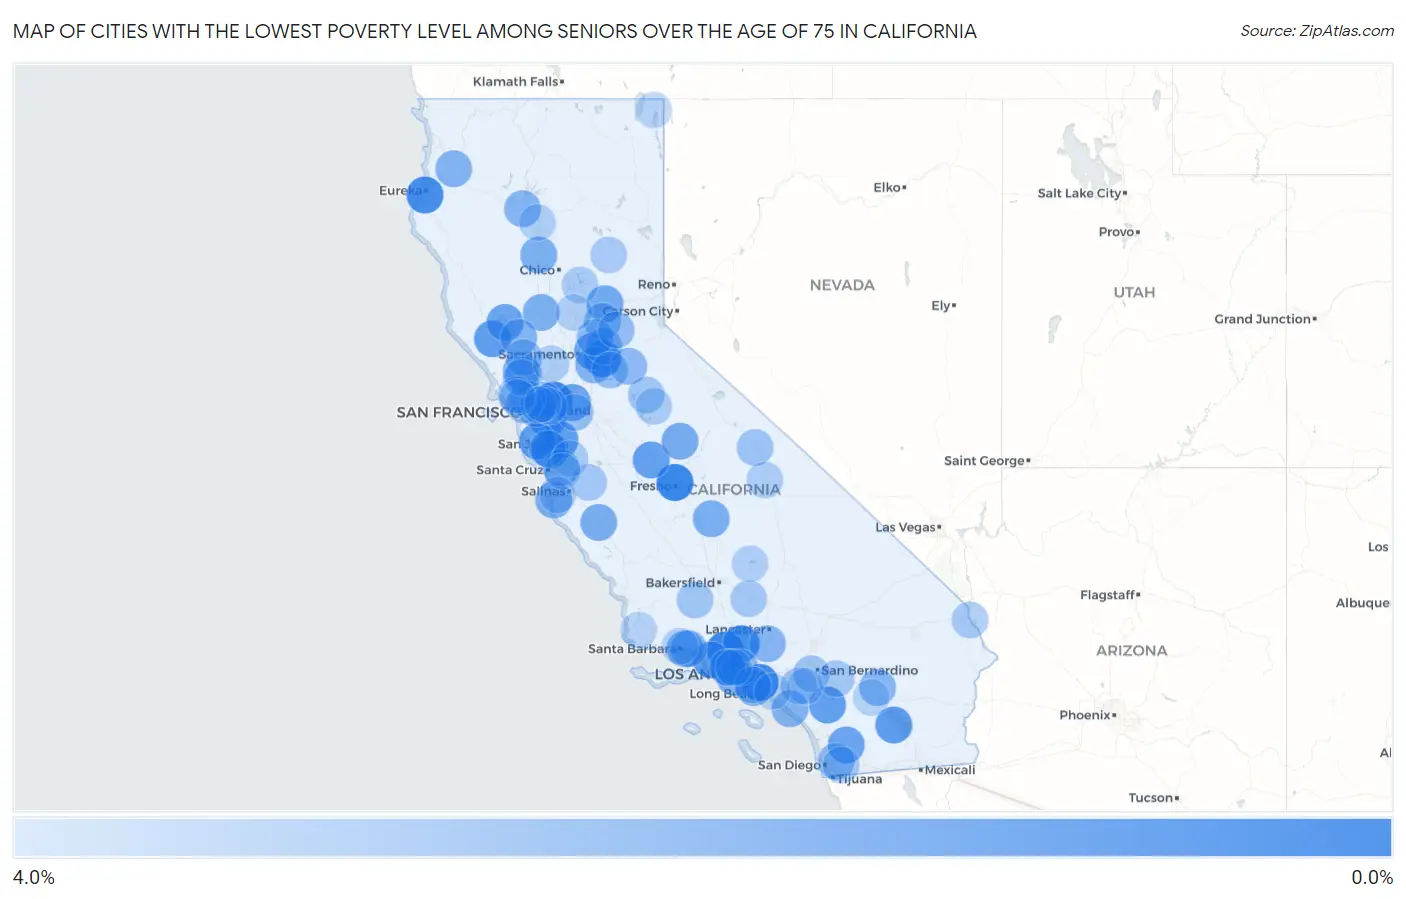
Map of Cities with the Lowest Poverty Level Among Seniors Over the Age of 75 in California
4.0%
0.0%
Cities with the Lowest Poverty Level Among Seniors Over the Age of 75 in California
| City | Senior Poverty | vs State | vs National | |
| 1. | Clayton | 0.25% | 12.3%(-12.1)#1 | 11.1%(-10.8)#17 |
| 2. | Old Fig Garden | 0.28% | 12.3%(-12.0)#2 | 11.1%(-10.8)#22 |
| 3. | West Athens | 0.42% | 12.3%(-11.9)#3 | 11.1%(-10.6)#41 |
| 4. | Fillmore | 0.44% | 12.3%(-11.9)#4 | 11.1%(-10.6)#44 |
| 5. | Happy Valley | 0.51% | 12.3%(-11.8)#5 | 11.1%(-10.6)#55 |
| 6. | Castaic | 0.58% | 12.3%(-11.7)#6 | 11.1%(-10.5)#65 |
| 7. | Rancho Murieta | 0.64% | 12.3%(-11.7)#7 | 11.1%(-10.4)#75 |
| 8. | Humboldt Hill | 0.70% | 12.3%(-11.6)#8 | 11.1%(-10.4)#86 |
| 9. | Monte Sereno | 0.73% | 12.3%(-11.6)#9 | 11.1%(-10.3)#90 |
| 10. | Westlake Village | 0.89% | 12.3%(-11.4)#10 | 11.1%(-10.2)#124 |
| 11. | El Sobrante Cdp Riverside County | 1.1% | 12.3%(-11.2)#11 | 11.1%(-9.97)#156 |
| 12. | Fairview | 1.1% | 12.3%(-11.2)#12 | 11.1%(-9.95)#166 |
| 13. | El Rio | 1.2% | 12.3%(-11.1)#13 | 11.1%(-9.83)#198 |
| 14. | Old Stine | 1.3% | 12.3%(-11.0)#14 | 11.1%(-9.77)#217 |
| 15. | Salton City | 1.4% | 12.3%(-11.0)#15 | 11.1%(-9.71)#238 |
| 16. | East Foothills | 1.4% | 12.3%(-10.9)#16 | 11.1%(-9.70)#242 |
| 17. | Cloverdale | 1.4% | 12.3%(-10.9)#17 | 11.1%(-9.67)#259 |
| 18. | French Valley | 1.4% | 12.3%(-10.9)#18 | 11.1%(-9.62)#270 |
| 19. | Portola Valley | 1.5% | 12.3%(-10.9)#19 | 11.1%(-9.61)#278 |
| 20. | Chowchilla | 1.6% | 12.3%(-10.8)#20 | 11.1%(-9.50)#320 |
| 21. | El Sobrante Cdp Contra Costa County | 1.6% | 12.3%(-10.7)#21 | 11.1%(-9.48)#330 |
| 22. | Rancho Mission Viejo | 1.7% | 12.3%(-10.7)#22 | 11.1%(-9.41)#361 |
| 23. | Gold River | 1.7% | 12.3%(-10.6)#23 | 11.1%(-9.40)#365 |
| 24. | San Diego Country Estates | 1.7% | 12.3%(-10.6)#24 | 11.1%(-9.34)#391 |
| 25. | Discovery Bay | 1.7% | 12.3%(-10.6)#25 | 11.1%(-9.33)#399 |
| 26. | Soda Bay | 1.8% | 12.3%(-10.5)#26 | 11.1%(-9.28)#417 |
| 27. | Nevada City | 2.0% | 12.3%(-10.3)#27 | 11.1%(-9.07)#516 |
| 28. | Eldridge | 2.1% | 12.3%(-10.3)#28 | 11.1%(-9.01)#566 |
| 29. | Ahwahnee | 2.1% | 12.3%(-10.2)#29 | 11.1%(-9.00)#568 |
| 30. | Malibu | 2.1% | 12.3%(-10.2)#30 | 11.1%(-8.97)#586 |
| 31. | King City | 2.1% | 12.3%(-10.2)#31 | 11.1%(-8.93)#610 |
| 32. | Exeter | 2.2% | 12.3%(-10.2)#32 | 11.1%(-8.90)#626 |
| 33. | Carmel By The Sea | 2.2% | 12.3%(-10.1)#33 | 11.1%(-8.90)#628 |
| 34. | Corning | 2.2% | 12.3%(-10.1)#34 | 11.1%(-8.84)#675 |
| 35. | Montecito | 2.2% | 12.3%(-10.1)#35 | 11.1%(-8.83)#682 |
| 36. | Williams | 2.3% | 12.3%(-10.1)#36 | 11.1%(-8.81)#688 |
| 37. | Hermosa Beach | 2.3% | 12.3%(-10.0)#37 | 11.1%(-8.78)#715 |
| 38. | Laguna Beach | 2.4% | 12.3%(-9.90)#38 | 11.1%(-8.66)#786 |
| 39. | Hidden Valley Lake | 2.4% | 12.3%(-9.89)#39 | 11.1%(-8.65)#797 |
| 40. | Hoopa | 2.5% | 12.3%(-9.86)#40 | 11.1%(-8.62)#816 |
| 41. | Wilton | 2.5% | 12.3%(-9.83)#41 | 11.1%(-8.59)#839 |
| 42. | Toro Canyon | 2.5% | 12.3%(-9.83)#42 | 11.1%(-8.58)#845 |
| 43. | Piedmont | 2.5% | 12.3%(-9.81)#43 | 11.1%(-8.56)#866 |
| 44. | Centerville | 2.5% | 12.3%(-9.80)#44 | 11.1%(-8.55)#867 |
| 45. | San Miguel Cdp Contra Costa County | 2.5% | 12.3%(-9.78)#45 | 11.1%(-8.54)#878 |
| 46. | Acton | 2.5% | 12.3%(-9.78)#46 | 11.1%(-8.53)#882 |
| 47. | Indio Hills | 2.6% | 12.3%(-9.75)#47 | 11.1%(-8.50)#901 |
| 48. | Corralitos | 2.6% | 12.3%(-9.70)#48 | 11.1%(-8.45)#936 |
| 49. | Lake Of The Pines | 2.6% | 12.3%(-9.68)#49 | 11.1%(-8.44)#948 |
| 50. | El Dorado Hills | 2.7% | 12.3%(-9.64)#50 | 11.1%(-8.39)#978 |
| 51. | Red Corral | 2.7% | 12.3%(-9.57)#51 | 11.1%(-8.32)#1,044 |
| 52. | Calabasas | 2.8% | 12.3%(-9.56)#52 | 11.1%(-8.31)#1,053 |
| 53. | Loomis | 2.8% | 12.3%(-9.53)#53 | 11.1%(-8.28)#1,073 |
| 54. | Casa De Oro Mount Helix | 2.9% | 12.3%(-9.46)#54 | 11.1%(-8.22)#1,119 |
| 55. | Georgetown | 2.9% | 12.3%(-9.42)#55 | 11.1%(-8.17)#1,157 |
| 56. | Mountain House | 2.9% | 12.3%(-9.38)#56 | 11.1%(-8.13)#1,180 |
| 57. | Sonoma | 2.9% | 12.3%(-9.37)#57 | 11.1%(-8.12)#1,203 |
| 58. | Reliez Valley | 3.0% | 12.3%(-9.32)#58 | 11.1%(-8.08)#1,232 |
| 59. | Lake Sherwood | 3.0% | 12.3%(-9.30)#59 | 11.1%(-8.05)#1,251 |
| 60. | Manhattan Beach | 3.0% | 12.3%(-9.30)#60 | 11.1%(-8.05)#1,252 |
| 61. | Ione | 3.0% | 12.3%(-9.27)#61 | 11.1%(-8.03)#1,276 |
| 62. | Alamo | 3.0% | 12.3%(-9.27)#62 | 11.1%(-8.02)#1,278 |
| 63. | St Helena | 3.1% | 12.3%(-9.26)#63 | 11.1%(-8.01)#1,290 |
| 64. | North Richmond | 3.1% | 12.3%(-9.24)#64 | 11.1%(-8.00)#1,299 |
| 65. | Tiburon | 3.1% | 12.3%(-9.19)#65 | 11.1%(-7.95)#1,335 |
| 66. | Wilkerson | 3.1% | 12.3%(-9.19)#66 | 11.1%(-7.94)#1,347 |
| 67. | Coronita | 3.1% | 12.3%(-9.17)#67 | 11.1%(-7.93)#1,363 |
| 68. | Bloomington | 3.2% | 12.3%(-9.11)#68 | 11.1%(-7.87)#1,405 |
| 69. | Sleepy Hollow | 3.2% | 12.3%(-9.09)#69 | 11.1%(-7.84)#1,422 |
| 70. | Orinda | 3.2% | 12.3%(-9.07)#70 | 11.1%(-7.83)#1,453 |
| 71. | Taft | 3.3% | 12.3%(-9.05)#71 | 11.1%(-7.80)#1,473 |
| 72. | Phoenix Lake | 3.3% | 12.3%(-9.03)#72 | 11.1%(-7.79)#1,480 |
| 73. | Saratoga | 3.3% | 12.3%(-9.01)#73 | 11.1%(-7.77)#1,501 |
| 74. | Needles | 3.4% | 12.3%(-8.92)#74 | 11.1%(-7.68)#1,582 |
| 75. | Tres Pinos | 3.4% | 12.3%(-8.92)#75 | 11.1%(-7.68)#1,588 |
| 76. | Golden Hills | 3.4% | 12.3%(-8.92)#76 | 11.1%(-7.67)#1,597 |
| 77. | Temelec | 3.4% | 12.3%(-8.91)#77 | 11.1%(-7.67)#1,598 |
| 78. | Cherry Valley | 3.4% | 12.3%(-8.91)#78 | 11.1%(-7.67)#1,600 |
| 79. | San Anselmo | 3.4% | 12.3%(-8.91)#79 | 11.1%(-7.66)#1,603 |
| 80. | Jamul | 3.5% | 12.3%(-8.84)#80 | 11.1%(-7.59)#1,659 |
| 81. | Monterey | 3.5% | 12.3%(-8.83)#81 | 11.1%(-7.59)#1,665 |
| 82. | Quincy | 3.5% | 12.3%(-8.79)#82 | 11.1%(-7.55)#1,691 |
| 83. | Morgan Hill | 3.6% | 12.3%(-8.74)#83 | 11.1%(-7.50)#1,729 |
| 84. | Pine Mountain Lake | 3.6% | 12.3%(-8.74)#84 | 11.1%(-7.49)#1,765 |
| 85. | Agoura Hills | 3.6% | 12.3%(-8.72)#85 | 11.1%(-7.48)#1,773 |
| 86. | Kelly Ridge | 3.6% | 12.3%(-8.72)#86 | 11.1%(-7.47)#1,775 |
| 87. | Independence | 3.6% | 12.3%(-8.70)#87 | 11.1%(-7.45)#1,791 |
| 88. | Allendale | 3.7% | 12.3%(-8.66)#88 | 11.1%(-7.41)#1,825 |
| 89. | Mission Canyon | 3.7% | 12.3%(-8.65)#89 | 11.1%(-7.40)#1,834 |
| 90. | Marysville | 3.7% | 12.3%(-8.65)#90 | 11.1%(-7.40)#1,835 |
| 91. | Home Gardens | 3.7% | 12.3%(-8.62)#91 | 11.1%(-7.38)#1,854 |
| 92. | Lake California | 3.7% | 12.3%(-8.62)#92 | 11.1%(-7.38)#1,855 |
| 93. | Lake Isabella | 3.7% | 12.3%(-8.60)#93 | 11.1%(-7.35)#1,888 |
| 94. | Lafayette | 3.7% | 12.3%(-8.57)#94 | 11.1%(-7.33)#1,907 |
| 95. | Indian Wells | 3.8% | 12.3%(-8.52)#95 | 11.1%(-7.27)#1,965 |
| 96. | Rossmoor | 3.8% | 12.3%(-8.50)#96 | 11.1%(-7.25)#1,985 |
| 97. | Amesti | 3.8% | 12.3%(-8.48)#97 | 11.1%(-7.24)#1,996 |
| 98. | Fort Bidwell | 3.8% | 12.3%(-8.47)#98 | 11.1%(-7.22)#2,028 |
| 99. | Spring Valley Cdp San Diego County | 3.9% | 12.3%(-8.46)#99 | 11.1%(-7.21)#2,034 |
| 100. | Mission Hills | 3.9% | 12.3%(-8.44)#100 | 11.1%(-7.19)#2,048 |
Common Questions
What are the Top 10 Cities with the Lowest Poverty Level Among Seniors Over the Age of 75 in California?
Top 10 Cities with the Lowest Poverty Level Among Seniors Over the Age of 75 in California are:
#1
0.25%
#2
0.28%
#3
0.42%
#4
0.44%
#5
0.58%
#6
0.64%
#7
0.70%
#8
0.73%
#9
0.89%
#10
1.1%
What city has the Lowest Poverty Level Among Seniors Over the Age of 75 in California?
Clayton has the Lowest Poverty Level Among Seniors Over the Age of 75 in California with 0.25%.
What is the Poverty Level Among Seniors Over the Age of 75 in the State of California?
Poverty Level Among Seniors Over the Age of 75 in California is 12.3%.
What is the Poverty Level Among Seniors Over the Age of 75 in the United States?
Poverty Level Among Seniors Over the Age of 75 in the United States is 11.1%.